. 2019 Jun 7:9:480.
doi: 10.3389/fonc.2019.00480. eCollection 2019.

Breast Cancer Subtypes Present a Differential Production of Reactive Oxygen Species (ROS) and Susceptibility to Antioxidant Treatment

Affiliations

Breast Cancer Subtypes Present a Differential Production of Reactive Oxygen Species (ROS) and Susceptibility to Antioxidant Treatment

Fabiola Lilí Sarmiento-Salinas et al. Front Oncol. .

Abstract

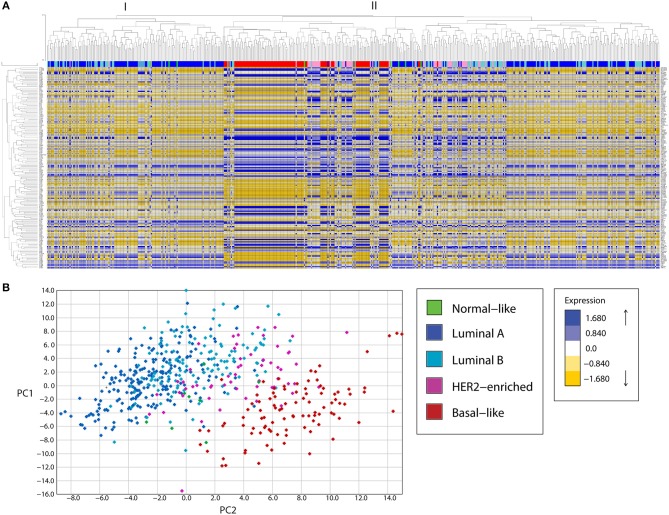
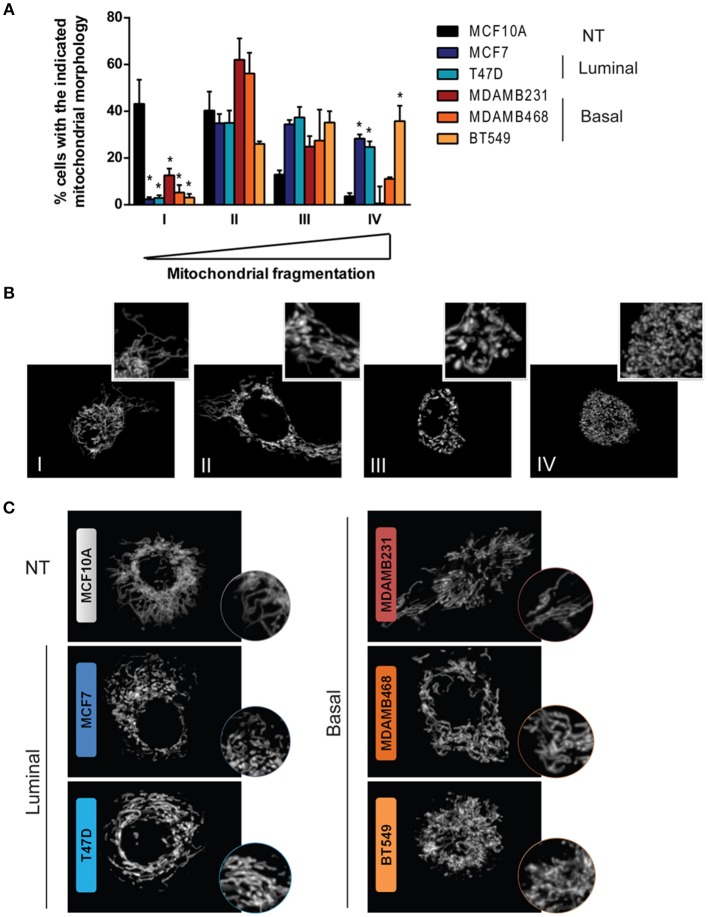
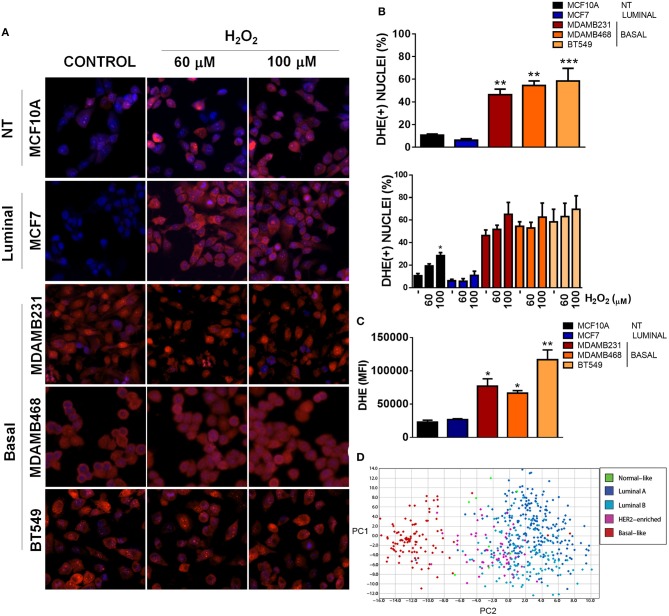
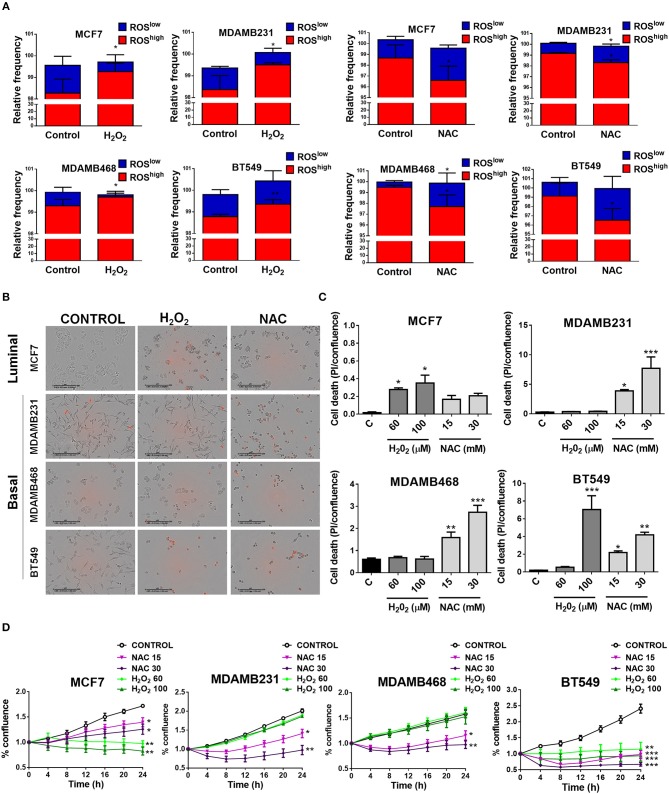
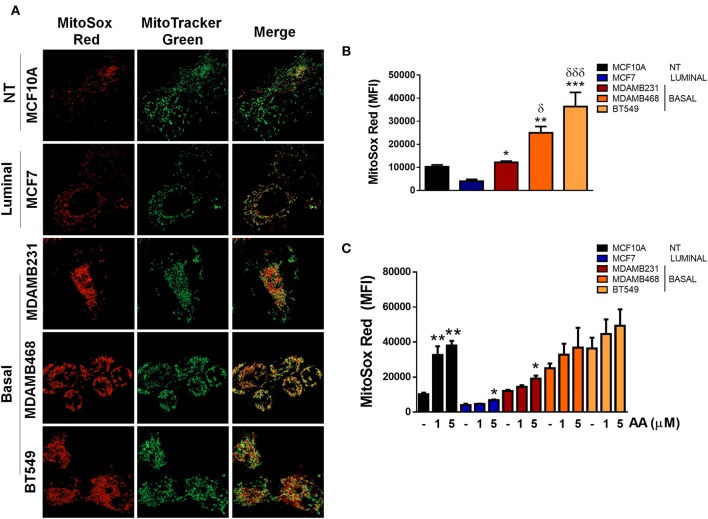
Due to their crucial role in cell metabolism and homeostasis, alterations in mitochondrial biology and function have been related to the progression of diverse diseases including cancer. One of the consequences associated to mitochondrial dysfunction is the production of reactive oxygen species (ROS). ROS are known to have a controversial role during cancer initiation and progression and although several studies have tried to manipulate intracellular ROS levels using antioxidants or pro-oxidation conditions, it is not yet clear how to target oxidation for cancer therapy. In this study, we found differences in mitochondrial morphology in breast cancer cells when compared to a non-tumorigenic cell line and differences in mitochondrial function among breast cancer subtypes when exploring gene-expression data from the TCGA tumor dataset. Interestingly, we found increased ROS levels in triple negative breast cancer (TNBC) cell lines and a dependency on ROS for survival since antioxidant treatment induced cell death in TNBC cells but not in an estrogen receptor positive (ER+) cell line. Moreover, we identified the mitochondria as the main source of ROS in TNBC cell lines. Our results indicate a potential use for ROS as a target for therapy in the TNBC subtype which currently has the worst prognosis among all breast cancers and remains as the only breast cancer subtype which lacks a targeted therapy.

Keywords: ROS; breast cancer; mitochondria; mitochondrial ROS; mitochondrial morphology.


Figures

Figure 1
Figure 1
A mitochondria-related gene signature separates breast cancer tumor samples in clusters according to the tumor subtype, in a bioinformatic analysis of gene expression. (A) A mitochondria-related gene expression signature was analyzed in TCGA breast tumor samples using unsupervised hierarchical clustering analysis, revealing clusters of samples enriched in molecular subtypes. Two major clusters were found (I, II). Cluster I was enriched in luminal samples while cluster II showed two major sub-groups. The first subgroup was enriched in basal and HER-2 enriched samples while the other was heterogeneous with one sub-group enriched in luminal samples and another containing luminal B and HER2-enriched tumors. (B) Principal component analysis (PCA) revealed three main clusters, a cluster of Luminal A and B tumors (left), an intermediate group composed of HER2-enriched and some Luminal B samples and a Basal-like enriched cluster (right). PC, principal component.
Figure 2
Figure 2
Breast cancer cell lines show differences in mitochondrial morphology and increased mitochondrial fragmentation than a non-tumorigenic cell line. (A) Mitotracker staining revealed differences in mitochondrial morphology among breast cancer cell lines. (B) Cells were classified as completely tubular (I), tubular with some fragments (II), fragmented with some tubules (III), or completely fragmented (IV). The graph in (A) shows the percentage of cells with the corresponding mitochondrial morphology as shown in (B). In (C) representative images of the characteristic morphology per cell line is shown. The graph in (A) shows mean ± SEM of 3–5 independent experiments. Sixty to one hundred individual cells were classified per experiment by two independent observers. *Different to MCF10A with p < 0.05.
Figure 3
Figure 3
Basal, TNBC cell lines have elevated ROS levels when compared to non-tumorigenic or luminal breast cancer cell lines. (A) ROS levels were evaluated by fluorescence microscopy using dihydroethidium (DHE) staining (red) and total nuclei were stained with Hoechst (blue). Cells were treated with the indicated concentrations of H2O2. (B) DHE positive nuclei were counted and graphed as a percentage of total nuclei. (C) ROS levels were quantitatively evaluated by flow cytometry in the different cell lines. (D) A ROS-related gene signature PCA analysis clearly clustered basal-like tumors separate from the other breast cancer subtypes. Graphs show mean ± SEM of 3–5 independent experiments, *Different to MCF10A and MCF7 or to their respective control with *p < 0.05; **p < 0.01, and ***p < 0.001. PC, principal component.
Figure 4
Figure 4
Basal, TNBC cell lines are dependent on ROS for survival. (A) Cells were treated with oxidating conditions (H2O2) or with an antioxidant (NAC, N-acetyl cysteine) at the indicated concentrations. One hundred micromolar H2O2 treatment increased the ROShigh or decreased the ROSlow population and 30 mM NAC had the opposite effect in all breast cancer cell lines studied. (B,C) Cell death was evaluated as propidium iodide staining [% confluency of PI(+) cells] and normalized to total % confluency. (D) Cell proliferation was evaluated as changes in cell confluency in an Incucyte real time cell imaging system. Graphs show mean ± SEM of more than 3 independent experiments. *different to control, p < 0.05; **different to control, p < 0.01; and ***different to control, p < 0.001.
Figure 5
Figure 5
ROS in basal, TNBC cell lines are derived from the mitochondria. (A) Mitochondria were stained with Mitotracker (green) and MitoSox (red) to evaluate production of mitochondrial ROS. (B) Quantification of MitoSox fluorescence was performed by flow cytometry in basal conditions or (C) in cells treated with Antimycin A (AA) at the indicated concentrations. Graphs show mean ± SEM of 3 independent experiments. In (B) *different to MCF7 and δdifferent to MCF10A. In (C) *different to control. *p < 0.05; **p < 0.01; ***p < 0.001; *δ <0.05; and ***δδδ <0.001.

References

    1. Russnes HG, Lingjaerde OC, Borresen-Dale AL, Caldas C. Breast cancer molecular stratification: from intrinsic subtypes to integrative clusters. Am J Pathol. (2017) 187:2152–62. 10.1016/j.ajpath.2017.04.022 - DOI - PubMed
    1. Sorlie T. Molecular portraits of breast cancer: tumour subtypes as distinct disease entities. Eur J Cancer. (2004) 40:2667–75. 10.1016/j.ejca.2004.08.021 - DOI - PubMed
    1. Sorlie T. The impact of gene expression patterns in breast cancer. Clin Chem. (2016) 62:1150–1. 10.1373/clinchem.2015.253229 - DOI - PubMed
    1. Prat A, Perou CM. Deconstructing the molecular portraits of breast cancer. Mol Oncol. (2011) 5:5–23. 10.1016/j.molonc.2010.11.003 - DOI - PMC - PubMed
    1. Coates AS, Winer EP, Goldhirsch A, Gelber RD, Gnant M, Piccart-Gebhart M, et al. . Tailoring therapies–improving the management of early breast cancer: St. Gallen international expert consensus on the primary therapy of early breast cancer 2015. Ann Oncol. (2015) 26:1533–46. 10.1093/annonc/mdv221 - DOI - PMC - PubMed

LinkOut - more resources