. 2019 May 31:7:82.
doi: 10.3389/fcell.2019.00082. eCollection 2019.

Transcriptome Analysis of Small Molecule-Mediated Astrocyte-to-Neuron Reprogramming

Affiliations

Transcriptome Analysis of Small Molecule-Mediated Astrocyte-to-Neuron Reprogramming

Ning-Xin Ma et al. Front Cell Dev Biol. .

Abstract

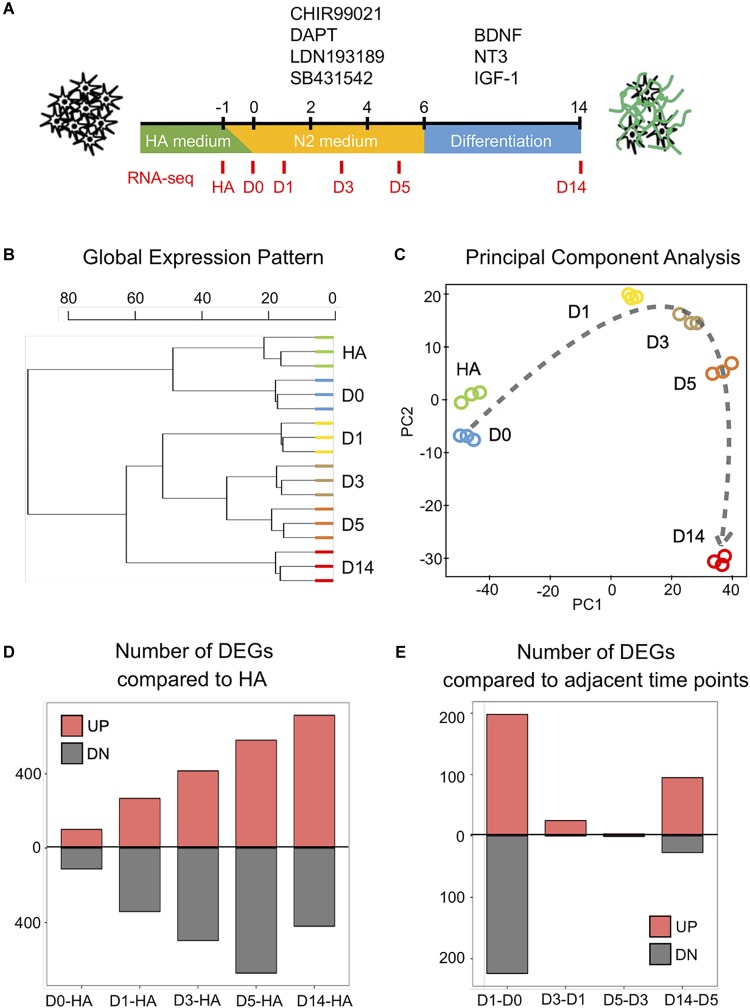
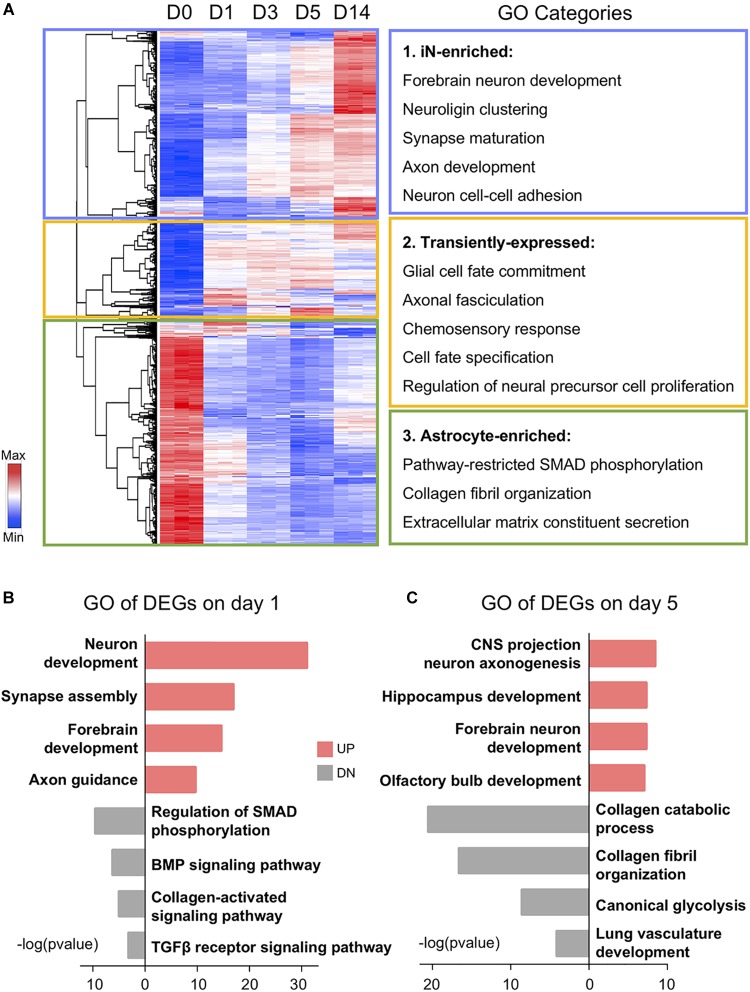
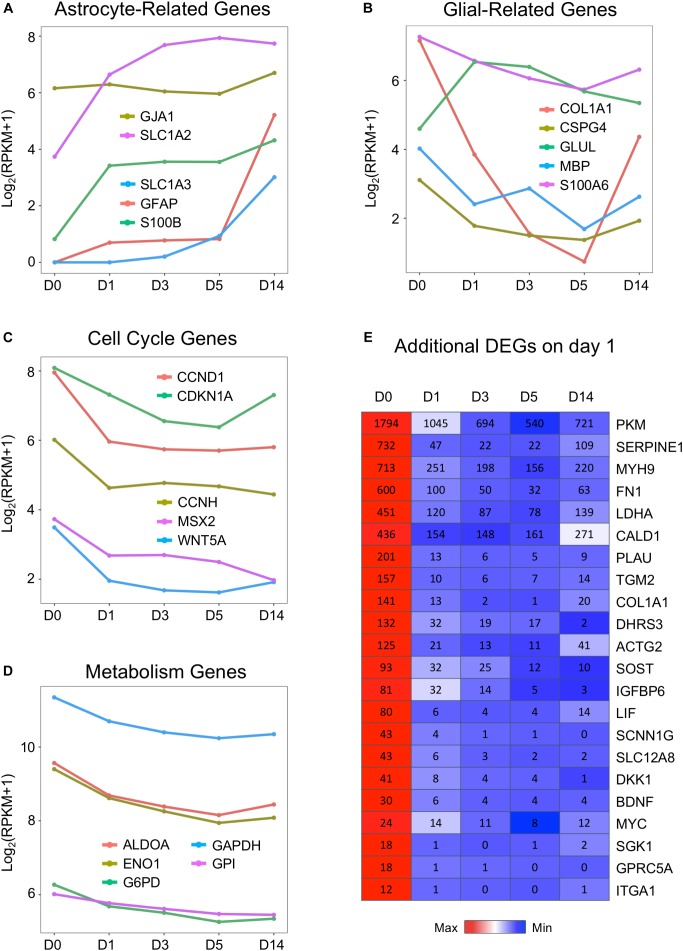
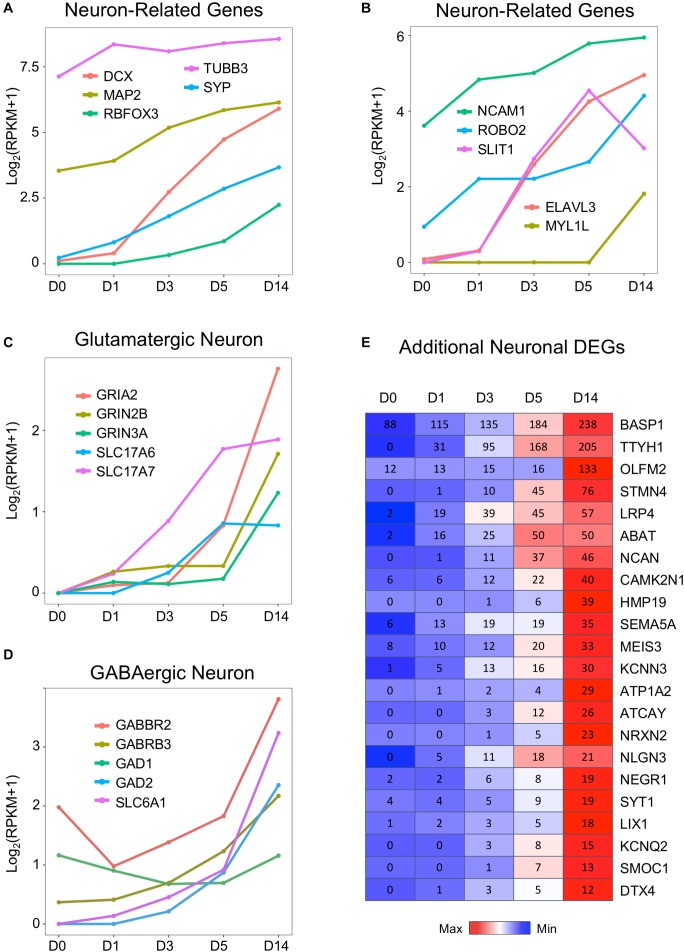
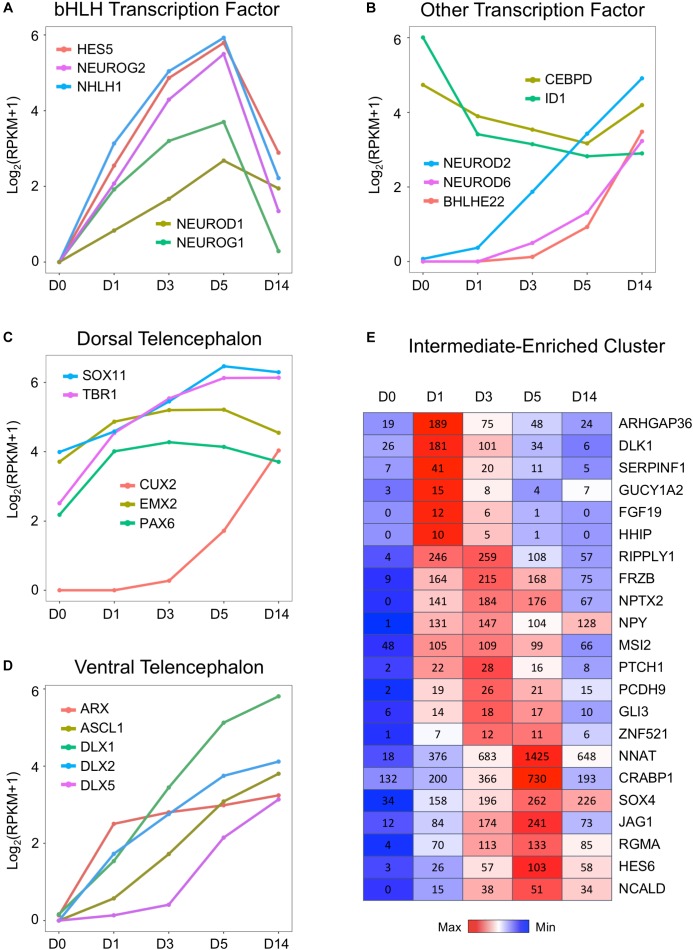
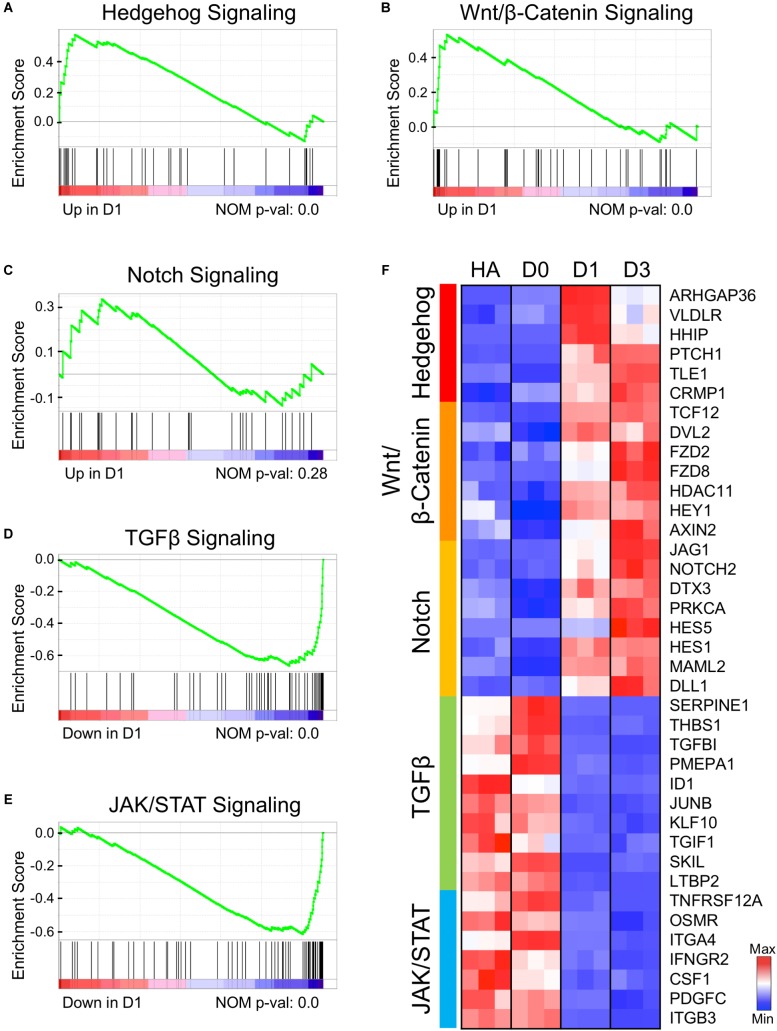
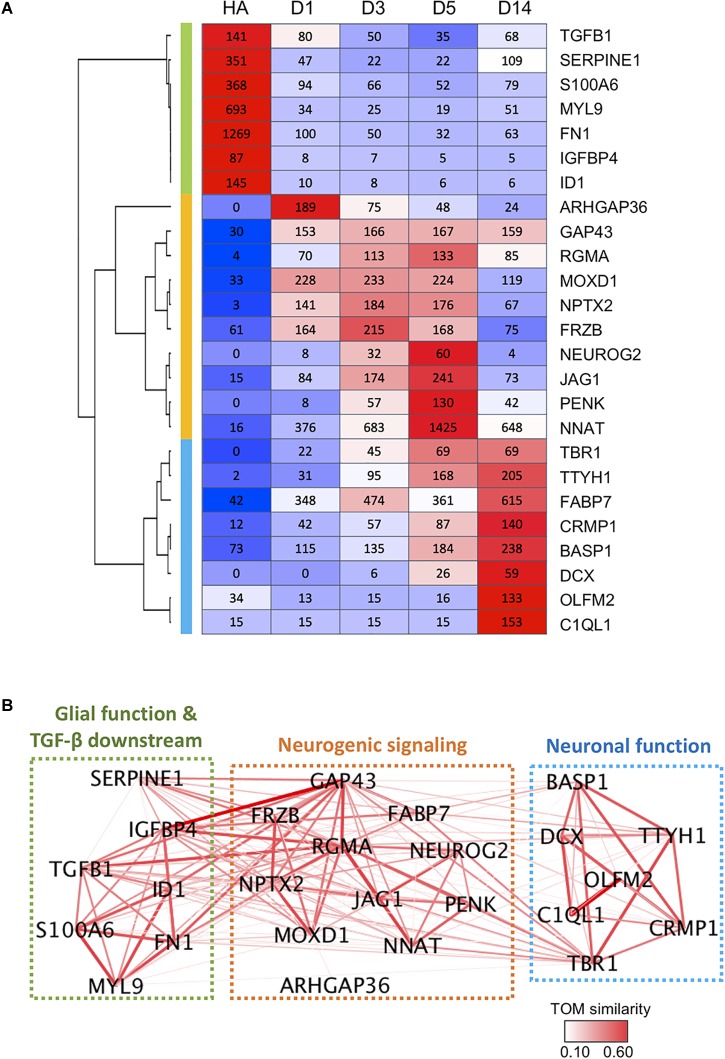
Chemical reprogramming of astrocytes into neurons represents a promising approach to regenerate new neurons for brain repair, but the underlying mechanisms driving this trans-differentiation process are not well understood. We have recently identified four small molecules - CHIR99021, DAPT, LDN193189, and SB431542 - that can efficiently reprogram cultured human fetal astrocytes into functional neurons. Here we employ the next generation of RNA-sequencing technology to investigate the transcriptome changes during the astrocyte-to-neuron (AtN) conversion process. We found that the four small molecules can rapidly activate the hedgehog signaling pathway while downregulating many glial genes such as FN1 and MYL9 within 24 h of treatment. Chemical reprogramming is mediated by several waves of differential gene expression, including upregulation of hedgehog, Wnt/β-catenin, and Notch signaling pathways, together with downregulation of TGF-β and JAK/STAT signaling pathways. Our gene network analyses reveal many well-connected hub genes such as repulsive guidance molecule A (RGMA), neuronatin (NNAT), neurogenin 2 (NEUROG2), NPTX2, MOXD1, JAG1, and GAP43, which may coordinate the chemical reprogramming process. Together, these findings provide critical insights into the molecular cascades triggered by a combination of small molecules that eventually leads to chemical conversion of astrocytes into neurons.

Keywords: astrocyte; chemical reprogramming; neuron; signaling pathway; transcriptome.


Figures

FIGURE 1
FIGURE 1
Genome-wide changes in response to the core drug treatment. (A) Schematic illustration of the overall experimental design. The four core drugs (CHIR99021, DAPT, LDN193189, SB431542) were added on day 0 and refreshed every other day in N2 medium. After 6 days, cells were transferred into differentiation medium with neurotrophic factors to promote for neuronal maturation. (B) Hierarchical clustering among all the samples from human astrocytes (HAs), day 0 (D0), day 1 (D1), day 3 (D3), day 5 (D5), and day 14 (D14) based on the expression of 16,324 genes detected (n = 3 biological replicates for each time point). (C) Principal component analysis of all the samples. Dashed line indicates the conversion trajectory. Note that HA and D0 samples were before drug treatment, D1–D5 samples were during drug treatment, and D14 was after drug treatment. (D) Histogram shows the number of differentially expressed genes (DEGs) (adjusted p < 0.01, fold change >3) among D0–D14 samples in all the pair-wise comparisons with HA. (E) Histogram of the number of DEGs in pair-wise comparisons between adjacent time points (D1–D0, D3–D1, D5–D3, D14–D5).
FIGURE 2
FIGURE 2
Gene ontology (GO) analysis showing functional transition from astrocytes to neurons. (A) Hierarchical clustering and heat map of RNA-seq data showing all the differentially expressed genes (1,889 DEGs) among D0–D14 samples. Red color indicates high expression level, whereas blue color indicates low expression level. DEGs were divided into three clusters based on their expression patterns. GO categories associated with each cluster are shown on the right. (B,C) Top four significant GO terms associated with upregulated (UP) and downregulated (DN) genes on days 1 and 5 of small molecule treatment. Note that upregulated GO terms are associated with neuronal genes and downregulated GO terms are associated with glial genes.
FIGURE 3
FIGURE 3
Downregulation of cell cycle and metabolic genes by small molecules. (A,B) Representative glial marker genes during chemical reprogramming process. The small molecule treatment did not change the transcriptional level of GFAP and S100B. The glutamate transporters (SLC1A2 or EAA2/GLT-1 and SLC1A3 or EAA1/GLAST) were upregulated, whereas COL1A1 (collagen) and CSPG4 (NG2) were downregulated. (C) Genes related to the cell cycle process showed decreased expression, with a significant drop at D1. (D) Genes involved in glycolysis (ALDOA, ENO1, GAPDH, G6PD) were uniformly downregulated by small molecule treatment. (E) Heat map of representative genes showing significant downregulation during the chemical conversion process. Color scaled within each row and FPKM values are presented. Red color indicates highest expression level within each row, whereas blue color indicates low expression level within each row.
FIGURE 4
FIGURE 4
Neuronal genes were activated by the core drugs and highly expressed in D14 samples. (A) Typical neuronal marker genes such as doublecortin (DCX), RBFOX3 (NeuN), MAP2, and synaptophysin (SYP) were highly upregulated upon the application of small molecules. Note that DCX increased much faster than NeuN. Interestingly, βIII-tubulin (TUBB3, often labeled with TUJ1 antibody) was highly expressed in HAs and only modestly increased during chemical treatment. (B) Neuronal cell adhesion molecules (NCAM1) and chemoattractant/chemorepellent genes (SLIT1/ROBO2) were upregulated by small molecule treatment. (C) Dramatic increase of glutamatergic neuron–related genes, including subunits of AMPA receptors (GRIA) and NMDA receptors (GRIN), as well as vesicular glutamate transporters (SLC17A6 = VGLUT2; SLC17A7 = VGLUT1). (D) Expression profile of GABAergic neuron–related genes, including GABA receptor subunits, glutamate decarboxylases, and GABA transporters. GABBR2 = GABA type B receptor subunit 2. GABRB3 = GABA type A receptor subunit β3. GAD1 = GAD67. GAD2 = GAD65. SLC6A1 = GAT1. (E) Heat map of representative genes that were highly upregulated in D14 samples after core drug treatment. Color scaled within each row and FPKM values presented.
FIGURE 5
FIGURE 5
Upregulation of neural transcription factors during chemical reprogramming of astrocytes into neurons. (A) Rapid activation of the bHLH family of transcription factors involved in neurogenic development process during the chemical conversion process. Note that these neural transcription factors were downregulated at D14 when neuronal conversion was completed. (B) Additional neural transcription factors that were upregulated by small molecules, such as NEUROD2/6 and BHLEH22. In contrast, DNA binding inhibitor ID1 and astrocytic enhancer binding CEBPD were downregulated. (C) Genes involved in dorsal telencephalon development were upregulated during core drug treatment. Note that cortical neuron marker genes TBR1 and CUX2 were significantly increased by small molecules. (D) Transcription factors involved in ventral telencephalon development such as ASCL1 and its downstream targets ARX and DLX were also upregulated. (E) Representative gene expression waves that peaked at D1, D3, and D5 during the chemical conversion process. The first wave peaked on D1 included several hedgehog genes such as ARHGAP36 and DLK1. Color scaled within row and FPKM values presented.
FIGURE 6
FIGURE 6
Early genetic alternations of signaling pathways in response to core drug treatment. (A–E) Gene set enrichment analysis (GSEA) of D1 samples compared to HAs revealed several signaling pathways that were either activated (A–C) or suppressed (D,E) at the initiation stage of chemical reprogramming. (F) Heat map illustrating the leading-edge subsets of genes corresponding to each signaling pathway shown in (A–E). Color scaled within each row. Red color indicates high expression level, while blue color indicates low expression level.
FIGURE 7
FIGURE 7
Gene co-expression network during chemical reprogramming. (A) Top 25 most highly expressed DEGs with significant changes during chemical reprogramming process. Three major clusters were identified and are color-coded on the left bar (green, orange, and blue), which correspond to the color squares in (B). (B) The weighted correlation network of genes shown in panel A was plotted using WGCNA. Edge color and thickness indicate TOM similarity. Different clusters had been grouped together in three squares, and their functional connections were annotated. See also Supplementary Figure S4 for weighted degree of connectivity (node size) plotted by igraph.

Similar articles

Cited by

References

    1. Abad M., Hashimoto H., Zhou H., Morales M. G., Chen B., Bassel-Duby R., et al. (2017). Notch inhibition enhances cardiac reprogramming by increasing MEF2C transcriptional activity. Stem Cell Rep. 8 548–560. 10.1016/j.stemcr.2017.01.025 - DOI - PMC - PubMed
    1. Bélanger M., Allaman I., Magistretti P. J. (2011). Brain energy metabolism: focus on astrocyte–neuron metabolic cooperation. Cell Metab. 14 724–738. 10.1016/j.cmet.2011.08.016 - DOI - PubMed
    1. Berninger B., Costa M. R., Koch U., Schroeder T., Sutor B., Grothe B., et al. (2007). Functional properties of neurons derived from in vitro reprogrammed postnatal astroglia. J. Neurosci. 27 8654–8664. - PMC - PubMed
    1. Borghese L., Dolezalova D., Opitz T., Haupt S., Leinhaas A., Steinfarz B., et al. (2010). Inhibition of Notch signaling in human embryonic stem cell–derived neural stem cells delays G1/S phase transition and accelerates neuronal differentiation in vitro and in vivo. Stem Cells 28 955–964. 10.1002/stem.408 - DOI - PubMed
    1. Bormuth I., Yan K., Yonemasu T., Gummert M., Zhang M., Wichert S., et al. (2013). Neuronal basic helix–loop–helix proteins Neurod2/6 regulate cortical commissure formation before midline interactions. J. Neurosci. 33 641–651. - PMC - PubMed