. 2019 Jun 13:2:205.
doi: 10.1038/s42003-019-0453-z. eCollection 2019.

Cardiac interstitial tetraploid cells can escape replicative senescence in rodents but not large mammals

Affiliations

Cardiac interstitial tetraploid cells can escape replicative senescence in rodents but not large mammals

Kathleen M Broughton et al. Commun Biol. .

Abstract

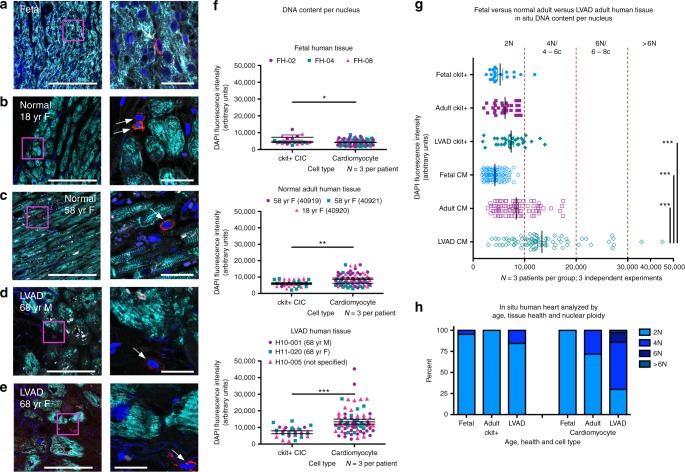
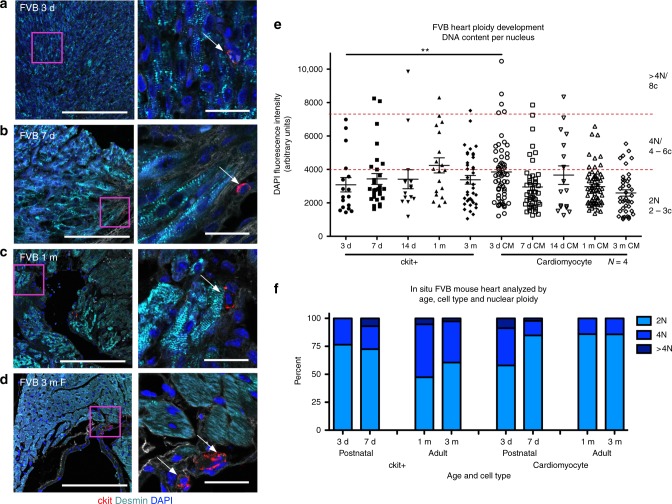
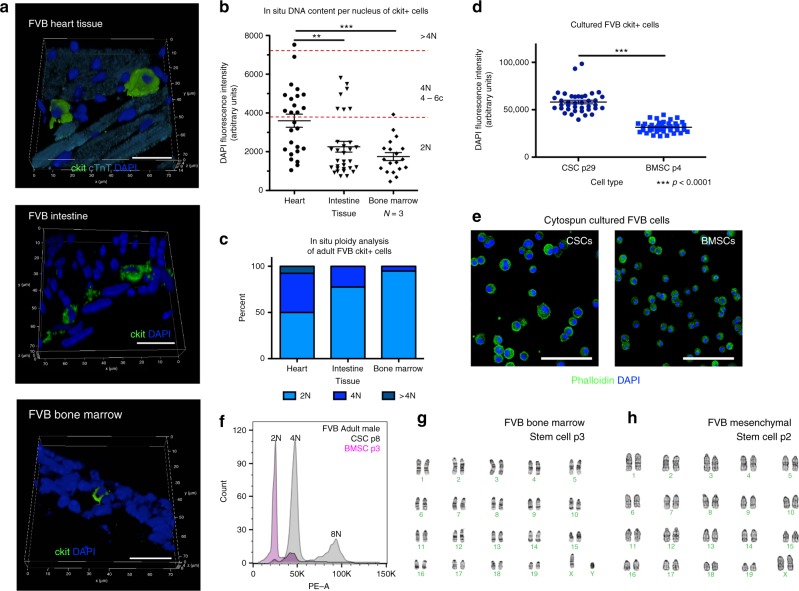
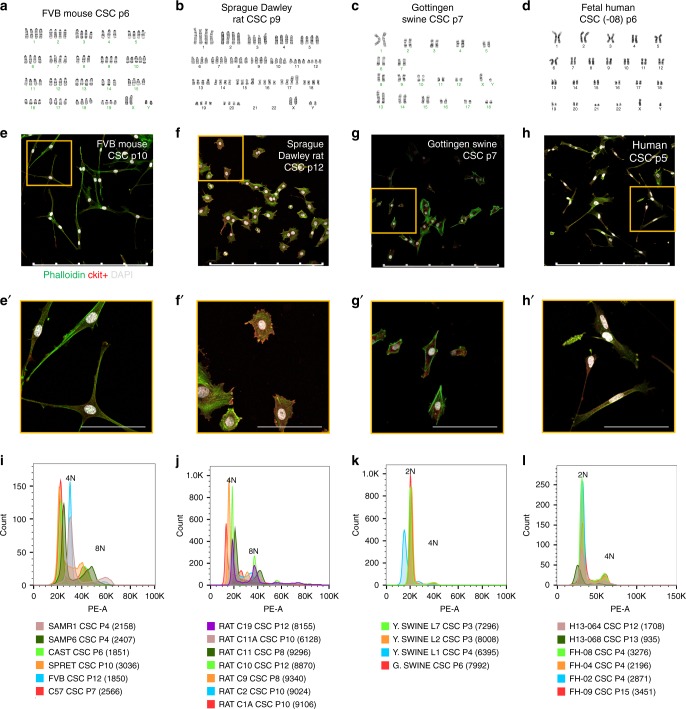
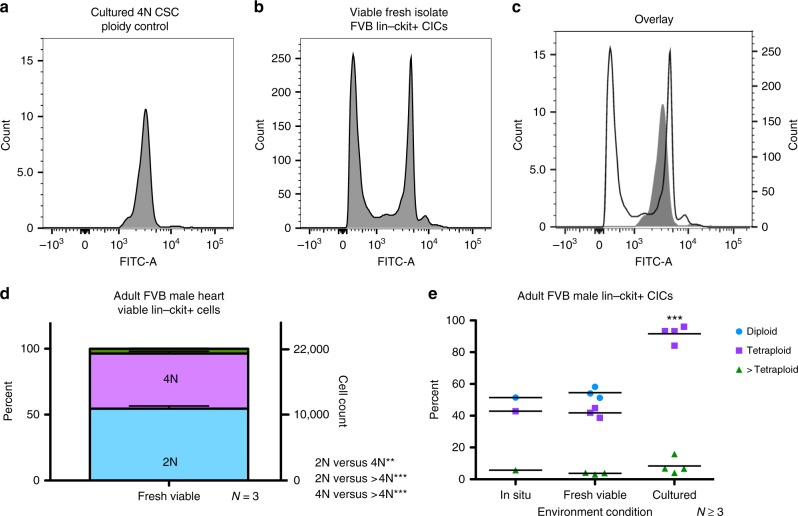
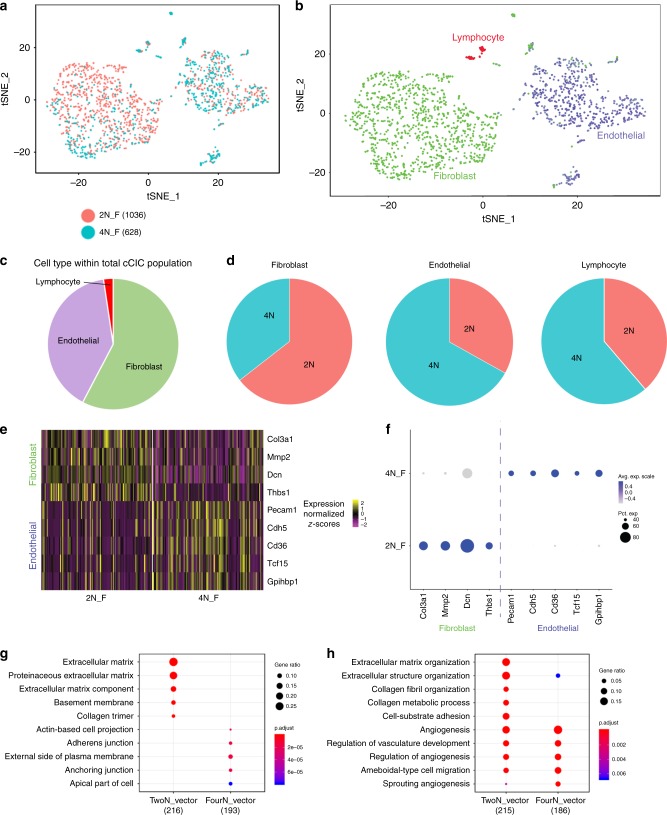
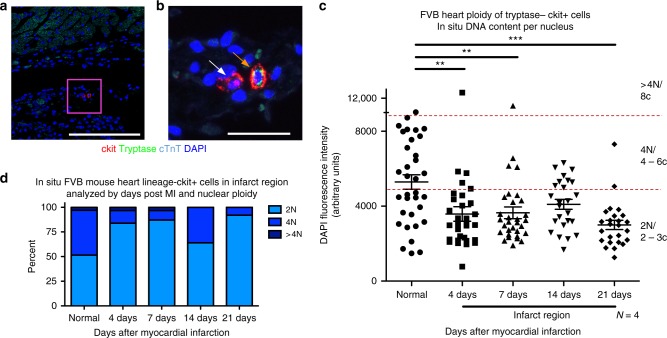
Cardiomyocyte ploidy has been described but remains obscure in cardiac interstitial cells. Ploidy of c-kit+ cardiac interstitial cells was assessed using confocal, karyotypic, and flow cytometric technique. Notable differences were found between rodent (rat, mouse) c-kit+ cardiac interstitial cells possessing mononuclear tetraploid (4n) content, compared to large mammals (human, swine) with mononuclear diploid (2n) content. In-situ analysis, confirmed with fresh isolates, revealed diploid content in human c-kit+ cardiac interstitial cells and a mixture of diploid and tetraploid content in mouse. Downregulation of the p53 signaling pathway provides evidence why rodent, but not human, c-kit+ cardiac interstitial cells escape replicative senescence. Single cell transcriptional profiling reveals distinctions between diploid versus tetraploid populations in mouse c-kit+ cardiac interstitial cells, alluding to functional divergences. Collectively, these data reveal notable species-specific biological differences in c-kit+ cardiac interstitial cells, which could account for challenges in extrapolation of myocardial from preclinical studies to clinical trials.

Keywords: Heart stem cells.


Conflict of interest statement

Competing interestsThe authors declare no competing interests.

Figures

Fig. 1
Fig. 1
Higher ploidy level increases with age and disease in human cardiomyocytes. Human myocardial tissue sections assessed by in situ quantitation of ploidy level from 16-week-old fetal (a), 18- (b), and 58- (c) year-old female with normal heart histology and function, and 68-year-old male (d) and female (e) explanted from the left ventricle free wall from heart failure patients receiving the LVAD implant (zoomed-out scalebar = 150 μm; zoomed-in scalebar = 25 μm). Boxed regions of higher magnification are shown to the right of each scan. Arrows point to example cCICs included in the analysis. Quantitation of in situ DNA content per nucleus of cardiomyocytes and ckit+ cells measured by DAPI fluorescent intensity of the nucleus within 3D reconstruction of tissue, analyzed by t test (f). Compiled data of in situ DNA content per nucleus of cardiomyocytes and ckit+ cells measured by DAPI fluorescent intensity of the nucleus within 3D reconstruction of tissue (g). Percent of cCICs and cardiomyocyte nuclei with diploid tetraploid and higher ploidy content (h). *P < 0.05; **P < 0.01; ***P < 0.001. Data are presented as mean±SEM and analyzed using a t test (f) or one-way ANOVA with Bonferroni post hoc test (g)
Fig. 2
Fig. 2
Ploidy variability in murine cardiomyocytes and c-kit+ CICs. FVB mouse myocardial tissue sections assessed by in situ quantitation of ploidy level post birth at 3 days (a), 7 days (b), 30 days (c), and 90 days (d) (zoomed-out scalebar = 150 μm; zoomed-in scalebar = 25 μm). Boxed regions of higher magnification are shown to the right of each scan. Arrows point to example cCICs included in the analysis. Compiled quantification of in situ DNA content per nucleus of cardiomyocytes and ckit+ cells measured by DAPI fluorescent intensity of the nucleus within 3D reconstruction of tissue (e). Percent of cCICs and cardiomyocytes nuclei with diploid tetraploid and higher ploidy content (f). **P < 0.01. Data are presented as mean ± SEM and analyzed using a t test, at each time point, or one-way ANOVA with Bonferroni post hoc test within cell types (e)
Fig. 3
Fig. 3
Tetraploidy is characteristic of an endogenous c-kit+ CIC subpopulation. FVB mouse myocardial, intestine, and bone marrow tissue sections assessed by in situ quantitation of ploidy level at 90 days post birth (scalebar = 20 μm) (a). Compiled quantification of in situ DNA content measured by DAPI fluorescent intensity of the nucleus within 3D reconstruction of tissue demonstrates that cardiac ckit+ CICs have higher ploidy levels compared with ckit+ from intestine or bone marrow (b). Percent of ckit+ cells nuclei with diploid tetraploid and higher ploidy content from myocardial, intestine, and bone marrow tissue (c). Ckit+ cells isolated and cultured from cardiac tissue demonstrate higher ploidy levels compared with cultured ckit+ cells from bone marrow (d), measured by DAPI fluorescent intensity of the nucleus within 3D reconstruction of tissue (scalebar = 150 μm) (e) and propidium iodine fluorescent intensity of the nucleus using flow cytometry (f). G-band karyotype analysis verifies diploid content of cultured ckit+ bone marrow stem cells (g) and bone marrow-derived mesenchymal stem cells (h). **P < 0.01; ***P < 0.001. Data are presented as mean±SEM and analyzed using a t test (d) or one-way ANOVA with Bonferroni post hoc test (b)
Fig. 4
Fig. 4
Mononuclear tetraploid content distinguishes rodent cardiac stem cells in vitro. G-band karyotype analysis performed upon cultured CSCs reveals tetraploid content of rodent mouse (a) and rat (b) in contrast to diploid content of swine (c) and human (d) samples. Immunocytochemistry of CSC verifies mononuclear content of karyotyped cells (scalebar = 500 μm) (eh) and zoomed-in images (scalebar = 100 μm) (e′–h′). Multiple samples from different CSC lines verify consistent tetraploid content in adult mouse (i) and rat (j) CSCs, while swine (k) and human (l) CSCs are consistently diploid. Cell counts included in flow-cytometry analysis provided in parenthesis
Fig. 5
Fig. 5
Polyploid states are present in freshly isolated murine c-kit+ CICs. Hematopoietic lineage negative, c-kit positive CICs were freshly isolated and sorted for viability and ploidy content from FVB adult male mice. Using the cultured FVB CSC as a tetraploid control (a), fresh isolates of Lin– ckit+ CICs exhibit a mixture of diploid and tetraploid cells (b) shown by an overlay of tetraploid control versus fresh isolate sample (c). Lin–ckit+ CICs possess a similar percentage and cell count distribution of diploid and tetraploid cells with a small fraction of cells with ploidy greater than tetraploid, statistically analyzed using one-way ANOVA (d). Summary of polyploid state from FVB mouse lin–ckit+ cells of the heart, with compiled in situ and freshly isolated cells, revealing a mixture of mononuclear diploid and tetraploid levels, while cultured CSCs are tetraploid; all groups demonstrated a small fraction of tetraploid cells. **P < 0.01; ***P < 0.001. Data are presented as mean ± SEM and analyzed using one-way (d) or two-way (e) ANOVA with Bonferroni post hoc test
Fig. 6
Fig. 6
Distinct population characteristics of diploid versus tetraploid fresh murine Lin–c-kit+ isolates revealed by single-cell RNA sequencing (scRNA-Seq). Freshly isolated, viable diploid and tetraploid Lin–ckit+ CICs from adult FVB mouse were analyzed using scRNA-Seq. The diploid population (salmon) predominately cluster together, while tetraploid cCICs (teal) cluster in a different cell group (a; cells analyzed per group identified next to ploidy state). Identification of the cell populations demonstrates that cCICs are a heterogeneous population of fibroblast, endothelial, and lymphocyte cells (b). Percent of cCICs based on cell type (c). Percent of each cell type based on ploidy content (d). Heatmap of upregulated differentially expressed genes (DEGs) specific to endothelial and fibroblast markers confirm transcriptional differences in murine-derived diploid (2N_F) and tetraploid populations (4N_F) (e). These DEGs are also displayed in frequency and expression level between the diploid and tetraploid cCICs (f). The top ten gene ontology (GO) terms upregulated in the 2N population display extracellular matrix cellular components, while the 4N population cellular component is junction oriented (g). The top ten GO terms by biological process upregulated in the 2N population represent both extracellular matrix and angiogenesis processes, while the 4N population is primarily angiogenesis oriented (h)
Fig. 7
Fig. 7
Reduction of DNA content in Lin– c-kit+ CICs following myocardial infarction. Quantitation of in situ nuclear DNA content in adult FVB mice following myocardial infarction measured by DAPI fluorescent intensity of tryptase–, ckit+ CIC nuclei. 3D reconstruction of cardiac tissue was performed at 4, 7, 14, and 21 days post injury in the infarction zone. Normal, age, gender, and strain-matched hearts were used as a control. Tryptase+, a marker of mast cells, was only found in injured hearts within the first week after injury and was not included in the analysis, as shown with tryptase–, ckit+, and tryptase+ ckit+ CICs in the infarction zone of an adult, 7-day post-MI FVB heart (a, scalebar = 150 μm) with a boxed region of higher magnification (b, scalebar = 25 μm). The white arrow identifies cCICs included in the analysis and the orange arrow identifies a mast cell, not included in the study. Compiled dot plot of in situ DNA content per nucleus of lin–ckit+ cells demonstrates higher frequency of diploid levels in the infarction region at all time points post MI (c), and is verified upon quantification of percent diploid, tetraploid, and greater than tetraploid content (d). **P < 0.01; ***P < 0.001. Data are presented as mean ± SEM and analyzed using one-way ANOVA with Bonferroni post hoc test (c)

References

    1. Otto SP, Whitton J. Polyploid incidence and evolution. Annu Rev. Genet. 2000;34:401–437. doi: 10.1146/annurev.genet.34.1.401. - DOI - PubMed
    1. Hegarty MJ, Hiscock SJ. Genomic clues to the evolutionary success of polyploid plants. Curr. Biol. 2008;18:R435–R444. doi: 10.1016/j.cub.2008.03.043. - DOI - PubMed
    1. Masterson J. Stomatal size in fossil plants: evidence for polyploidy in majority of angiosperms. Science. 1994;264:421–424. doi: 10.1126/science.264.5157.421. - DOI - PubMed
    1. Biesterfeld S, Gerres K, Fischer-Wein G, Bocking A. Polyploidy in non-neoplastic tissues. J. Clin. Pathol. 1994;47:38–42. doi: 10.1136/jcp.47.1.38. - DOI - PMC - PubMed
    1. Anatskaya OV, Vinogradov AE. Genome multiplication as adaptation to tissue survival: evidence from gene expression in mammalian heart and liver. Genomics. 2007;89:70–80. doi: 10.1016/j.ygeno.2006.08.014. - DOI - PubMed

Publication types