

Lyme Disease Risks in Europe under Multiple Uncertain Drivers of Change
- PMID: 31232609
- PMCID: PMC6792373
- DOI: 10.1289/EHP4615
Lyme Disease Risks in Europe under Multiple Uncertain Drivers of Change
Abstract
Background: Debates over whether climate change could lead to the amplification of Lyme disease (LD) risk in the future have received much attention. Although recent large-scale disease mapping studies project an overall increase in Lyme disease risk as the climate warms, such conclusions are based on climate-driven models in which other drivers of change, such as land-use/cover and host population distribution, are less considered.
Objectives: The main objectives were to project the likely future ecological risk patterns of LD in Europe under different assumptions about future socioeconomic and climate conditions and to explore similarity and uncertainty in the projected risks.
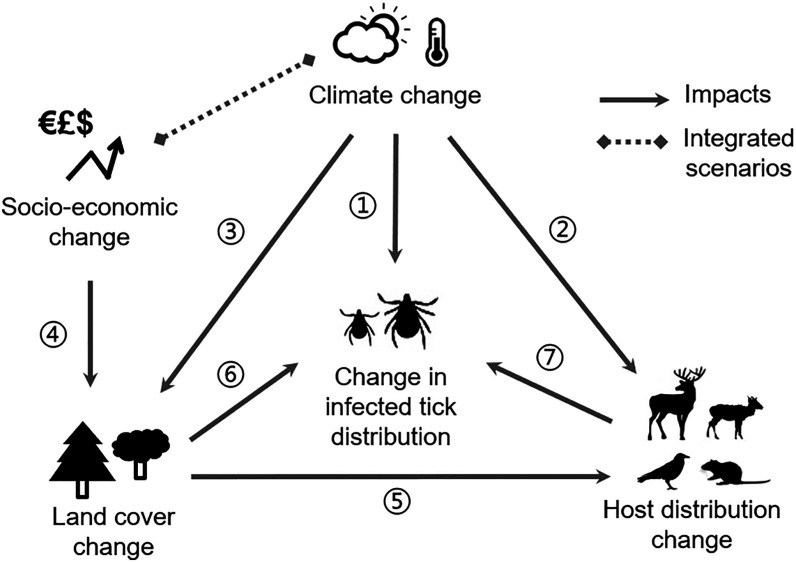
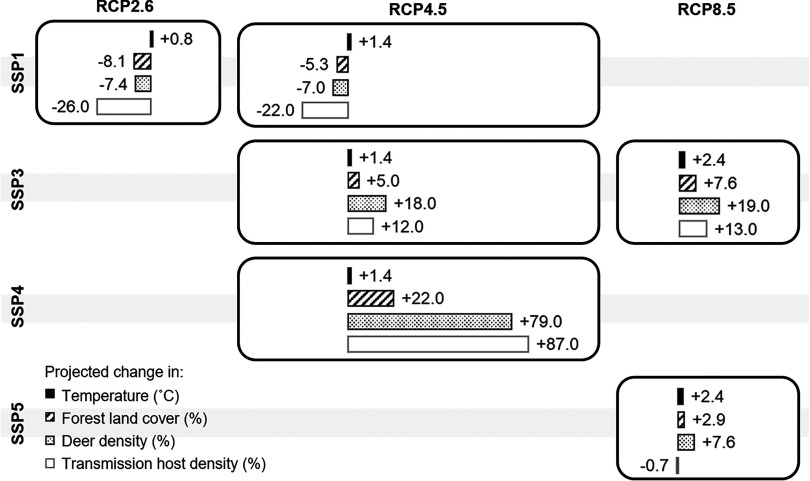
Methods: An integrative, spatially explicit modeling study of the ecological risk patterns of LD in Europe was conducted by applying recent advances in process-based modeling of tick-borne diseases, species distribution mapping, and scenarios of land-use/cover change. We drove the model with stakeholder-driven, integrated scenarios of plausible future socioeconomic and climate change [the Shared Socioeconomic Pathway (SSPs) combined with the Representative Concentration Pathways (RCPs)].
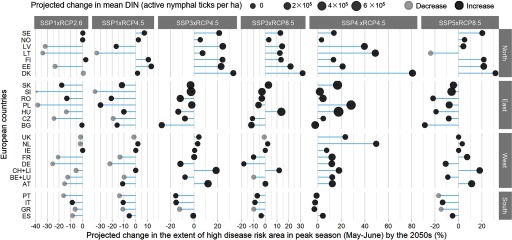
Results: The model projections suggest that future temperature increases may not always amplify LD risk: Low emissions scenarios (RCP2.6) combined with a sustainability socioeconomic scenario (SSP1) resulted in reduced LD risk. The greatest increase in risk was projected under intermediate (RCP4.5) rather than high-end (RCP8.5) climate change scenarios. Climate and land-use change were projected to have different roles in shaping the future regional dynamics of risk, with climate warming being likely to cause risk expansion in northern Europe and conversion of forest to agriculture being likely to limit risk in southern Europe.
Conclusions: Projected regional differences in LD risk resulted from mixed effects of temperature, land use, and host distributions, suggesting region-specific and cross-sectoral foci for LD risk management policy. The integrated model provides an improved explanatory tool for the system mechanisms of LD pathogen transmission and how pathogen transmission could respond to combined socioeconomic and climate changes. https://doi.org/10.1289/EHP4615.
Figures


Similar articles
-
Projecting the potential distribution of ticks in China under climate and land use change.Int J Parasitol. 2021 Aug;51(9):749-759. doi: 10.1016/j.ijpara.2021.01.004. Epub 2021 Mar 31. Int J Parasitol. 2021. PMID: 33798559
-
Estimating the Incidence and Economic Cost of Lyme Disease Cases in Canada in the 21st Century with Projected Climate Change.Environ Health Perspect. 2024 Feb;132(2):27005. doi: 10.1289/EHP13759. Epub 2024 Feb 13. Environ Health Perspect. 2024. PMID: 38349724 Free PMC article.
-
Climate change influences on the potential geographic distribution of the disease vector tick Ixodes ricinus.PLoS One. 2017 Dec 5;12(12):e0189092. doi: 10.1371/journal.pone.0189092. eCollection 2017. PLoS One. 2017. PMID: 29206879 Free PMC article.
-
Ecology of Borrelia burgdorferi sensu lato in Europe: transmission dynamics in multi-host systems, influence of molecular processes and effects of climate change.FEMS Microbiol Rev. 2012 Jul;36(4):837-61. doi: 10.1111/j.1574-6976.2011.00312.x. Epub 2011 Dec 28. FEMS Microbiol Rev. 2012. PMID: 22091928 Review.
-
Climate change impacts on human health over Europe through its effect on air quality.Environ Health. 2017 Dec 5;16(Suppl 1):118. doi: 10.1186/s12940-017-0325-2. Environ Health. 2017. PMID: 29219103 Free PMC article. Review.
Cited by
-
Models for Studying the Distribution of Ticks and Tick-Borne Diseases in Animals: A Systematic Review and a Meta-Analysis with a Focus on Africa.Pathogens. 2021 Jul 14;10(7):893. doi: 10.3390/pathogens10070893. Pathogens. 2021. PMID: 34358043 Free PMC article. Review.
-
The Role of Environmental Factors in Lyme Disease Transmission in the European Union: A Systematic Review.Trop Med Infect Dis. 2024 May 15;9(5):113. doi: 10.3390/tropicalmed9050113. Trop Med Infect Dis. 2024. PMID: 38787046 Free PMC article. Review.
-
Climate Change and Cascading Risks from Infectious Disease.Infect Dis Ther. 2022 Aug;11(4):1371-1390. doi: 10.1007/s40121-022-00647-3. Epub 2022 May 19. Infect Dis Ther. 2022. PMID: 35585385 Free PMC article. Review.
-
Possible Effects of Climate Change on Ixodid Ticks and the Pathogens They Transmit: Predictions and Observations.J Med Entomol. 2021 Jul 16;58(4):1536-1545. doi: 10.1093/jme/tjaa220. J Med Entomol. 2021. PMID: 33112403 Free PMC article.
-
Intersecting vulnerabilities: climatic and demographic contributions to future population exposure to Aedes-borne viruses in the United States.Environ Res Lett. 2020 Aug;15(8):084046. doi: 10.1088/1748-9326/ab9141. Epub 2020 Aug 12. Environ Res Lett. 2020. PMID: 38585625 Free PMC article.
References
-
- Amirpour Haredasht S, Barrios JM, Maes P, Verstraeten WW, Clement J, Ducoffre G, et al. . 2011. A dynamic data-based model describing nephropathia epidemica in Belgium. Biosyst Eng 109(1):77–89, 10.1016/j.biosystemseng.2011.02.004. - DOI
-
- Apollonio M, Andersen R, Putman R. 2010. European Ungulates and Their Management in the 21st Century. Cambridge, UK:Cambridge University Press.
-
- Audsley E, Pearn KR, Simota C, Cojocaru G, Koutsidou E, Rounsevell MDA, et al. . 2006. What can scenario modelling tell us about future European scale agricultural land use, and what not? Environ Sci Policy 9(2):148–162, 10.1016/j.envsci.2005.11.008. - DOI
Publication types
MeSH terms
LinkOut - more resources
Full Text Sources
Medical
Research Materials
