. 2019 Jun 24:8:e45248.
doi: 10.7554/eLife.45248.

Glycosylphosphatidylinositol biosynthesis and remodeling are required for neural tube closure, heart development, and cranial neural crest cell survival

Affiliations

Glycosylphosphatidylinositol biosynthesis and remodeling are required for neural tube closure, heart development, and cranial neural crest cell survival

Marshall Lukacs et al. Elife. .

Abstract

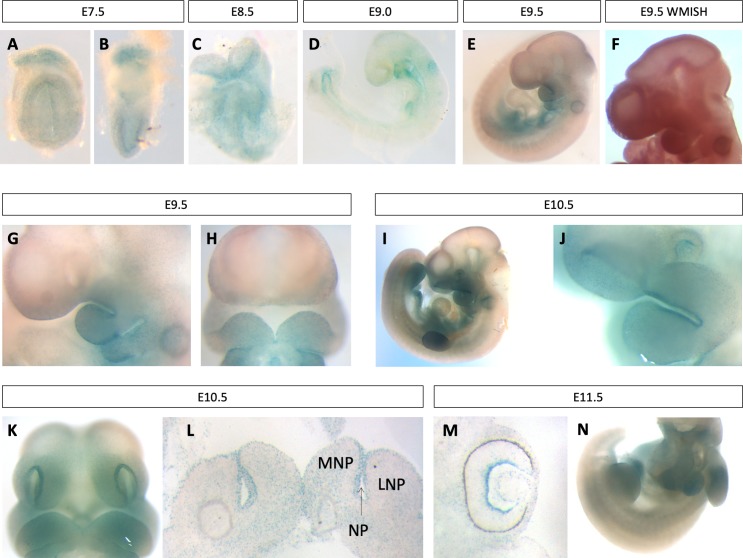
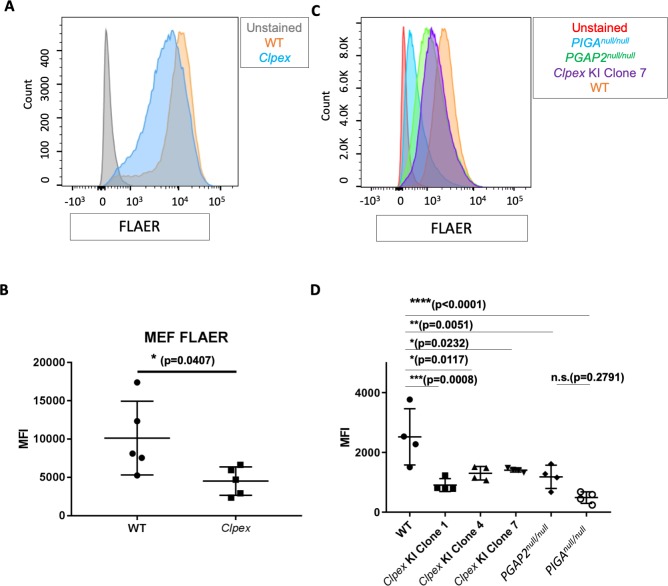
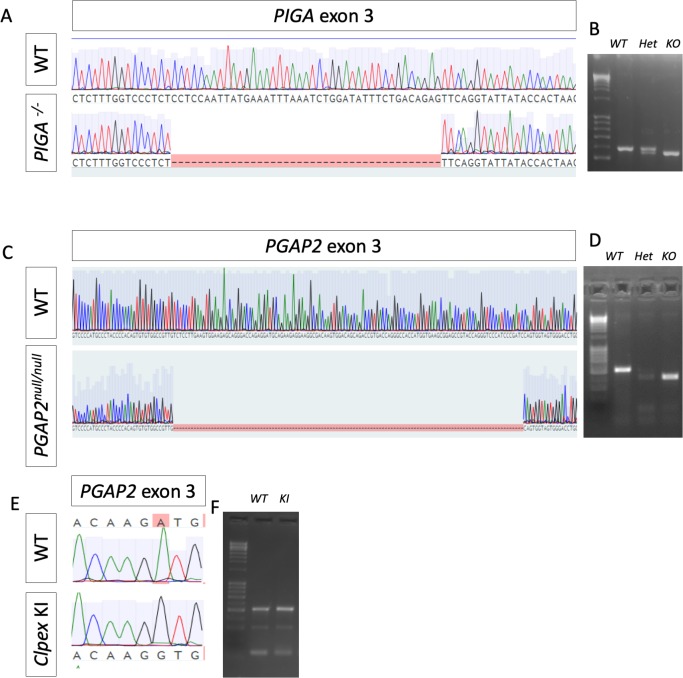
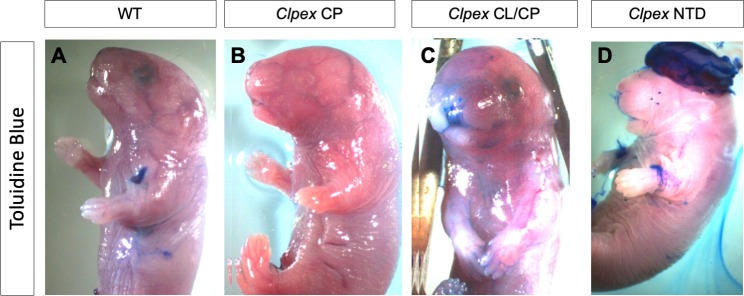
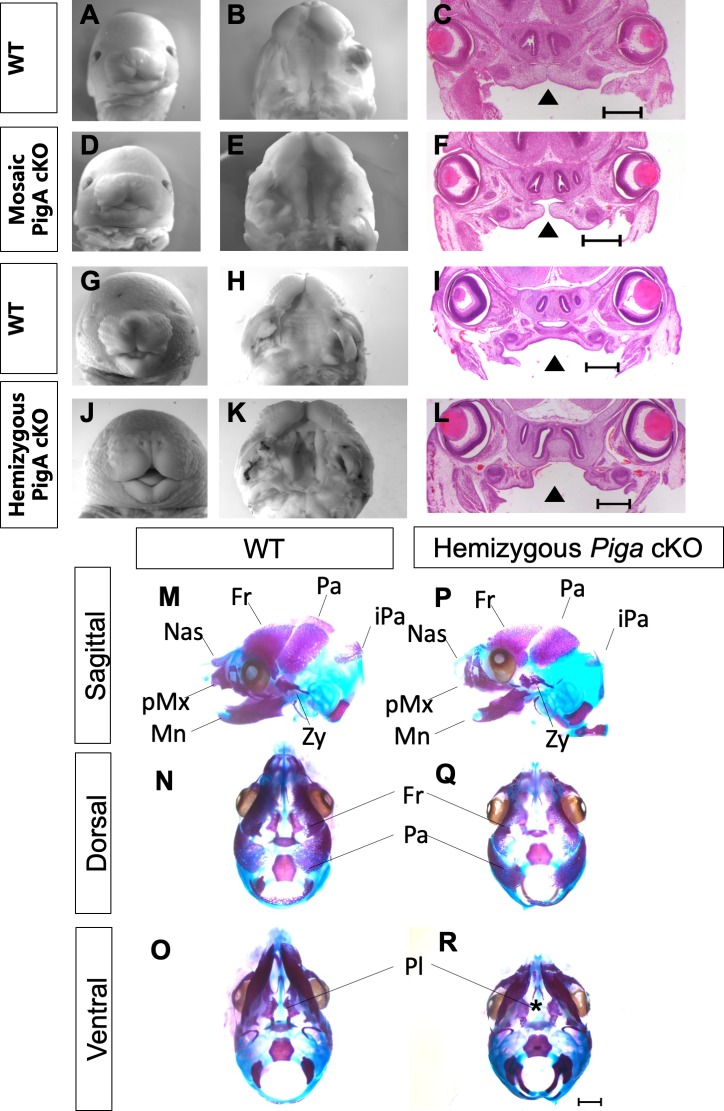
Glycosylphosphatidylinositol (GPI) anchors attach nearly 150 proteins to the cell membrane. Patients with pathogenic variants in GPI biosynthesis genes develop diverse phenotypes including seizures, dysmorphic facial features and cleft palate through an unknown mechanism. We identified a novel mouse mutant (cleft lip/palate, edema and exencephaly; Clpex) with a hypo-morphic mutation in Post-Glycophosphatidylinositol Attachment to Proteins-2 (Pgap2), a component of the GPI biosynthesis pathway. The Clpex mutation decreases surface GPI expression. Surprisingly, Pgap2 showed tissue-specific expression with enrichment in the brain and face. We found the Clpex phenotype is due to apoptosis of neural crest cells (NCCs) and the cranial neuroepithelium. We showed folinic acid supplementation in utero can partially rescue the cleft lip phenotype. Finally, we generated a novel mouse model of NCC-specific total GPI deficiency. These mutants developed median cleft lip and palate demonstrating a previously undocumented cell autonomous role for GPI biosynthesis in NCC development.

Keywords: Folic/folinic acid; congenital disorders of glycosylation; craniofacial; development; developmental biology; glycosylphosphatidylinositol; mouse; neural crest.


Conflict of interest statement

ML, TR, PC, RS No competing interests declared

Figures

Figure 1.
Figure 1.. The Clpex mutant phenotype is caused by a hypo-morphic mutation in Pgap2.
Whole mount E18.5 (A,E) and E15.5 (G) WT embryos. Whole mount E18.5 (B, F) and E15.5 (H) Clpex mutant embryos. H&E staining of WT E15.5 (C) and Clpex (D) coronal sections. Skeletal preparation of WT skull ventral view (I), dorsal view (K). Skeletal preparation of Clpex mutant skull ventral view (J) and dorsal view (L). Asterick indicates absent palatine bone in mutant (L). Skeletal preparation of WT limb (M), and Clpex mutant limb (N). Quantification of WT and mutant radial (O) and humeral (P) length normalized to the crown to rump ratio. Mapping data for Clpex mutation (Q). Sanger sequencing of Pgap2 exon three in WT and Clpex mutant with exon three highlighted starting at the initiating methionine (R). Scale bar indicates 500 μm in C,D and 1 mm in I-N. (**p<0.01).
Figure 2.
Figure 2.. Pgap2null allele fails to complement Pgap2Clpex allele.
Whole mount image of E13.5 WT (A,C,E,G) and Pgap2Clpex/null mutant (B,D,F,H). Penetrance of some key phenotypes is compared in I. Cardiac histology of E14.5 WT (J) and Pgap2Clpex/null mutant (K,), scale bar indicates 1 mm. Higher power images of the ventricular septum (L, M), valve (N, O), and myocardial wall (P, Q). Scale bar indicates 100 μM in L-Q.
Figure 2—figure supplement 1.
Figure 2—figure supplement 1.. Pgap2 alternative transcripts.
UCSC Genome Browser view of Pgap2 with multiple alternative transcripts with Pgap2-225, Pgap2-203, and Pgap2-204 labeled with the start codon mutated in Clpex allele boxed in red and the start codon utilized by Pgap2-203 boxed in blue (A). Protein sequence alignment of canonical transcript Pgap2-225 and variant Pgap2-203 (B). The alignment shows a 89.9% identity in which most of the unaligned amino acids are in the C-terminal tail due to alternative start site usage.
Figure 3.
Figure 3.. Pgap2 is expressed in neural and craniofacial tissues during development.
Whole mount Pgap2 Xgal staining in E7.5 (A–B), E8.5 (C), E9.0 (D) E9.5 (E, G, H), E10.5 (I–L), and E11.5 (M,N). Pgap2 RNA in situ hybridization at E9.5 (F). Transverse section through the lip at E10.5 (L) at the future site of lip closure. Expression is seen in the ganglion cell layer of the retina at E11.5 (M). LNP = lateral nasal process, MNP = medial nasal process, NP = nasal pit.
Figure 3—figure supplement 1.
Figure 3—figure supplement 1.. Pgap2 expression at later embryonic and early postnatal stages.
Xgal section staining of Pgap2-LacZ in the eye (A), salivary gland (B), epidermis (C), stomach (D), nasal conchae (E), myocardium (F), lung parenchyma (G), kidney (H), ear (I), cerebral cortex (J, K), genital tubercle (L) and brain/choroid plexus (M). Scale bar indicates 200 um.
Figure 4.
Figure 4.. Pgap2 is required for proper anchoring of GPI-APs.
(A) FLAER staining of WT (orange) and Clpex (blue) MEFs, (unstained control in gray) with quantification of Mean Fluorescence Intensity (MFI) (B). FLAER staining of WT (orange) Clpex KI Clone 7 (purple), PGAP2-/- (green), PIGA-/- (blue) HEK293T cells, and unstained control (red) (C) with quantification of MFI (D). *p<0.05, **p<0.01, ***p<0.001, ****p<0.0001.
Figure 4—figure supplement 1.
Figure 4—figure supplement 1.. Sequencing of CRISPR/Cas9 generated PIGAnull/null, PGAP2 null/null, and Clpex KI 293T clones.
WT human sequence and Sanger Sequencing of PIGA null/null, clone showing a 29 bp deletion in PIGA exon 3 (A). PCR of exon 3 of PIGA showing a heterozygous clone with a small deletion and the KO with the 29 bp deletion (B). Sanger Sequencing of WT 293T PGAP2 exon three and PGAP2-/- clone showing a 121 bp deletion (C). PCR of PGAP2 exon three showing WT 293T, heterozygous clone with two deletions and the PGAP2-/- clone with a single large deletion (D). Sanger Sequencing of PGAP2 exon three in WT 293T and Clpex Knock-in (KI) clone with the highlighted A > G mutation (E). PCR of PGAP2 exon three with WT 293T and Clpex KI clone DNA (F).
Figure 5.
Figure 5.. Trafficking of FOLR1 to the cell membrane requires GPI biosynthesis and remodeling.
Wheat germ agglutinin (WGA) staining in WT (A), PIGAnull/null (D), PGAP2null/null (G) HEK293T cells. FOLR1-myc staining in WT (B), PIGAnull/null (E), PGAP2null/null (H) HEK293T cells. Merge of WGA and FOLR1 for WT (C), PIGAnull/null (F), and PGAP2null/null (I). Pearson Coefficient for co-localization of WGA and FOLR1-myc (J). Western blot for αmyc-FOLR1 (green) and αTubulin (red) loading control from cell lysates of WT, PIGAnull/null, and PGAP2 null/null cells overexpressing N-myc tagged FOLR1 (K) and Rabbit IgG control for the same cell lysate (L). ****p<0.0001, Scale bar indicates 100 μM.
Figure 6.
Figure 6.. Clpex cNCCs and neuroepithelium undergo apoptosis at E9.5.
Wnt1-Cre, R26R NCC lineage trace in WT (A, C, E) and Clpex mutant (B,D,F) at E9.5 (A,B) and E11.5 (C–F). WT E9.5 embryo stained for DAPI (G), AP2 (H) CC3 (I) and merged image in (J). Clpex E9.5 embryo stained for DAPI (K), AP2 (L) CC3 (M), and merged image in (N). Higher power image of WT (O) and Clpex mutant (P) neuroepithelium stained with CC3 and DAPI. Quantification of CC3+ cells over AP2+ cells in the first branchial arch Region of Interest (Q). **p<0.01. Scale bar indicates 100 μm.
Figure 6—figure supplement 1.
Figure 6—figure supplement 1.. Clpex mutants do not display a defect in barrier formation.
E18.5 WT (A), Clpex cleft palate mutant (B), Clpex cleft lip/cleft palate mutant (C), and Clpex neural tube defect mutant (D) stained with Toludine Blue.
Figure 7.
Figure 7.. Folinic Acid treatment in utero partially rescues the cNCC apoptosis and cleft lip in Clpex mutants.
Schema of diet regimen to evaluate apoptosis and phenotypic rescue in Clpex mutants treated with control, 25ppm folic acid, or 25ppm folinic acid diet in utero (A). Phenotypes observed in Clpex mutants from litters treated from E0-E16.5 with control diet (blue), 25ppm folic acid (orange), or 25ppm folinic acid (gray) (B). Summary of the phenotypes of Clpex mutants from litters treated with the indicated diets (C). (*p<0.05).
Figure 7—figure supplement 1.
Figure 7—figure supplement 1.. Folinic acid treatment of Clpex embyos does not rescue neural crest cell apoptosis.
WT E9.5 embryo (A) and E9.5 Clpex mutant embryo (B) from litters of pregnant dams fed a control diet from E0.5-E9.5. WT E9.5 embryo (C) and E9.5 Clpex mutant embryo (D) from litters of pregnant dams fed a 25ppm folinic acid diet from E0.5-E9.5. Coronal sections of the first arch stained for AP2 (red), Cleaved Caspase 3 (green), and counterstained with DAPI. Quantification of CC3 +spots/AP2 +spots in the first arch Region of Interest (E). n.s. = not significant.
Figure 8.
Figure 8.. Piga is expressed in the first branchial arch, medial nasal process, limb bud and deletion of Piga in the Wnt1-Cre lineage results in NCC cells that lack GPI biosynthesis.
WMISH of WT E11.5 embryo stained with αsense Piga probe (A, C, E) or sense Piga probe (B, D, E). FLAER flow cytometry staining of WT (orange, blue) and Piga hemizygous cKO MPNMCs (green). FLAER MFI quantified (H). Fb = Forebrain, Mb = Midbrain, BA1 = Branchial Arch 1, MNP = Medial Nasal Process, Lb = Limb bud. **p<0.01.
Figure 8—figure supplement 1.
Figure 8—figure supplement 1.. GPI biosynthesis genes show increased expression in the first branchial arch, limb bud, and forebrain.
WT E11.5 RNA in situ hybridization with α-sense (Pigp) (A,B) and sense control probe (G,H); Pigu α-sense probe (C,D) and sense control probe (I,J) and Pigx α-sense probe (E,F) and sense control probes (K,L).
Figure 9.
Figure 9.. Conditional knockout of Piga abolishes GPI biosynthesis in NCCs and leads to median cleft lip/palate and craniofacial hypoplasia.
Whole mount images of E15.5 WT (A), mosaic Piga cKO (D), E16.5 WT (G) and hemizygous Piga cKO (J). Ventral view of the secondary palate of E15.5 WT (B), Mosaic cKO (E), E16.5 WT (H) and hemizygous cKO (K). H and E staining of E15.5 WT (C), mosaic cKO (F), E16.5 WT (I), and hemizygous cKO (L), arrowhead indicates cleft palate. Alazarin red and alcian blue staining of E16.5 WT skull (M–O) and hemizygous Piga cKO skull (P–R). Asterick indicates cleft palate. Fr = Frontal bone, Pa = Parietal bone, iPa = interparietal bone, Zy = Zygomatic bone, Mn = Mandible, pMx = Premaxilla, Nas = Nasal bone. Scale bar indicates 500 μM in C, F, I, L and 1 mm in M-R.
Author response image 1.
Author response image 1.. Commercial Pgap2 antibody does not detect overexpressed or endogenous PGAP2.
10μg lysate from overexpression of mouse Pgap2-myc tagged clone (Origene #MR203189) in WT (lane 2) or Pgap2 KO 293T (lane 3) or lysate from mock transfection of WT (lane 4) or Pgap2 KO 293T (lane 5) probed with 1:500 Rb αPGAP (Thermo #PA5-64091, Green). (A) 10μg lysate from overexpression of mouse Pgap2-myc tagged clone in WT (lane 2) or Pgap2 KO 293T (lane 3) or lysate from mock transfection of WT (lane 4) or Pgap2 KO 293T (lane 5) probed with 1:1000 Rb αMyc (Abcam #ab9106, Green) or Ms αTub (Red) (B).

Similar articles

Cited by

References

    1. Abe K, Yamamura K, Suzuki M. Molecular and embryological characterization of a new transgene-induced null allele of mouse brachyury locus. Mammalian Genome. 2000;11:238–240. doi: 10.1007/s003350010044. - DOI - PubMed
    1. Ahrens MJ, Li Y, Jiang H, Dudley AT. Convergent extension movements in growth plate chondrocytes require gpi-anchored cell surface proteins. Development. 2009;136:3463–3474. doi: 10.1242/dev.040592. - DOI - PMC - PubMed
    1. Ando H, Kobayashi M, Tsubokawa T, Uyemura K, Furuta T, Okamoto H. Lhx2 mediates the activity of Six3 in zebrafish forebrain growth. Developmental Biology. 2005;287:456–468. doi: 10.1016/j.ydbio.2005.09.023. - DOI - PubMed
    1. Bassuk AG, Muthuswamy LB, Boland R, Smith TL, Hulstrand AM, Northrup H, Hakeman M, Dierdorff JM, Yung CK, Long A, Brouillette RB, Au KS, Gurnett C, Houston DW, Cornell RA, Manak JR. Copy number variation analysis implicates the cell polarity gene glypican 5 as a human spina bifida candidate gene. Human Molecular Genetics. 2013;22:1097–1111. doi: 10.1093/hmg/dds515. - DOI - PMC - PubMed
    1. Behringer R. Manipulating the Mouse Embryo: A Laboratory Manual. Fourth edition. New York: Cold Spring Harbor Laboratory Press; 2014.

Publication types

Associated data