. 2019 Jun 24:8:e46314.
doi: 10.7554/eLife.46314.

Improved CUT&RUN chromatin profiling tools

Affiliations

Improved CUT&RUN chromatin profiling tools

Michael P Meers et al. Elife. .

Abstract

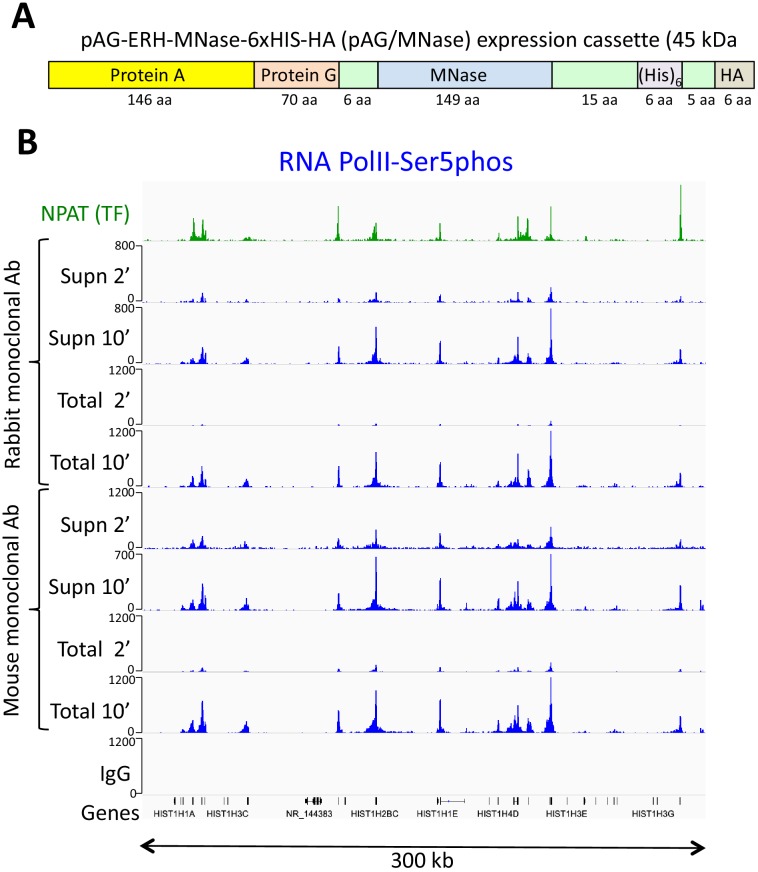
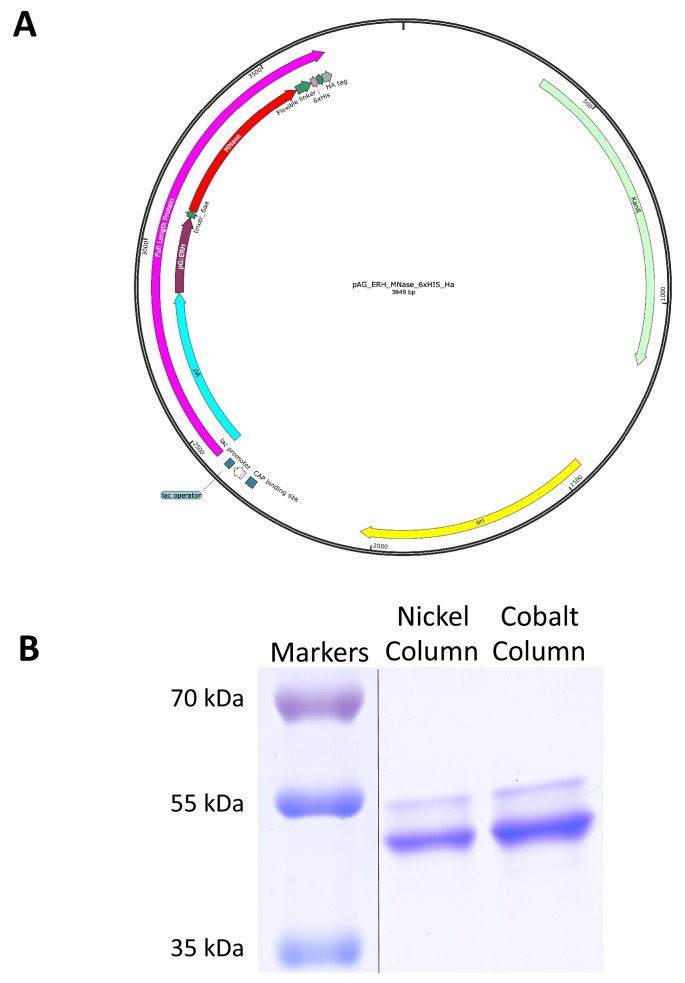
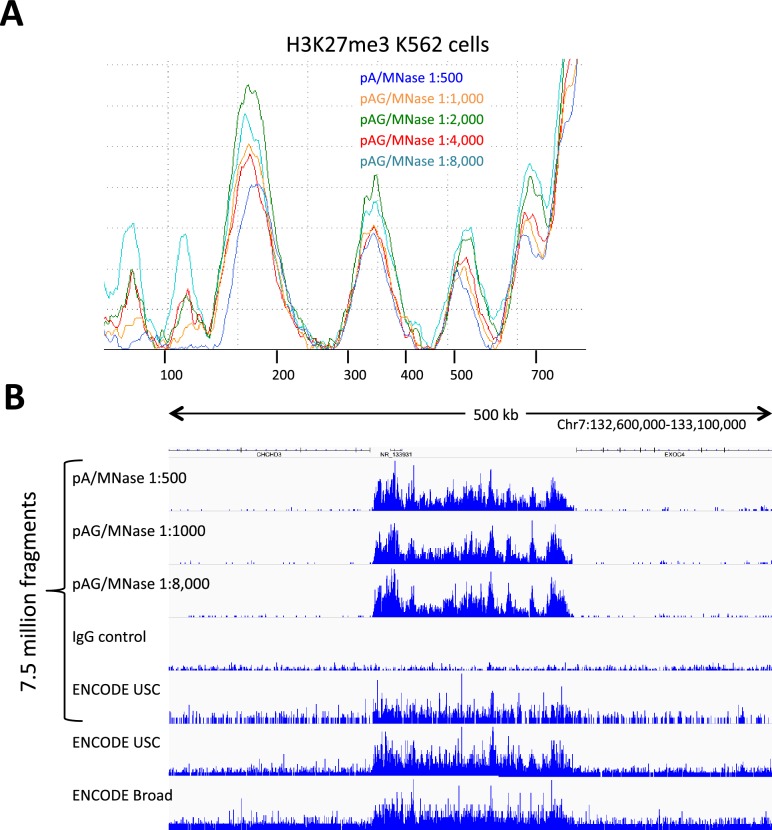
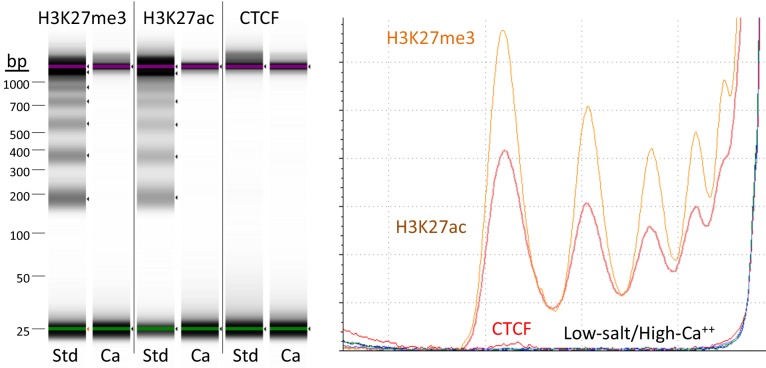
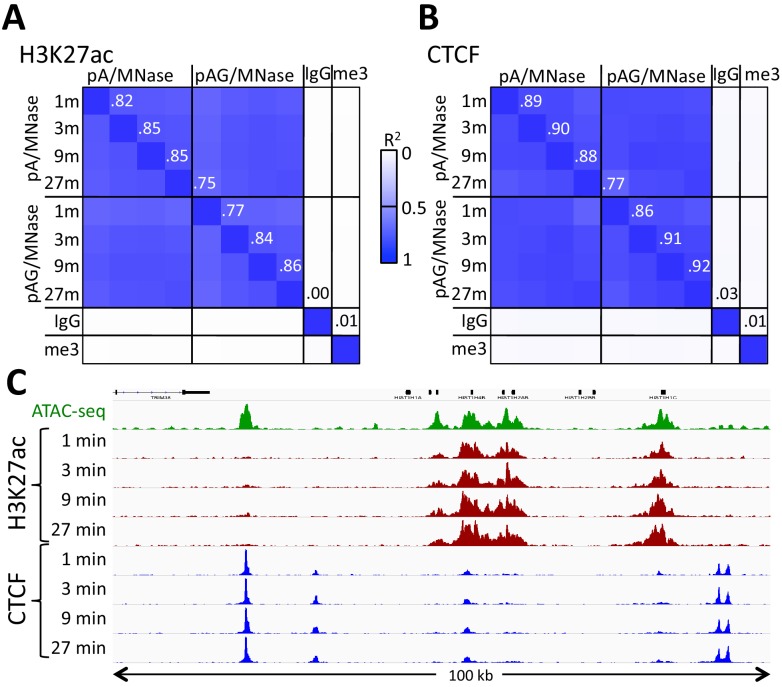
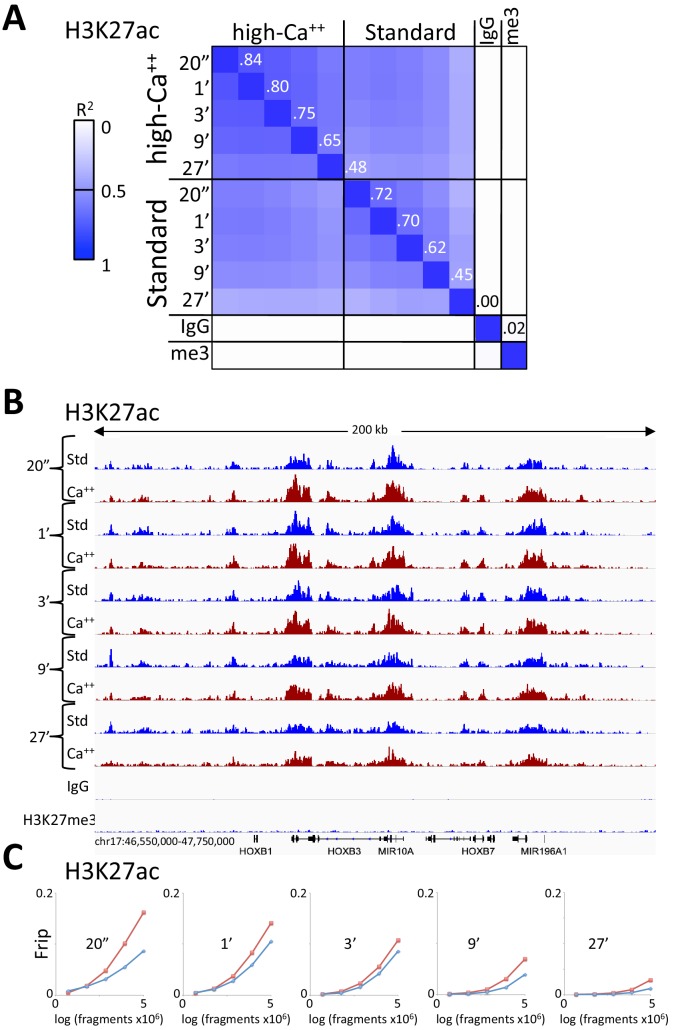
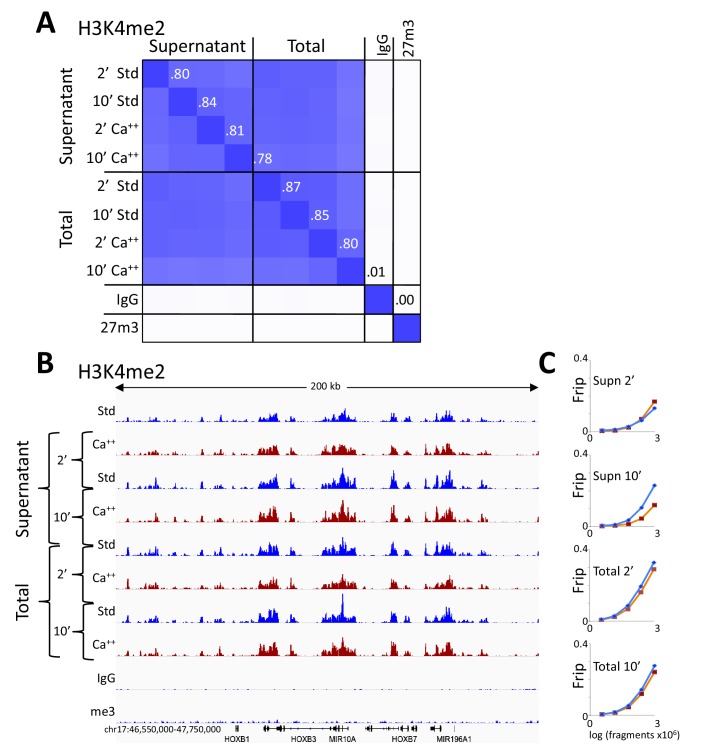
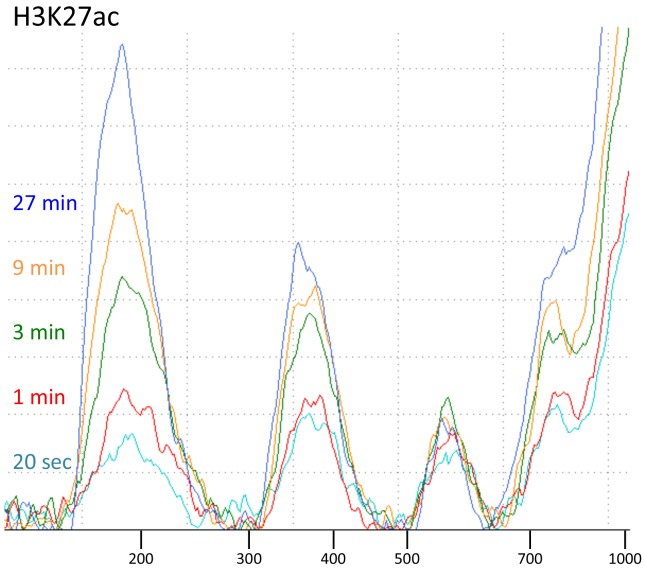
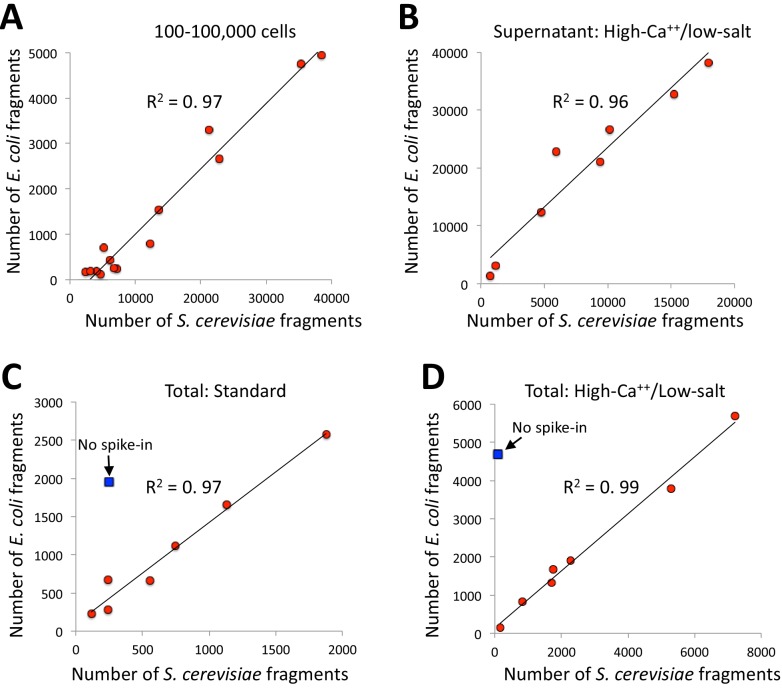
Previously, we described a novel alternative to chromatin immunoprecipitation, CUT&RUN, in which unfixed permeabilized cells are incubated with antibody, followed by binding of a protein A-Micrococcal Nuclease (pA/MNase) fusion protein (Skene and Henikoff, 2017). Here we introduce three enhancements to CUT&RUN: A hybrid protein A-Protein G-MNase construct that expands antibody compatibility and simplifies purification, a modified digestion protocol that inhibits premature release of the nuclease-bound complex, and a calibration strategy based on carry-over of E. coli DNA introduced with the fusion protein. These new features, coupled with the previously described low-cost, high efficiency, high reproducibility and high-throughput capability of CUT&RUN make it the method of choice for routine epigenomic profiling.

Keywords: chromatin; chromosomes; epigenomics; gene expression; genetics; genomics; human; spike-in calibration.


Conflict of interest statement

MM, TB, JH, SH No competing interests declared

Figures

Figure 1.
Figure 1.. An improved fusion protein for CUT&RUN.
(A) Schematic diagram (not to scale) showing improvements to the pA-MNase fusion protein, which include addition of the C2 Protein G IgG binding domain, a 6-histidine tag for purification and a hemagglutinin tag (HA) for immunoprecipitation. (B) The Protein A/G hybrid fusion results in high-efficiency CUT&RUN for both rabbit and mouse primary antibodies. CUT&RUN for both rabbit and mouse RNAPII-Ser5phosphate using pAG/MNase were extracted from either the supernatant or the total cellular extract. Tracks are shown for the histone gene cluster at Chr6:26,000,000–26,300,000, where NPAT is a transcription factor that co-activates histone genes. Tracks for 2’ and 10’ time points are displayed at the same scale for each antibody and for both supernatant (supn) or total DNA extraction protocols.
Figure 1—figure supplement 1.
Figure 1—figure supplement 1.. An improved fusion protein for CUT&RUN.
(A) Plasmid map of pAG-ERH-MNase-6xHIS-HA. (B) Coomassie-stained gel of fusion protein eluted from nickel-agarose.
Figure 1—figure supplement 2.
Figure 1—figure supplement 2.. pAG/MNase titration.
(A) K562 cells were incubated with an antibody to H3K27me3 (CST #9733 Rabbit monoclonal), washed twice with 1 ml Dig-wash. The sample was split into aliquots for incubation with pA/MNase at the recommended concentration and a serial dilution of pAG/MNase, followed by 3 1 ml washes. After 30 min using the standard protocol, lImit digestions are seen at all dilutions for this abundant epitope, indicating that the amount of fusion protein used in this experiment was in excess. (B) Representative tracks from these samples on the same normalized count scale show consistently low CUT&RUN backgrounds with excess pAG/MNase, which indicates that washes are sufficient to minimize non-specific background cleavages. ENCODE ChIP-seq tracks are shown for comparison, where USC used CST #9733, and Broad Institute used Millipore 07–449.
Figure 2.
Figure 2.. Targeted fragments are not released during digestion using high-calcium/low-salt conditions.
CUT&RUN was performed using either the high-Ca++/low-salt (Ca++) or the standard (Std) method with antibodies to three different epitopes. DNA was extracted from supernatants, where no elution was carried out for the Ca++ samples. Although high yields of nucleosomal ladder DNA eluted from the supernatants using the standard method, no DNA was detectable in the supernatant using the high-Ca++/low salt method when the elution step was omitted. Left, Tapestation images from indicated lanes; Right, Densitometry of the same lanes.
Figure 3.
Figure 3.. Similar performance using pA/MNase and pAG/MNase.
(A) CUT&RUN was performed with an antibody to H3K27ac (Millipore MABE647) and to CTCF (Millipore 07–729) with digestion over a 1 to 27 min range as indicated using pAG/MNase with the high-Ca++/low-salt protocol. Correlation matrix comparing peak overlaps for time points and fusion constructs. The datasets were pooled and MACS2 was used with default parameters to call peaks, excluding those in repeat-masked intervals and those where peaks overlapped with the top 1% of IgG occupancies, for a total of 52,425 peaks. Peak positions were scored for each dataset and correlations (R2 values shown along the diagonal and displayed with Java TreeView v.1.16r2, contrast = 1.25) were calculated between peak vectors. IgG and H3K27me3 (me3) negative controls were similarly scored. (B) Same as A, except the antibody was to CTCF. A set of 9403 sites with a CTCF motif within a hypersensitive site was used (Skene and Henikoff, 2017). High correlations between all time points demonstrate the uniformity of digestion over a 27-fold range. (C) Representative tracks from datasets used for panels A and B showing a 100 kb region that includes a histone locus cluster (chr6:25,972,600–26,072,600).
Figure 4.
Figure 4.. Consistent peak definition with high-Ca++/low salt digestion.
(A) H3K27ac CUT&RUN time-course experiments were performed with an Abcam 4729 rabbit polyclonal antibody, following either the standard protocol or the low-salt/high-calcium (High-Ca++) protocol. Samples of 5 million fragments from the 10 H3K27ac datasets were pooled and MACS2 called 36,529 peaks. Peak positions were scored for each dataset and correlations (R2 values shown along the diagonal) were calculated between peak vectors. IgG and H3K27me3 (me3) negative controls were similarly scored. Higher correlations between the High-Ca++ than the Standard time points indicates improved uniformity of digestion over the ~100 fold range of digestion times. (B) Tracks from a representative 200 kb region around the HoxB locus. (C) Fraction of reads in peaks (Frip) plots for each time point after down-sampling (5 million, 2.5 million, 1.25 million, 625,000 and 312,500), showing consistently higher Frip values for Ca++ (red) than Std (blue).
Figure 4—figure supplement 1.
Figure 4—figure supplement 1.. CUT&RUN consistency with high-Ca++/low salt digestion and total DNA extraction.
(A) H3K4me2 CUT&RUN time points with digestions using either the standard protocol or the high-calcium/low-salt protocol with either supernatant or total DNA extraction. To construct the correlation matrix, all 8 H3K4me2 datasets were pooled and MACS2 was used to call peaks, which yielded 64,156 peaks. Peak positions were scored for each dataset and correlations (R2 displayed with Java TreeView v.1.16r2, contrast = 1.25) were calculated between peak vectors. IgG and H3K27me3 (me3) negative controls were similarly scored. (B) Same as Figure 4B. (C) Same as Figure 4C.
Figure 4—figure supplement 2.
Figure 4—figure supplement 2.. Tapestation analyses of an H3K27ac digestion time-course series.
CUT&RUN with the low-salt/high-calcium protocol results in fragment release within 20 s at 0°C.
Figure 5.
Figure 5.. E. coli carry-over DNA of pA/MNase and pAG/MNase can substitute for spike-in calibration.
(A) Fragments from a CUT&RUN K562 cell experiment (GSE104550 20170426) using antibodies against H3K27me3 (100–8,000 cells) and CTCF (1,000–100,000 cells) were mapped to the repeat-masked genome of S. cerevisae and the full genome of E. coli. Standard digestion was followed by supernatant release and extraction. (B) Same as A using antibodies against multiple epitopes of varying abundances, with high-calcium/low-salt digestion followed by supernatant release and extraction. (C) Same as B except using standard digestion conditions and total DNA extraction. The S. cerevisiae spike-in DNA was left out for one sample (blue square). From top to bottom, antibodies are: NPAT Thermo PA5-66839, Myc: CST Rabbit Mab #13987, CTD: PolII CTD Abcam 8WG16, RNAPII-Ser5: Abcam 5408 (mouse), RNAPII-Ser2: CST E1Z3G, CTCF Millipore 07–729, RNAPII-Ser5: CST D9N5I (rabbit), H3K4me2: Upstate 07–030. (D) Same as C except using high-calcium/low-salt digestion and total DNA extraction. From top to bottom, antibodies are: CTCF Millipore 07–729, NPAT Thermo PA5-66839, Myc: CST Rabbit Mab #13987, CTD: PolII CTD Abcam 8WG16, RNAPII-Ser5: Abcam 5408 (mouse), RNAPII-Ser5: CST D9N5I (rabbit), RNAPII-Ser2: CST E1Z3G, H3K4me2: Upstate 07–030.

References

    1. Ahmad K, Spens A. Separate polycomb response elements control chromatin state and activation of the vestigial gene. bioRxiv. 2018 doi: 10.1101/488478. - DOI - PMC - PubMed
    1. Bornhorst JA, Falke JJ. Purification of proteins using polyhistidine affinity tags. Methods in Enzymology. 2000;326:245–254. doi: 10.1016/j.pep.2011.08.022. - DOI - PMC - PubMed
    1. Brahma S, Henikoff S. RSC-Associated subnucleosomes define MNase-Sensitive promoters in yeast. Molecular Cell. 2019;73:238–249. doi: 10.1016/j.molcel.2018.10.046. - DOI - PMC - PubMed
    1. Brind'Amour J, Liu S, Hudson M, Chen C, Karimi MM, Lorincz MC. An ultra-low-input native ChIP-seq protocol for genome-wide profiling of rare cell populations. Nature Communications. 2015;6:6033. doi: 10.1038/ncomms7033. - DOI - PubMed
    1. Chen K, Hu Z, Xia Z, Zhao D, Li W, Tyler JK. The overlooked fact: fundamental need for Spike-In control for virtually all Genome-Wide analyses. Molecular and Cellular Biology. 2015;36:662–667. doi: 10.1128/MCB.00970-14. - DOI - PMC - PubMed

Publication types

MeSH terms

Associated data