. 2020 Apr;53(4):476-484.
doi: 10.1097/SHK.0000000000001394.

Catecholamines Induce Endoplasmic Reticulum Stress Via Both Alpha and Beta Receptors

Affiliations

Catecholamines Induce Endoplasmic Reticulum Stress Via Both Alpha and Beta Receptors

Abdikarim Abdullahi et al. Shock. 2020 Apr.

Abstract

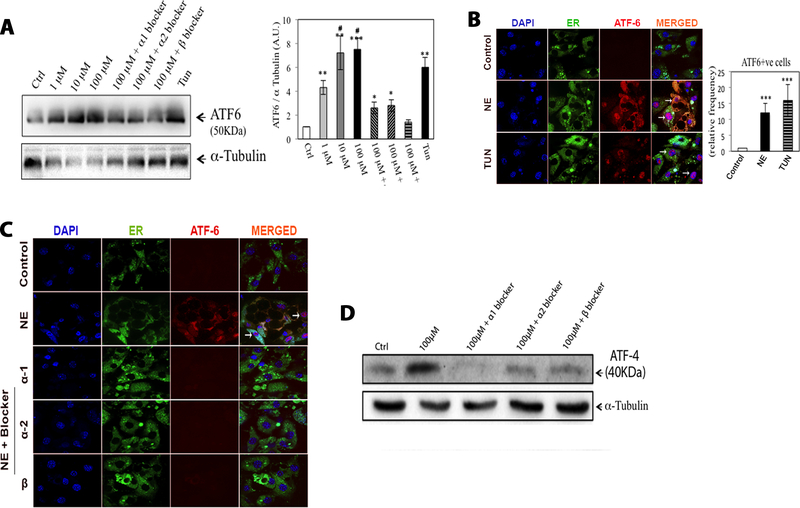
Severely burned patients suffer from a hypermetabolic syndrome that can last for years after the injury has resolved. The underlying cause of these metabolic alterations most likely involves the persistent elevated catecholamine levels that follow the surge induced by thermal injury. At the cellular level, endoplasmic reticulum (ER) stress in metabolic tissues is a hallmark observed in patients following burn injury and is associated with several detrimental effects. Therefore, ER stress could be the underlying cellular mechanism of persistent hypermetabolism in burned patients. Here, we show that catecholamines induce ER stress and that adreno-receptor blockers reduce stress responses in the HepG2 hepatocyte cell line. Our results also indicate that norepinephrine (NE) significantly induces ER stress in HepG2 cells and 3T3L1 mouse adipocytes. Furthermore, we demonstrate that the alpha-1 blocker, prazosin, and beta blocker, propranolol, block ER stress induced by NE. We also show that the effects of catecholamines in inducing ER stress are cell type-specific, as NE treatment failed to evoke ER stress in human fibroblasts. Thus, these findings reveal the mechanisms used by catecholamines to alter metabolism and suggest inhibition of the receptors utilized by these agents should be further explored as a potential target for the treatment of ER stress-mediated disease.


Figures

Figure 1:
Figure 1:. Catecholamines induce ER stress in HepG2 cells.
A) Representative Western blot of BiP in HepG2 cells exposed to different levels of norepinephrine for 24 hours. B) Representative Western blot of BiP in HepG2 cells exposed to different levels of epinephrine for 24 hours. C) Quantification of BiP protein levels in cells exposed to norepinephrine. D) Quantification of BiP protein levels in cells exposed to epinephrine. Each bar shows the relative ratio of BiP level normalized to α- tubulin. The ER stress inducer Thapsigargin (Tg, 1.5 μM) is shown as positive control. E) Immunostaining of cleaved-ATF6 (red), ER (green), and nuclei (blue) upon stimulation with norepinephrine (100 μM) and Thapsigargin (1.5 μM) is shown alongside the quantification of ATF6 + cells. Experiments were repeated 3 separate times with a total sample size (n=8–9) per group included in the analysis. *p<0.05, ** p<0.01, *** p<0.001 vs CTL.
Figure 2:
Figure 2:. ER stress is primarily induced via alpha-adrenergic receptors in HepG2 cells.
A) Representative immunofluorescence staining and quantification of BiP in HepG2 cells treated with 100 μM norepinephrine and the alpha-1, alpha-2, and beta-blocker (100 μM) (prazosin, yohimbine and propranolol, respectively) for 24 hours. B) Western blot and quantification showing the expression of BiP in response to the treatments indicated. NE, Norepinephrine. Arrows indicate positive cells. Experiments were repeated 3 separate times with a total sample size (n=8–9) per group included in the analysis. *p<0.05 vs NE or CTL respectively.
Figure 3:
Figure 3:. Norepinephrine evokes specific branches of the ER stress pathway.
A) Representative immunostaining of cleaved ATF6 in HepG2 cells treated with 100 μM norepinephrine and the alpha-1, alpha-2, and beta-blocker (100 μM) (prazosin, yohimbine and propranolol, respectively) for 24 hours. B) Quantification of cleaved-ATF6 positive (+) cells obtained from the immunostaining performed in (A). C) qPCR expression profile of XBP-1s in HepG2s exposed to norepinephrine (100 μM) alone or in presence of the alpha- and beta-blockers (100 μM) for 24 hours. NE, Norepinephrine. Arrows indicate positive cells. Experiments were repeated 3 separate times with a total sample size (n=8–9) per group included in the analysis. *p<0.05 vs NE or CTL respectively.
Figure 4:
Figure 4:. Norepinephrine does not induce CHOP and apoptosis.
A) Immunostaining of CHOP (Green) in HepG2 cells treated for 24 hours with norepinephrine (NE, 100 μM) or Thapsigargin (1.5 μM). Arrows indicate CHOP-positive cells. B) TUNEL assay was performed on HepG2 cells treated in the same conditions described in A). Arrows indicate TUNEL-positive cells. C) Averaged relative levels of cGMP in HepG2 treated with norepinephrine (100 μM) alone or in presence of the alpha- and beta-blockers (100 μM) for 24 hours. Experiments were repeated 3 separate times with a total sample size (n=9) per group included in the analysis.** p<0.01, *** p<0.001 vs CTL. ND, Not detected.
Figure 5:
Figure 5:. The beta-blocker propranolol prevents ER stress induced by norepinephrine in human fat explants and adipocytes.
A) Western blots of cleaved-ATF6 in human fat explants untreated (Ctrl) or treated for 24 hours with the indicated concentrations of norepinephrine alone or in presence of the alpha- and beta-blockers (100 μM). The ER stress inducer tunicamycin (Tun, 5 μg/ml) is shown as a positive control. Quantification of band intensity (A.U., arbitrary unit) is shown on the panel on the right. B) Immunostaining of cleaved-ATF6 in mature 3T3L1 adipocytes untreated (Ctrl) or treated for 24 hours with norepinephrine (100 μM) or tunicamycin (Tun, 5 μg/ml). Quantification of the number of +cells for cleaved-ATF6 is shown on alongside the staining. C) Immunostaining of cleaved-ATF6 in mature 3T3L1 adipocytes untreated (Ctrl) or treated for 24 hours with norepinephrine (100 μM) alone or in presence of the alpha- and beta-blockers for 24 hours. D) ATF4 expression was quantified by Western blot in 3T3L1 mature adipocytes lysates untreated (Ctrl) or exposed to norepinephrine (100 μM) alone or in presence of the alpha-1,2, and beta-blockers (100 μM) for 24 hours. Experiments were repeated 3 separate times with a total sample size (n=6–10) per group included in the analysis. Arrows indicate positive cells. *p<0.05, ** p<0.01, *** p<0.001 vs CTL, # p<0.01 vs blockers.
Figure 6:
Figure 6:. Norepinephrine treatment does not induce ER stress in mesenchymal primary human fibroblast cells.
A-C) Isolated fibroblasts from human skin were treated for 24 hours with 100 μM norepinephrine and immunostaining of (A) BiP, (B) ATF6, and (C) PERK were performed and quantified respectively. D) Adrenoceptors α1A, α1B, α1D, α2A, α2B, α2C, β1, β2, β3 expression in human fibroblasts were assessed as described in (A-C). Experiments were repeated 3 separate times with a total sample size (n=5–9) per group included in the analysis.

References

    1. Peck MD: Epidemiology of burns throughout the world. Part I: Distribution and risk factors. Burns : Journal of the International Society for Burn Injuries 37:1087–1100, 2011. - PubMed
    1. MD P: Epidemiology of burns throughout the world. Part I: Distribution and risk factors. Burns 37:1087–1100, 2011. - PubMed
    1. Jeschke MG, Gauglitz GG, Kulp GA, Finnerty CC, Williams FN, Kraft R, Suman OE, Mlcak RP, Herndon DN: Long-term persistance of the pathophysiologic response to severe burn injury. PloS one 6(7):e21245, 2011. - PMC - PubMed
    1. Childs C, Heath DF, Little RA, Brotherston M: Glucose metabolism in children during the first day after burn injury. Archives of emergency medicine 7:135–147, 1990. - PMC - PubMed
    1. Kulp GA, Herndon DN, Lee JO, Suman OE, Jeschke MG: Extent and magnitude of catecholamine surge in pediatric burned patients. Shock 33:369–374, 2010. - PMC - PubMed

Publication types

MeSH terms