

Breast Density Assessment in Young Women with Ultrasound based on Speed of Sound: Influence of the Menstrual Cycle
- PMID: 31232962
- PMCID: PMC6636937
- DOI: 10.1097/MD.0000000000016123
Breast Density Assessment in Young Women with Ultrasound based on Speed of Sound: Influence of the Menstrual Cycle
Abstract
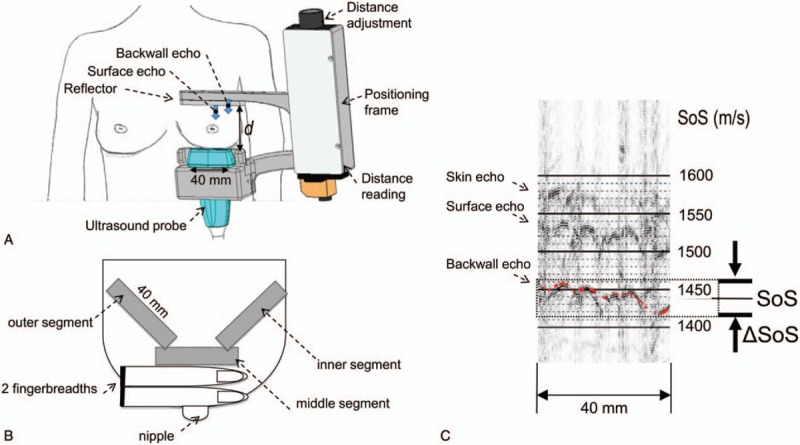
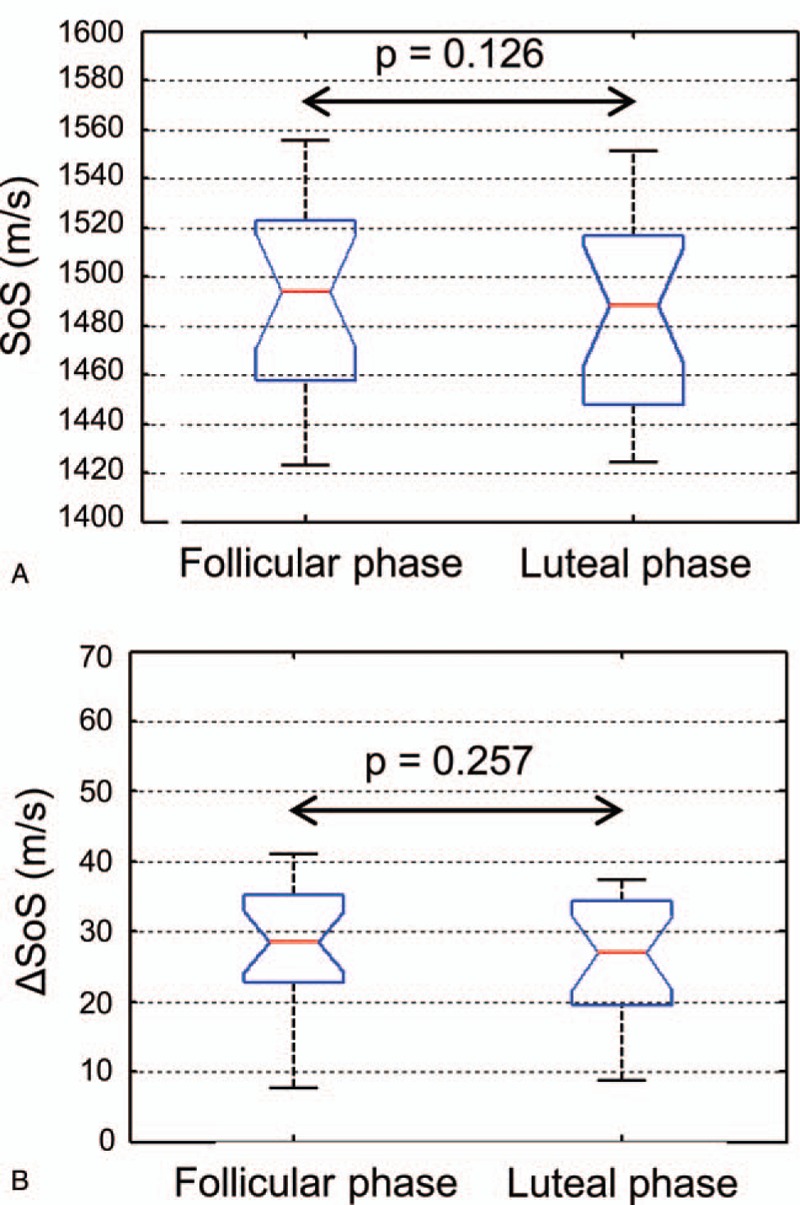
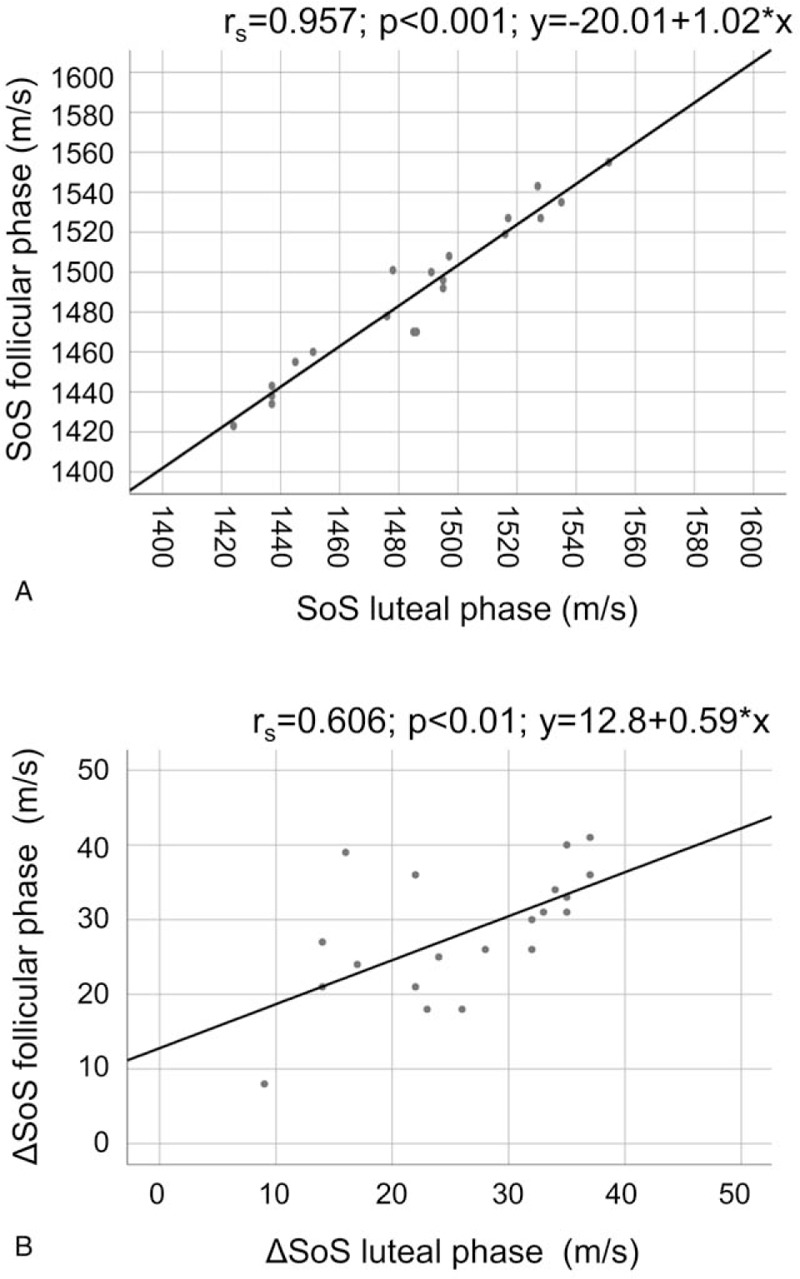
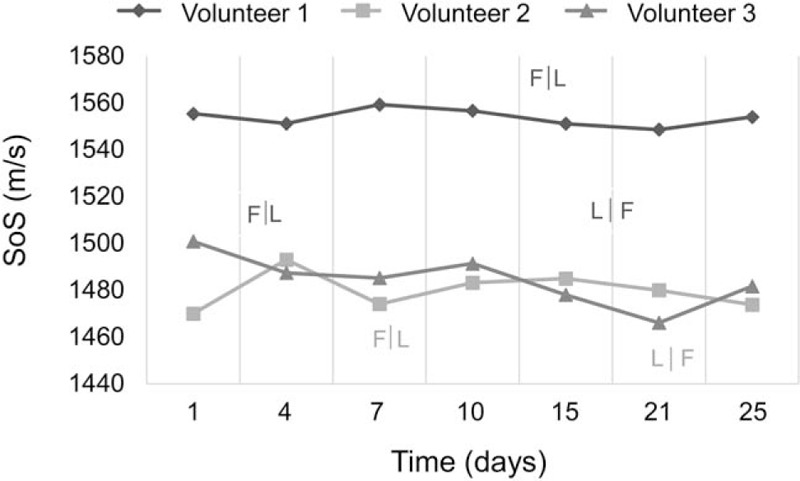
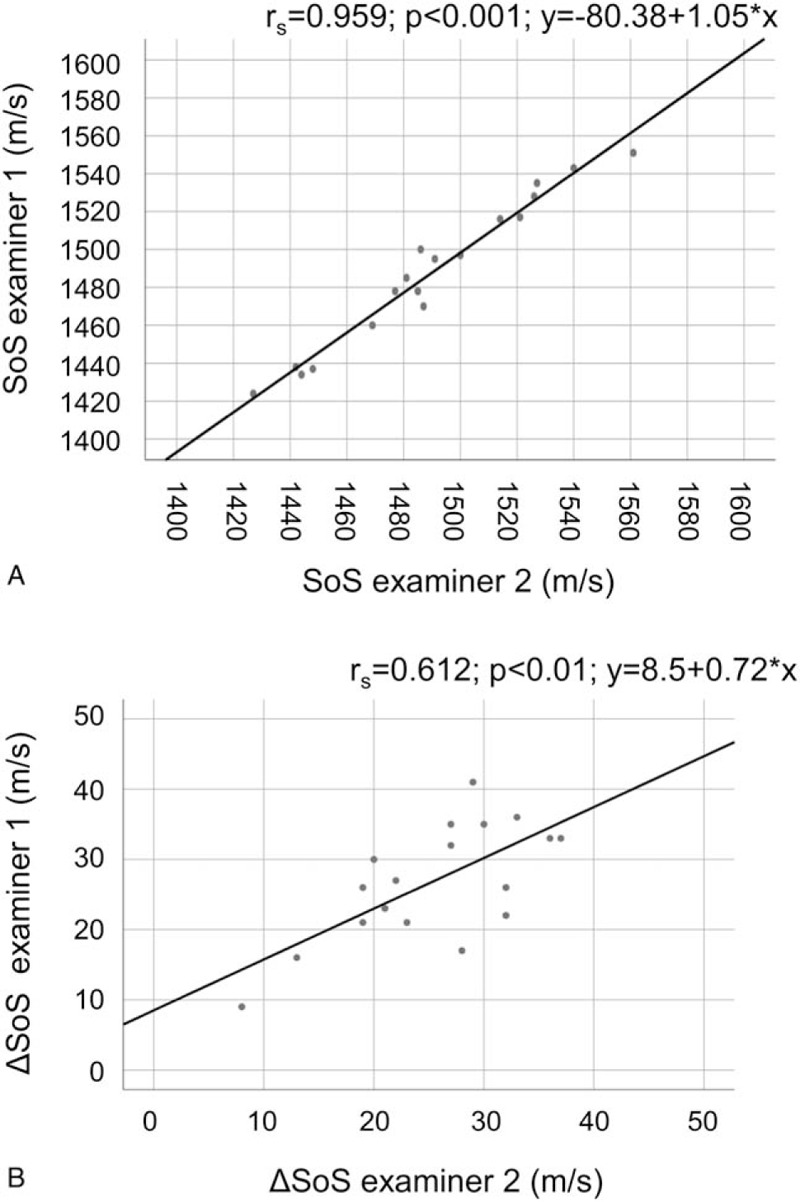
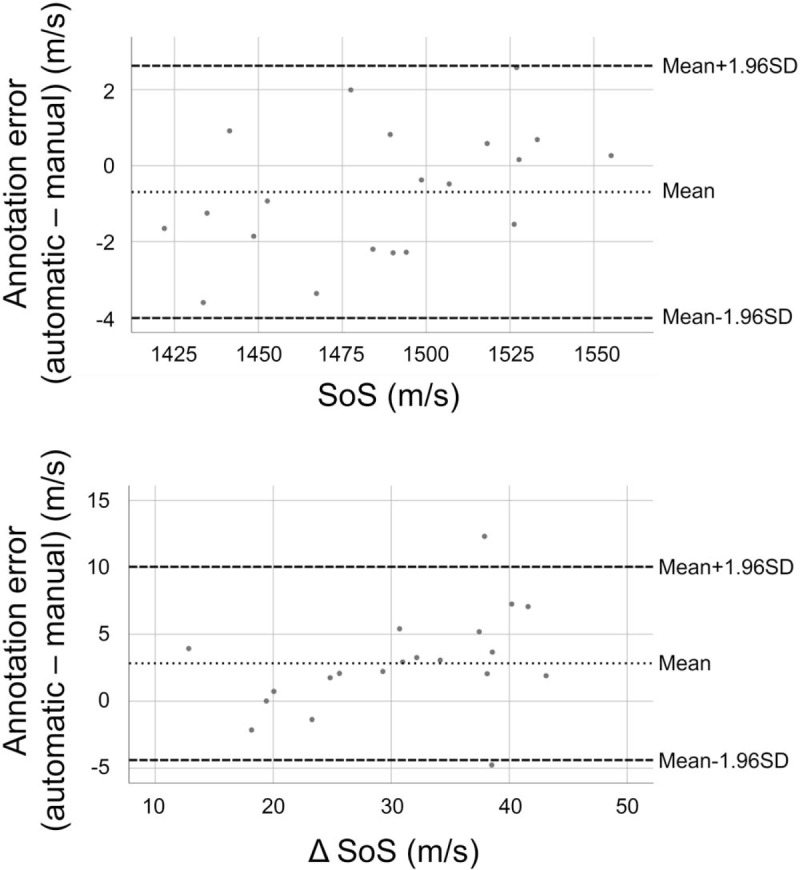
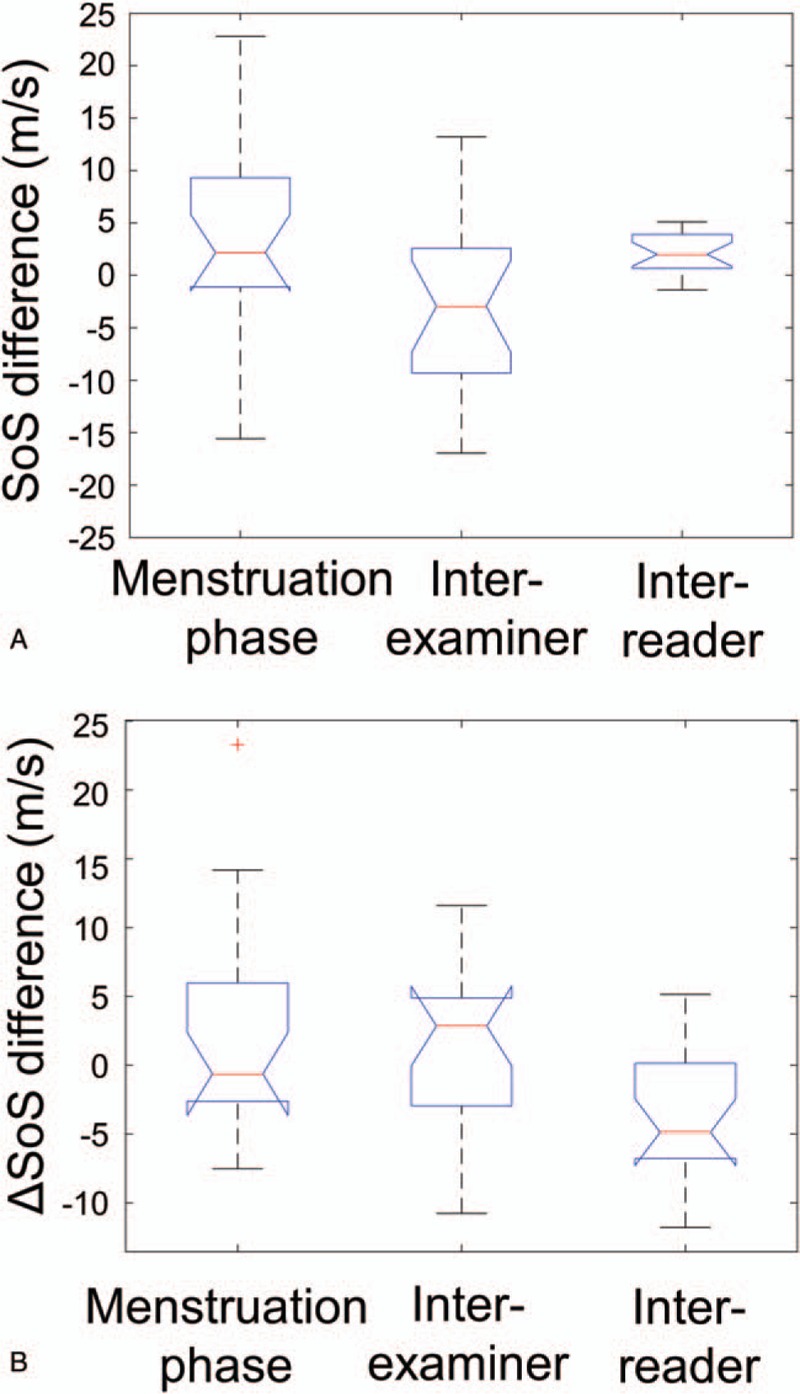
To investigate changes in breast density (BD) during the menstrual cycle in young women in comparison to inter-breast and -segment changes as well as reproducibility of a novel Speed-of-Sound (SoS) Ultrasound (US) method.SoS-US uses a conventional US system with a reflector and a software add-on to quantify SoS in the retro-mammillary, inner and outer segments of both breasts. Twenty healthy women (18-40 years) with regular menstrual cycles were scanned twice with two weeks in-between. Three of these were additionally measured twice per week for 25 days. Average SoS (m/s) and ΔSoS (segment-variation SoS; m/s) were measured. Variations between follicular and luteal phases and changes over the four-week period were assessed. Inter-examiner and inter-reader agreements were also evaluated. Variances between cycle phases, examiners and readers were compared.No significant SoS difference was observed between follicular and luteal phases for the twenty women (P = .126), and between all different days for the three more frequently measured women (P = .892). Inter-reader (ICC = 0.999) and inter-examiner (ICC = 0.990) agreements were high. The SoS variance due to menstrual variations was not significantly larger than the inter-examiner uncertainty (P = .461). Inter-reader variations were significantly smaller than menstrual and examiner variations (P < .001).SoS-US showed high inter-examiner and inter-reader reproducibility. The alterations during the menstrual cycles were not significantly larger than the confidence interval of measurements.
Conflict of interest statement
The authors have no conflicts of interest to disclose.
Figures
References
-
- Bae MS, Moon WK, Chang JM, et al. Breast cancer detected with screening US: reasons for nondetection at mammography. Radiology 2014;270:369–77. - PubMed
-
- Hooley RJ. Breast density legislation and clinical evidence. Radiol Clin North Am 2017;55:513–26. - PubMed
-
- Cuzick J, Warwick J, Pinney E, et al. Tamoxifen-induced reduction in mammographic density and breast cancer risk reduction: a nested case-control study. J Natl Cancer I 2011;103:744–52. - PubMed
MeSH terms
LinkOut - more resources
Full Text Sources
