

Glutaminase 1 Inhibition Reduces Glycolysis and Ameliorates Lupus-like Disease in MRL/lpr Mice and Experimental Autoimmune Encephalomyelitis
- PMID: 31233276
- PMCID: PMC6817384
- DOI: 10.1002/art.41019
Glutaminase 1 Inhibition Reduces Glycolysis and Ameliorates Lupus-like Disease in MRL/lpr Mice and Experimental Autoimmune Encephalomyelitis
Abstract
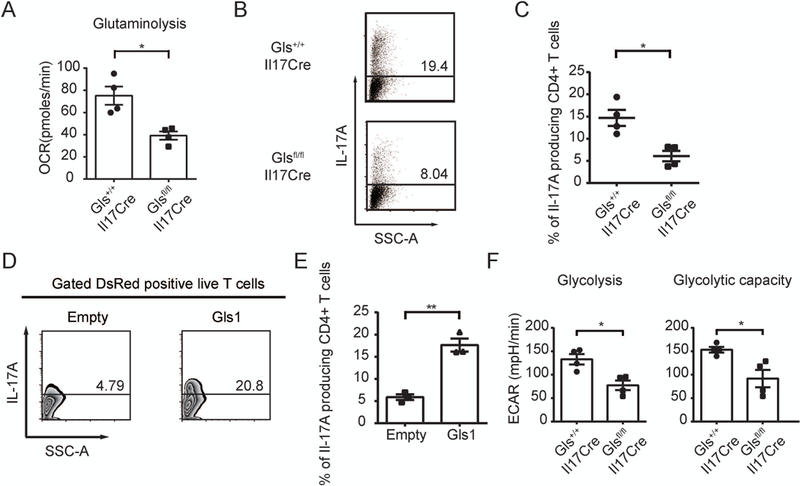
Objective: Glutaminase 1 (Gls1) is the first enzyme in glutaminolysis. The selective Gls1 inhibitor bis-2-(5-phenylacetamido-1,3,4-thiadiazol-2-yl)ethyl sulfide (BPTES) suppresses Th17 development and ameliorates experimental autoimmune encephalomyelitis (EAE). The present study was undertaken to investigate whether inhibition of glutaminolysis is beneficial for the treatment of systemic lupus erythematosus (SLE), and the involved mechanisms.
Methods: MRL/lpr mice were treated with BPTES or vehicle control, and disease activity was examined. Then naive CD4+ T cells from patients with SLE were cultured under Th17-polarizing conditions with BPTES or vehicle. Furthermore, using newly generated Gls1 conditional-knockout mice, in vitro Th17 differentiation was examined, and EAE was induced in the mice. Glutaminolysis and glycolysis were measured with an extracellular flux analyzer. The expression of hypoxia-inducible factor 1α (HIF-1α) was examined by Western blotting.
Results: Treatment of MRL/lpr mice with BPTES improved autoimmune pathology in a Th17-dependent manner. T cells from patients with SLE treated with BPTES displayed decreased Th17 differentiation (P < 0.05). Using the conditional-knockout mice, we demonstrated that both in vitro Th17 differentiation (P < 0.05) and the development of EAE were dependent on Gls1. Gls1 inhibition reduced glycolysis and the expression of HIF-1α protein, which induces glycolysis.
Conclusion: We demonstrated that inhibition of glutaminolysis represents a potential new treatment strategy for patients with SLE and Th17-related autoimmune diseases. Mechanistically, we have shown that inhibition of glutaminolysis affects the glycolysis pathway by reducing HIF-1α protein in Th17 cells.
© 2019, American College of Rheumatology.
Figures


Similar articles
-
Inhibition of glutaminolysis ameliorates lupus by regulating T and B cell subsets and downregulating the mTOR/P70S6K/4EBP1 and NLRP3/caspase-1/IL-1β pathways in MRL/lpr mice.Int Immunopharmacol. 2022 Nov;112:109133. doi: 10.1016/j.intimp.2022.109133. Epub 2022 Sep 13. Int Immunopharmacol. 2022. PMID: 36113317
-
Transcriptional factor ICER promotes glutaminolysis and the generation of Th17 cells.Proc Natl Acad Sci U S A. 2018 Mar 6;115(10):2478-2483. doi: 10.1073/pnas.1714717115. Epub 2018 Feb 20. Proc Natl Acad Sci U S A. 2018. PMID: 29463741 Free PMC article.
-
Promotion of Calcium/Calmodulin-Dependent Protein Kinase 4 by GLUT1-Dependent Glycolysis in Systemic Lupus Erythematosus.Arthritis Rheumatol. 2019 May;71(5):766-772. doi: 10.1002/art.40785. Epub 2019 Mar 20. Arthritis Rheumatol. 2019. PMID: 30462889
-
Deciphering the landscape of allosteric glutaminase 1 inhibitors as anticancer agents.Bioorg Chem. 2025 Jul 1;161:108523. doi: 10.1016/j.bioorg.2025.108523. Epub 2025 Apr 26. Bioorg Chem. 2025. PMID: 40311238 Review.
-
T Cell Metabolism: A New Perspective on Th17/Treg Cell Imbalance in Systemic Lupus Erythematosus.Front Immunol. 2020 May 22;11:1027. doi: 10.3389/fimmu.2020.01027. eCollection 2020. Front Immunol. 2020. PMID: 32528480 Free PMC article. Review.
Cited by
-
Emerging role of hypoxia-inducible factor-1α in inflammatory autoimmune diseases: A comprehensive review.Front Immunol. 2023 Jan 25;13:1073971. doi: 10.3389/fimmu.2022.1073971. eCollection 2022. Front Immunol. 2023. PMID: 36761171 Free PMC article. Review.
-
Glycolysis in Innate Immune Cells Contributes to Autoimmunity.Front Immunol. 2022 Jul 1;13:920029. doi: 10.3389/fimmu.2022.920029. eCollection 2022. Front Immunol. 2022. PMID: 35844594 Free PMC article. Review.
-
Glutaminase inhibition as potential cancer therapeutics: current status and future applications.J Enzyme Inhib Med Chem. 2024 Dec;39(1):2290911. doi: 10.1080/14756366.2023.2290911. Epub 2023 Dec 11. J Enzyme Inhib Med Chem. 2024. PMID: 38078371 Free PMC article. Review.
-
Screening and validating genes associated with cuproptosis in systemic lupus erythematosus by expression profiling combined with machine learning.Biomol Biomed. 2025 Mar 7;25(4):965-975. doi: 10.17305/bb.2024.10996. Biomol Biomed. 2025. PMID: 39388708 Free PMC article.
-
Immunometabolism in the pathogenesis of systemic lupus erythematosus: an update.Curr Opin Rheumatol. 2020 Nov;32(6):562-571. doi: 10.1097/BOR.0000000000000738. Curr Opin Rheumatol. 2020. PMID: 32826478 Free PMC article. Review.
References
-
- Morel L Immunometabolism in systemic lupus erythematosus. Nat Rev Rheumatol 2017;13:280–90. - PubMed
Publication types
MeSH terms
Substances
Grants and funding
LinkOut - more resources
Full Text Sources
Medical
Research Materials
Miscellaneous
