

Bridging the gap between HIV epidemiology and antiretroviral resistance evolution: Modelling the spread of resistance in South Africa
- PMID: 31233494
- PMCID: PMC6611642
- DOI: 10.1371/journal.pcbi.1007083
Bridging the gap between HIV epidemiology and antiretroviral resistance evolution: Modelling the spread of resistance in South Africa
Abstract
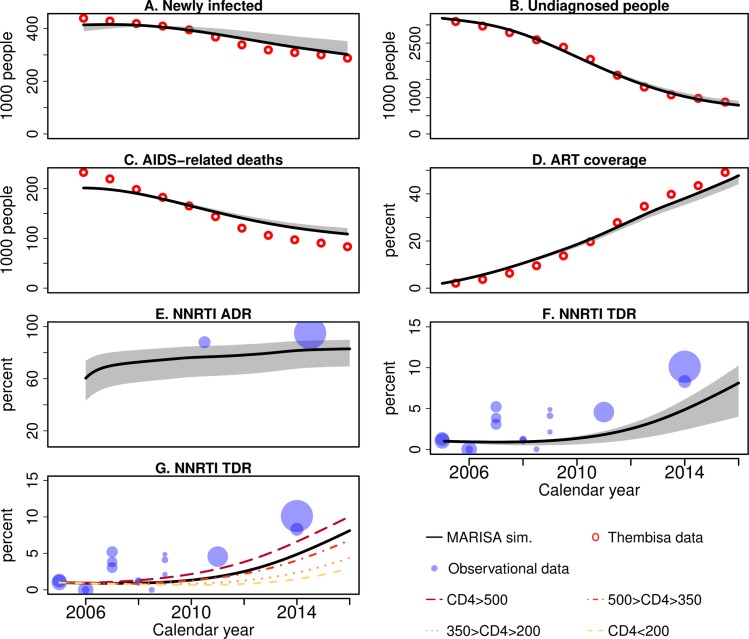
The scale-up of antiretroviral therapy (ART) in South Africa substantially reduced AIDS-related deaths and new HIV infections. However, its success is threatened by the emergence of resistance to non-nucleoside reverse-transcriptase inhibitors (NNRTI). The MARISA (Modelling Antiretroviral drug Resistance In South Africa) model presented here aims at investigating the time trends and factors driving NNRTI resistance in South Africa. MARISA is a compartmental model that includes the key aspects of the local HIV epidemic: continuum of care, disease progression, and gender. The dynamics of NNRTI resistance emergence and transmission are then added to this framework. Model parameters are informed using data from HIV cohorts participating in the International epidemiology Databases to Evaluate AIDS (IeDEA) and literature estimates, or fitted to UNAIDS estimates. Using this novel approach of triangulating clinical and resistance data from various sources, MARISA reproduces the time trends of HIV in South Africa in 2005-2016, with a decrease in new infections, undiagnosed individuals, and AIDS-related deaths. MARISA captures the dynamics of the spread of NNRTI resistance: high levels of acquired drug resistance (ADR, in 83% of first-line treatment failures in 2016), and increasing transmitted drug resistance (TDR, in 8.1% of ART initiators in 2016). Simulation of counter-factual scenarios reflecting alternative public health policies shows that increasing treatment coverage would have resulted in fewer new infections and deaths, at the cost of higher TDR (11.6% in 2016 for doubling the treatment rate). Conversely, improving switching to second-line treatment would have led to lower TDR (6.5% in 2016 for doubling the switching rate) and fewer new infections and deaths. Implementing drug resistance testing would have had little impact. The rapid ART scale-up and inadequate switching to second-line treatment were the key drivers of the spread of NNRTI resistance in South Africa. However, even though some interventions could have substantially reduced the level of NNRTI resistance, no policy including NNRTI-based first line regimens could have prevented this spread. Thus, by combining epidemiological data on HIV in South Africa with biological data on resistance evolution, our modelling approach identified key factors driving NNRTI resistance, highlighting the need of alternative first-line regimens.
Conflict of interest statement
RDK has received travel support and honoraria from Gilead Sciences not related to this work.
Figures


References
-
- UNAIDS. South Africa | UNAIDS data [Internet]. [cited 26 Jun 2018]. Available: http://www.unaids.org/en/regionscountries/countries/southafrica
-
- Johnson LF, May MT, Dorrington RE, Cornell M, Boulle A, Egger M, et al. Estimating the impact of antiretroviral treatment on adult mortality trends in South Africa: A mathematical modelling study. Suthar AB, editor. PLOS Med. Public Library of Science; 2017;14: e1002468 10.1371/journal.pmed.1002468 - DOI - PMC - PubMed
-
- WHO. WHO | HIV drug resistance report 2017 [Internet]. WHO. World Health Organization; 2017. Available: http://www.who.int/hiv/pub/drugresistance/hivdr-report-2017/en/
-
- Meintjes G, Moorhouse MA, Carmona S, Davies N, Dlamini S, Van Vuuren C, et al. Adult antiretroviral therapy guidelines 2017. South Afr J HIV Med. 2017;18 Available: http://www.sajhivmed.org.za - PMC - PubMed
Publication types
MeSH terms
Substances
Grants and funding
LinkOut - more resources
Full Text Sources
Medical
Research Materials
Miscellaneous
