. 2019 Jun 24;15(6):e1008244.
doi: 10.1371/journal.pgen.1008244. eCollection 2019 Jun.

Congenital lipodystrophy induces severe osteosclerosis

Affiliations

Congenital lipodystrophy induces severe osteosclerosis

Wei Zou et al. PLoS Genet. .

Abstract

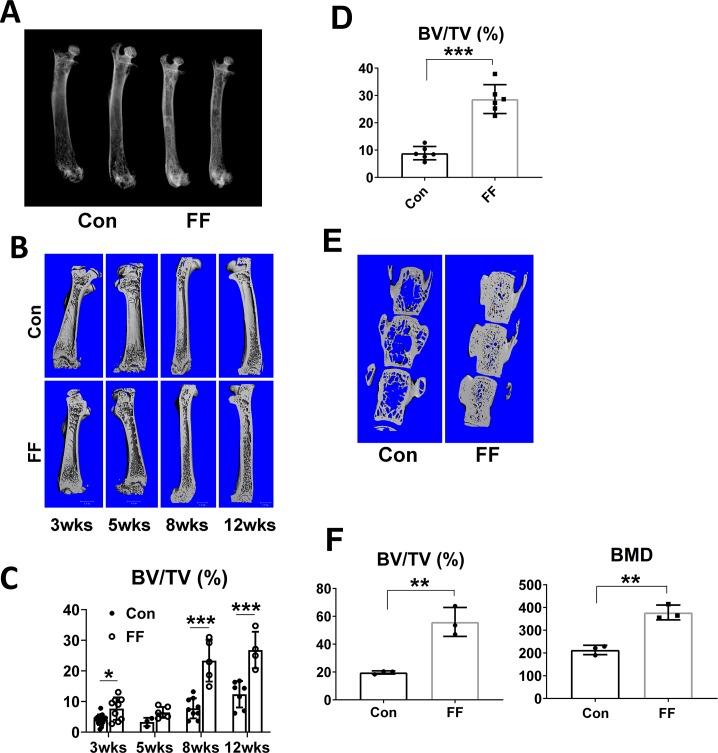
Berardinelli-Seip congenital generalized lipodystrophy is associated with increased bone mass suggesting that fat tissue regulates the skeleton. Because there is little mechanistic information regarding this issue, we generated "fat-free" (FF) mice completely lacking visible visceral, subcutaneous and brown fat. Due to robust osteoblastic activity, trabecular and cortical bone volume is markedly enhanced in these animals. FF mice, like Berardinelli-Seip patients, are diabetic but normalization of glucose tolerance and significant reduction in circulating insulin fails to alter their skeletal phenotype. Importantly, the skeletal phenotype of FF mice is completely rescued by transplantation of adipocyte precursors or white or brown fat depots, indicating that adipocyte derived products regulate bone mass. Confirming such is the case, transplantation of fat derived from adiponectin and leptin double knockout mice, unlike that obtained from their WT counterparts, fails to normalize FF bone. These observations suggest a paucity of leptin and adiponectin may contribute to the increased bone mass of Berardinelli-Seip patients.


Conflict of interest statement

The authors have declared that no competing interests exist.

Figures

Fig 1
Fig 1. FF mice have undetectable serum adipokines.
Serum adipokines of control and FF mice. Data are presented as mean ± SD. *** p<0.001 as determined by unpaired t test.
Fig 2
Fig 2. Congenital absence of fat promotes osteosclerosis.
A) Radiographs of femurs of 3 month old control and FF mice. B) Age-dependent μCT images of femurs of FF and control littermates. C) Quantitative μCT analysis of B. D) Histomorphometric analysis of trabecular bone volume of 3 month old FF and control tibia. E) μCT images of vertebrae (L3-5) of 3 months old control and FF littermates. F) Quantitative μCT analysis of trabecular bone volume and bone mineral density of E. Data are presented as mean ± SD. *p<0.05; **p<0.01; *** p<0.001 as determined by unpaired t test (D, F) and 2 way ANOVA with Holm-Sidak's post hoc analysis for multiple comparisons test (C).
Fig 3
Fig 3. Congenital absence of fat promotes bone formation.
A) Serum osteocalcin of FF and control mice. B) qPCR analysis of osteoblast differentiation markers present in RNA extracted from femurs of 6-week old FF and control mice. C) Fluorescence microscopic images of distal femur of control and FF mice administered time-spaced calcein. Scale bar: 400 μm. D) Histomorphometric analysis of total bone formation rate (BFR), bone formation rate per mm trabecular surface (BFR/BS) and mineral apposition rate (MAR) of trabecular bone. E) TRAP stained (red reaction product) control and FF femur. FF endocortical surface is lined by columnar osteoblasts (arrows) characteristic of robust bone formation. Scale bar: 800 μm. F) Histomorphometric analysis of endocortical MAR. G) Histomorphometric analysis of periosteal MAR. Data are presented as mean ± SD. *p<0.05; **p<0.01; ***p<0.001 as determined by unpaired t test.
Fig 4
Fig 4. Congenital absence of fat increases osteoclast number but not function.
A) Serum TRAP5b of FF and control mice. B) Histomorphometric analysis of osteoclast number/mm bone surface. C) qPCR analysis of osteoclast differentiation markers present in RNA extracted from femurs of 6-week old FF and control mice. D) TRAP stained FF and control bones. Scale Bar: 100 μm. E) Ratio of serum CTx to TRAP5b of FF and control mice. Data are presented as mean ± SD. *p<0.05; **p<0.01; ***p<0.001 as determined by unpaired t test.
Fig 5
Fig 5. Congenital absence of fat enhances bone strength.
Bending tests analysis of FF and control femoral (A) stiffness and (B) ultimate force (a measure of whole-bone strength). (C) μCT analysis of diaphyseal bone area. (D) Polar moment of inertia. (E) Post-yield displacement. (F) Work to fracture. Data are presented as mean ± SD. *p<0.05; **p<0.01 as determined by unpaired t test.
Fig 6
Fig 6. Osteosclerosis of FF mice is not caused by the metabolic syndrome.
A) Femoral trabecular bone volume of control and FF mice maintained for 3 months at 23 C (RT) or 30 C. B) Serum insulin of FF mice with or without metformin treatment. Control mice serve as normal control. C) Glucose tolerance test of 2 month old FF and control littermates. D) Insulin tolerance test of 2 month old FF and control littermates. E) Glucose tolerance test of FF and control mice after 3 months treatment with or without metformin. F) μCT quantitative analysis of distal femurs of FF and control mice following 3 months with or without metformin. Data are presented as mean ± SD. *p<0.05; **p<0.01; ***p<0.001; NS: no significance as determined by 1 way ANOVA (B) and 2 way ANOVA with Holm-Sidak's post hoc analysis for multiple comparisons test (A,C,D,E,F).
Fig 7
Fig 7. Transplanted WT adipose tissue normalizes FF skeleton.
A) Left: Fat mass (arrow) in FF mouse 4 months after subcutaneous MEF transplantation. Right: WT MEF transplantation normalizes liver size of FF liver (star). B) Histological image of Fat mass in FF mouse 4 months after subcutaneous MEF transplantation; Scale bar: 1mm. C) Histological images of FF liver showing severe steatosis (left Panel) in sham operated mice and its elimination by MEF transplantation (right Panel). Scale bar: 400μm. D) μCT images and E) quantitative analysis trabecular volume and bone mineral density of distal femurs of FF mice 4 months after sham operation or MEF transplantation. F) Histomorphometric analysis of tibial trabecular bone volume and osteoclast number in WT controls and FF mice 4 months after sham operation or MEF transplantation. G) Radiographs of femurs of FF mice 3 months after sham operation or transplantation of various fat depots. H) μCT analysis of trabecular bone volume and bone mineral density of distal femurs of FF mice 3 months after sham operation or transplantation of various fat depots. Data are presented as mean ± SD. *p<0.05; **p<0.01; *** p<0.001 as determined by ANOVA with Holm-Sidak's post hoc analysis for multiple comparisons test.
Fig 8
Fig 8. Absence of leptin and adiponectin moderates FF osteosclerosis.
A) Transplanted fat depots 3 months after surgery. B) Fat depot weight 3 months after transplantation. C) Serum leptin and adiponectin of FF mice 3 months after fat depot transplantation. WT and non-transplanted FF mice serve as control. D) μCT analysis of trabecular bone volume and bone mineral density of distal femurs of FF mice 3 months after sham operation or transplantation of fat derived from WT or adipokine-deficient mice. Data are presented as mean ± SD. **p<0.01; *** p<0.001 as determined by ANOVA with Holm-Sidak's post hoc analysis for multiple comparisons test. D) comparison with FF Sham except where detailed.

References

    1. Ducy P, Amling M, Takeda S, Priemel M, Schilling AF, Beil FT, et al. Leptin inhibits bone formation through a hypothalamic relay: A central control of bone mass. Cell. 2000;100(2):197–207. Epub 2000/02/05. 10.1016/S0092-8674(00)81558-5 WOS:000084932200004. - DOI - PubMed
    1. Elefteriou F, Takeda S, Ebihara K, Magre J, Patano N, Kim CA, et al. Serum leptin level is a regulator of bone mass. Proc Natl Acad Sci U S A. 2004;101(9):3258–63. Epub 2004/02/24. 10.1073/pnas.0308744101 - DOI - PMC - PubMed
    1. Ferron M, Wei J, Yoshizawa T, Del Fattore A, DePinho RA, Teti A, et al. Insulin signaling in osteoblasts integrates bone remodeling and energy metabolism. Cell. 2010;142(2):296–308. Epub 2010/07/27. 10.1016/j.cell.2010.06.003 - DOI - PMC - PubMed
    1. Kajimura D, Lee HW, Riley KJ, Arteaga-Solis E, Ferron M, Zhou B, et al. Adiponectin regulates bone mass via opposite central and peripheral mechanisms through FoxO1. Cell Metab. 2013;17(6):901–15. Epub 2013/05/21. 10.1016/j.cmet.2013.04.009 - DOI - PMC - PubMed
    1. Cohen A, Dempster DW, Recker RR, Lappe JM, Zhou H, Zwahlen A, et al. Abdominal fat is associated with lower bone formation and inferior bone quality in healthy premenopausal women: a transiliac bone biopsy study. J Clin Endocrinol Metab. 2013;98(6):2562–72. Epub 2013/03/22. 10.1210/jc.2013-1047 - DOI - PMC - PubMed

Publication types

MeSH terms

LinkOut - more resources