

Soil carbon (C), nitrogen (N) and phosphorus (P) stoichiometry drives phosphorus lability in paddy soil under long-term fertilization: A fractionation and path analysis study
- PMID: 31233510
- PMCID: PMC6590810
- DOI: 10.1371/journal.pone.0218195
Soil carbon (C), nitrogen (N) and phosphorus (P) stoichiometry drives phosphorus lability in paddy soil under long-term fertilization: A fractionation and path analysis study
Abstract
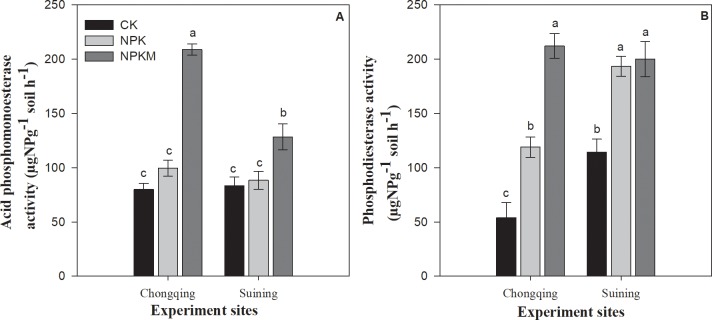
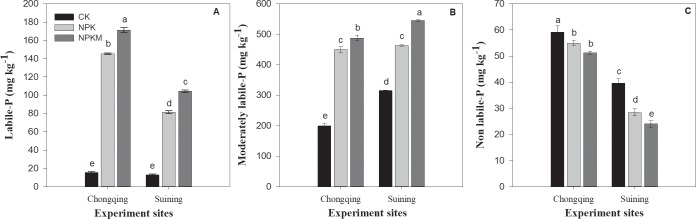
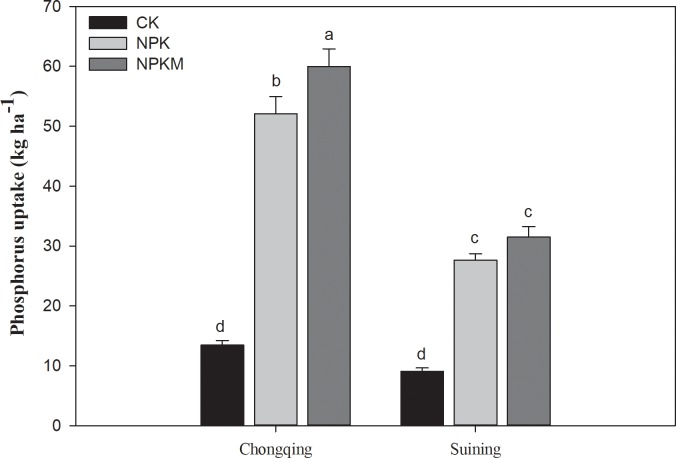
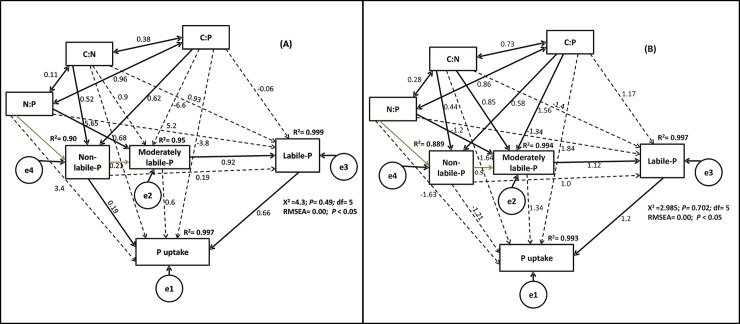
Soil C:N:P stoichiometry plays a vital role in nutrient cycling in ecosystems, but its importance to P transformation in paddy soil remains unclear. We investigated the effect of soil C:N:P stoichiometry on P mobility and uptake under long-term fertilization. Three treatments, CK (no fertilization), NPK (inorganic nitrogen, phosphorus and potassium fertilization) and NPKM (combined inorganic NPK fertilizer and manure application), were selected from two long-term experiments of paddy soil that were initiated in 1991 and 1982 in Chongqing and Suining, respectively. The results showed that in comparison the control treatment, under long-term fertilization, soil pH decreased. In comparison with the NPK and CK treatments, the NPKM treatment significantly increased soil nutrient contents, P uptake and phosphatase activities. In comparison to the CK treatment, the NPK and NPKM treatments significantly decreased soil C:N, C:P and N:P ratios. In comparison to NPK and CK treatments, the NPKM treatment decreased residual-P at both sites. Compared with CK treatment, the NPKM treatments increased labile-P and moderately labile-P by 987% and 144%, respectively, and NPK treatment increased these factors by 823% and 125%, respectively, at the Chongqing site. At the Suining site, with NPKM treatment, increases in labile-P and moderately labile-P were 706% and 73%, respectively, and with NPK treatment, the increases were 529% and 47%, respectively. In contrast, non-labile-P was significantly decreased with NPKM treatment in comparison to that with NPK and CK treatments. Moreover, increases in soil C:N and C:P ratios decreased the labile-P pools and increased non-labile-P pools. A path analysis indicated that soil C:N:P stoichiometry indirectly controlled P uptake by directly affecting P transformation from non-labile to labile-P pools. Moreover, the non-labile-P in soil with high SOM and P content directly affected P uptake, indicating that soil P transformation is mainly driven by soil C and P in paddy soil. In conclusion, understanding mechanism of P mobility influenced by soil C:N:P stoichiometry could be helpful to manage soil P fertility under long-term fertilization in paddy soils of these regions.
Conflict of interest statement
The authors have declared that no competing interests exist.
Figures


Similar articles
-
Changes in phosphorus fractions associated with soil chemical properties under long-term organic and inorganic fertilization in paddy soils of southern China.PLoS One. 2019 May 10;14(5):e0216881. doi: 10.1371/journal.pone.0216881. eCollection 2019. PLoS One. 2019. PMID: 31075143 Free PMC article.
-
Impact of long-term fertilization on phosphorus fractions and manganese oxide with their interactions in paddy soil aggregates.J Environ Manage. 2023 May 1;333:117440. doi: 10.1016/j.jenvman.2023.117440. Epub 2023 Feb 7. J Environ Manage. 2023. PMID: 36758407
-
[Effects of different fertilization regimes on nitrogen and phosphorus balance and eco-economic benefits in red paddy field.].Ying Yong Sheng Tai Xue Bao. 2018 Jan;29(1):158-166. doi: 10.13287/j.1001-9332.201801.029. Ying Yong Sheng Tai Xue Bao. 2018. PMID: 29692024 Chinese.
-
Differential nutrient limitation of soil microbial biomass and metabolic quotients (qCO2): is there a biological stoichiometry of soil microbes?PLoS One. 2013;8(3):e57127. doi: 10.1371/journal.pone.0057127. Epub 2013 Mar 19. PLoS One. 2013. PMID: 23526933 Free PMC article. Review.
-
Soil fungal mycelia have unexpectedly flexible stoichiometric C:N and C:P ratios.Ecol Lett. 2021 Feb;24(2):208-218. doi: 10.1111/ele.13632. Epub 2020 Nov 9. Ecol Lett. 2021. PMID: 33169908 Review.
Cited by
-
Impact of IPM practices on microbial population and disease development in transplanted and direct-seeded rice.Front Microbiol. 2024 Jul 30;15:1388754. doi: 10.3389/fmicb.2024.1388754. eCollection 2024. Front Microbiol. 2024. PMID: 39144223 Free PMC article.
-
DNA Stable-Isotope Probing Delineates Carbon Flows from Rice Residues into Soil Microbial Communities Depending on Fertilization.Appl Environ Microbiol. 2020 Mar 18;86(7):e02151-19. doi: 10.1128/AEM.02151-19. Print 2020 Mar 18. Appl Environ Microbiol. 2020. PMID: 31953339 Free PMC article.
-
Co-composting of cattle manure with biochar and elemental sulphur and its effects on manure quality, plant biomass and microbiological characteristics of post-harvest soil.Front Plant Sci. 2022 Sep 29;13:1004879. doi: 10.3389/fpls.2022.1004879. eCollection 2022. Front Plant Sci. 2022. PMID: 36247542 Free PMC article.
-
Time-dependent impact of co-matured manure with elemental sulfur and biochar on the soil agro-ecological properties and plant biomass.Sci Rep. 2023 Mar 15;13(1):4327. doi: 10.1038/s41598-023-31348-7. Sci Rep. 2023. PMID: 36922558 Free PMC article.
-
Cross-Talk between Transcriptome Analysis and Physiological Characterization Identifies the Genes in Response to the Low Phosphorus Stress in Malus mandshurica.Int J Mol Sci. 2022 Apr 28;23(9):4896. doi: 10.3390/ijms23094896. Int J Mol Sci. 2022. PMID: 35563283 Free PMC article.
References
-
- Williams A, Börjesson G, Hedlund K. Soil Biology & Biochemistry The effects of 55 years of different inorganic fertiliser regimes on soil properties and microbial community composition. Soil Biol Biochem. Elsevier Ltd; 2013;67: 41–46. 10.1016/j.soilbio.2013.08.008 - DOI
-
- Malik MA, Marschner P, Khan KS. Addition of organic and inorganic P sources to soil e Effects on P pools and microorganisms. Soil Biol Biochem. Elsevier Ltd; 2012;49: 106–113. 10.1016/j.soilbio.2012.02.013 - DOI
-
- Ayaga G, Todd A, Brookes PC. Enhanced biological cycling of phosphorus increases its availability to crops in low-input sub-Saharan farming systems. Soil Biol Biochem. 2006;38: 81–90. 10.1016/j.soilbio.2005.04.019 - DOI
-
- Higgs B, Johnston AE, Salter JL, Dawson CJ. Some Aspects of Achieving Sustainable Phosphorus Use in Agriculture. J Environ Qual. 2000; 80–87.
Publication types
MeSH terms
Substances
LinkOut - more resources
Full Text Sources
Research Materials
