. 2019 Jun 24;19(1):619.
doi: 10.1186/s12885-019-5813-z.

Master regulator analysis of paragangliomas carrying SDHx, VHL, or MAML3 genetic alterations

Affiliations

Master regulator analysis of paragangliomas carrying SDHx, VHL, or MAML3 genetic alterations

John A Smestad et al. BMC Cancer. .

Abstract

Background: Succinate dehydrogenase (SDH) loss and mastermind-like 3 (MAML3) translocation are two clinically important genetic alterations that correlate with increased rates of metastasis in subtypes of human paraganglioma and pheochromocytoma (PPGL) neuroendocrine tumors. Although hypotheses propose that succinate accumulation after SDH loss poisons dioxygenases and activates pseudohypoxia and epigenomic hypermethylation, it remains unclear whether these mechanisms account for oncogenic transcriptional patterns. Additionally, MAML3 translocation has recently been identified as a genetic alteration in PPGL, but is poorly understood. We hypothesize that a key to understanding tumorigenesis driven by these genetic alterations is identification of the transcription factors responsible for the observed oncogenic transcriptional changes.

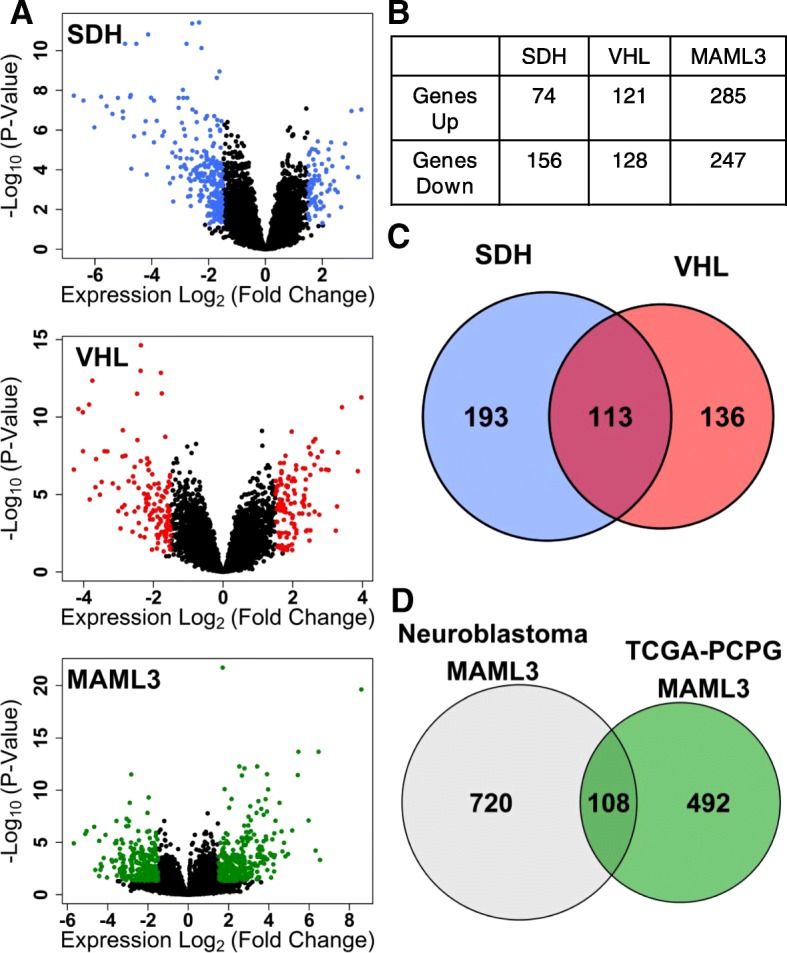
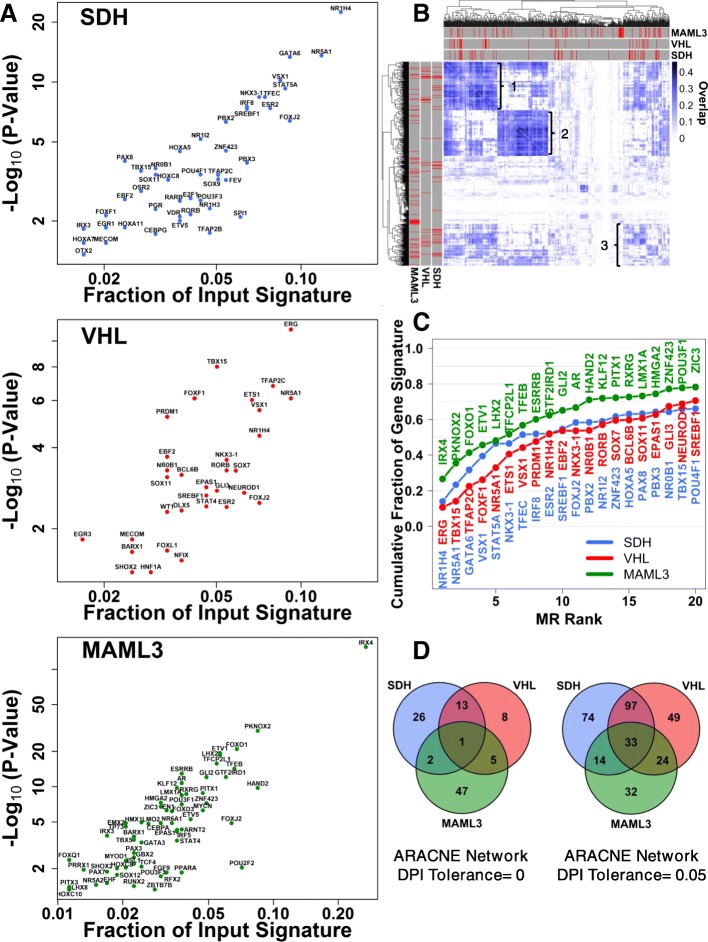
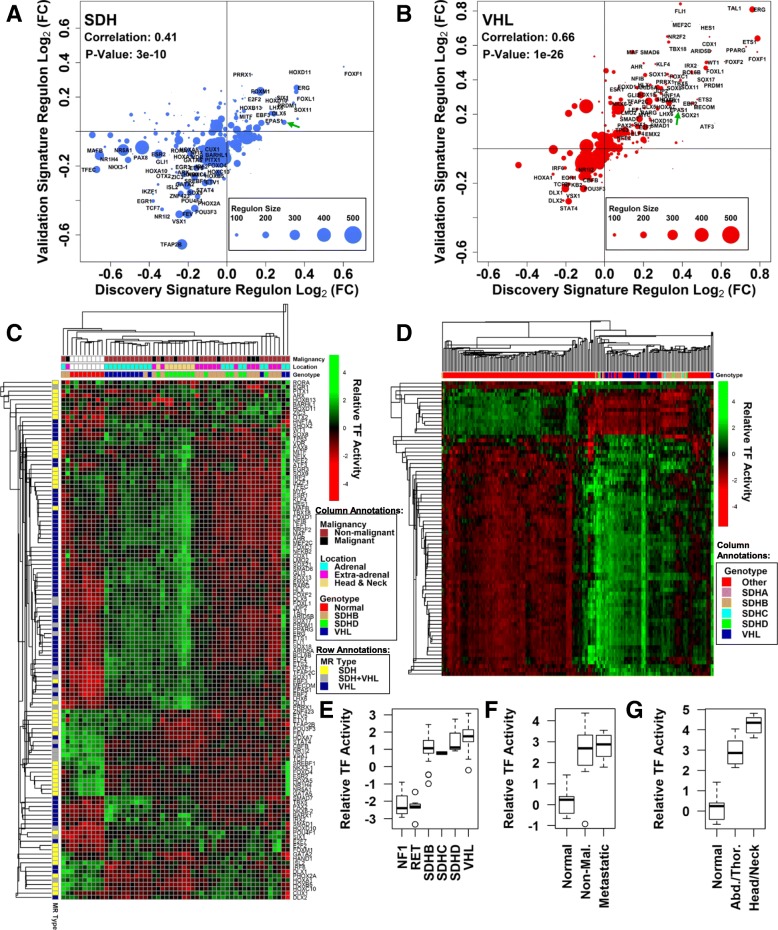
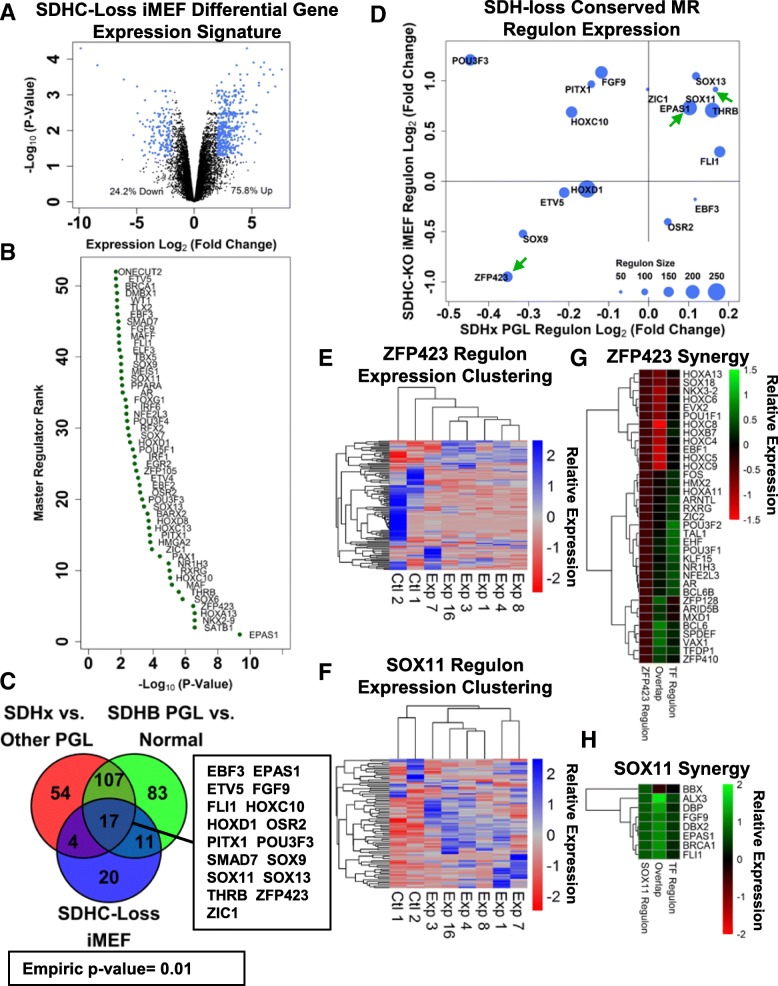
Methods: We leverage publicly-available human tumor gene expression profiling experiments (N = 179) to reconstruct a PPGL tumor-specific transcriptional network. We subsequently use the inferred transcriptional network to perform master regulator analyses nominating transcription factors predicted to control oncogenic transcription in specific PPGL molecular subtypes. Results are validated by analysis of an independent collection of PPGL tumor specimens (N = 188). We then perform a similar master regulator analysis in SDH-loss mouse embryonic fibroblasts (MEFs) to infer aspects of SDH loss master regulator response conserved across species and tissue types.

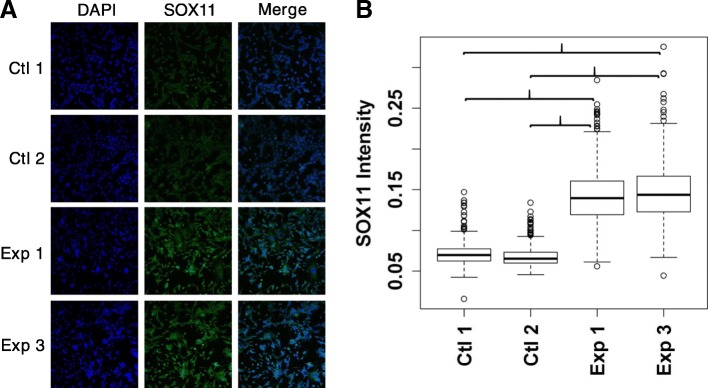
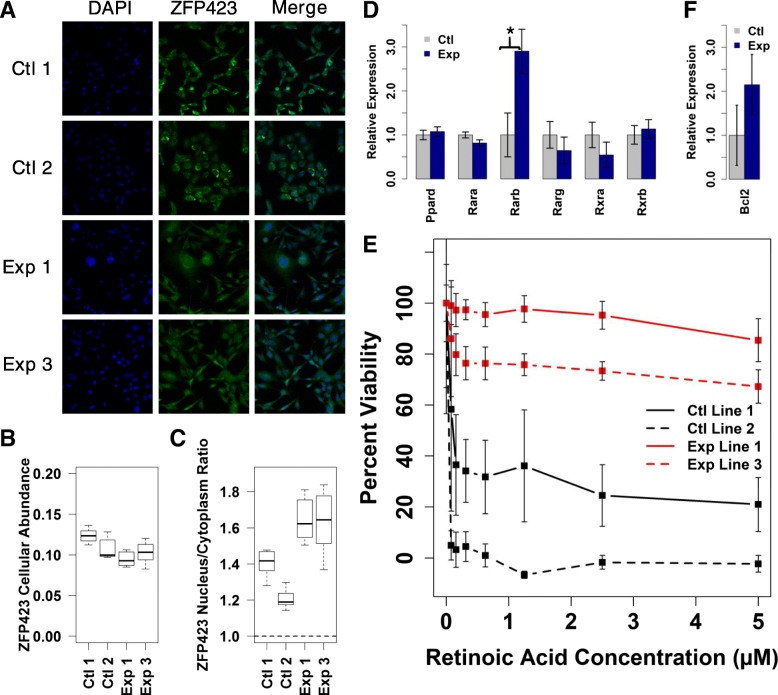
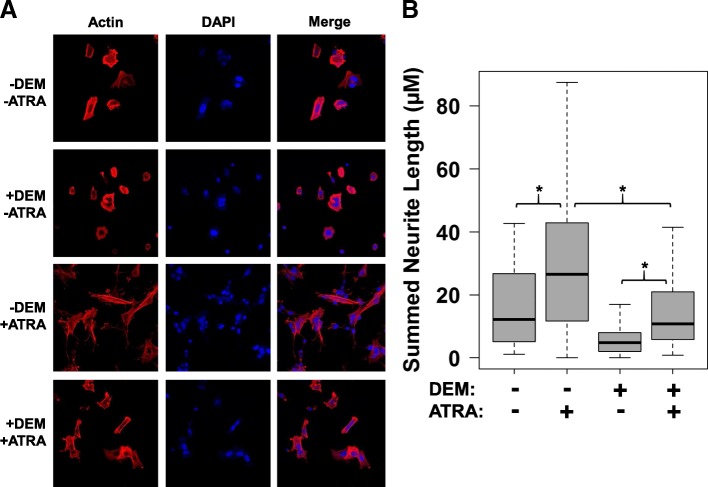
Results: A small number of master regulator transcription factors are predicted to drive the observed subtype-specific gene expression patterns in SDH loss and MAML3 translocation-positive PPGL. Interestingly, although EPAS1 perturbation is detectible in SDH-loss and VHL-loss tumors, it is by no means the most potent factor driving observed patterns of transcriptional dysregulation. Analysis of conserved SDH-loss master regulators in human tumors and MEFs implicated ZNF423, a known modulator of retinoic acid response in neuroblastoma. Subsequent functional analysis revealed a blunted cell death response to retinoic acid in SDH-loss MEFs and blunted differentiation response in SDH-inhibited SH-SY5Y neuroblastoma cells.

Conclusions: The unbiased analyses presented here nominate specific transcription factors that are likely drivers of oncogenic transcription in PPGL tumors. This information has the potential to be exploited for targeted therapy. Additionally, the observation that SDH loss or inhibition results in blunted retinoic acid response suggests a potential developmental etiology for this tumor subtype.

Keywords: Mastermind-like transcriptional coactivator 3; Paraganglioma; Pheochromocytoma; Retinoic acid; Succinate dehydrogenase; Transcription factor; Transcriptional network; von Hippel-Lindau.


Conflict of interest statement

The authors declare that they have no competing interests.

Figures

Fig. 1
Fig. 1
PPGL subtype-specific gene expression signatures. a Volcano plots highlighting genes identified in differential expression analysis as having absolute log2-fold change > 1.5 and adjusted p-value < 0.05. Comparisons for SDH-loss and VHL-loss are in reference to normal adrenal medulla. Comparison for MAML3 translocation is in reference to all other PPGL molecular subtypes. b Numbers of differentially-expressed genes detected for each PPGL subtype. c Venn diagram showing overlap of differentially-expressed genes detected in SDH-loss, VHL-loss, and MAML3 transcriptomic signatures. d Venn diagram showing overlap of MAML3 translocation gene expression signatures in PPGL tumors (TCGA-PCPG) and in neuroblastoma tumors
Fig. 2
Fig. 2
MRs of PPGL transcriptomic signatures. a x-y plots showing statistical significance (y-axis) and potential fraction of the input gene expression signature (x-axis) explained by the inferred MRs for each PPGL molecular subtype. b Hierarchical clustering analysis of all TFs sorted according to PPGL tumor regulon overlap. Highly co-regulated transcriptional subnetworks are indicated with numeric values. Annotations in red indicate the identities of putative MRs inferred for each PPGL molecular subtype. c Running cumulative MR-attributable fraction of SDH-loss, VHL-loss, and MAML3 translocation gene expression signatures. MRs are ranked in increasing order of MRA p-value. d Analysis of MR overlap between SDH-loss, VHL-loss, and MAML3 translocation PPGL subtypes for MRA performed on ARACNE inferred transcriptional networks trimmed with DPI tolerance of 0 and 0.05, respectively
Fig. 3
Fig. 3
Validation analysis of inferred PPGL subtype-specific MRs. a Validation analysis for SDH-loss MRs. Mean inferred regulon log2(fold-change) for discovery SDH-loss transcriptomic signature is shown on the x-axis. The same quantification performed for a SDH-loss transcriptomic signature derived from an independent PPGL cohort is shown on the y-axis. Regulon size (number of genes) is indicated by the relative size of the data points. b Validation analysis for VHL-loss MRs. Analysis method is the same as in panel (a). c Hierarchical clustering of discovery cohort PPGL specimen MR transcription factor activity profiles inferred by the VIPER algorithm. Color bars indicate specimen characteristics and MR type, as shown. d Hierarchical clustering of validation cohort specimen MR transcription factor activity profiles. Color bars indicate specimen characteristics, as shown. e EPAS1 activity for RET, NF1, SDHB, SDHC, SDHD, and VHL specimens in the validation cohort. f EPAS1 activity for discovery cohort normal adrenal medulla specimens and SDHB-null PPGL tumors annotated as “metastatic” or “non-malignant”. g EPAS1 activity of discovery cohort normal adrenal medulla specimens and SDHD-null PPGL tumors of the head and neck and those arising from abdomen and thorax
Fig. 4
Fig. 4
Analysis of conserved SDH-loss MRs. a Volcano plot showing SDHC-loss MEF transcriptomic signature. b SDHC-loss MEF MRs organized according to MR rank. c Venn diagram showing overlap of SDHC-loss MEF MRs and SDH-loss MRs inferred in PPGL human tumors. Green circle shows SDH-loss MRs inferred in the discovery cohort analysis. Red circle shows MRs inferred leveraging the validation cohort SDH-loss gene expression signature. Blue circle shows SDHC-loss iMEF MRs. Empiric p-value estimated by analysis of degree of overlap for iteratively-generated randomly-selected sets of TFs is shown. Putative conserved SDH-loss MRs are indicated. d Analysis of regulon log2(fold-change) for putative conserved SDH-loss MRs. Regulon expression change for human SDH-loss PPGL tumors is shown on the x-axis. Regulon expression change for SDHC-loss MEFs is shown on the y-axis. Average size of mouse and human regulons are indicated by the size of data points. e Hierarchical clustering of MEF samples based upon ZFP423 regulon gene expression patterns (Exp: SDHC knockout iMEF line; Ctl: hemizygous control iMEF line). f Hierarchical clustering of MEF samples based upon SOX11 regulon gene expression patterns (Exp: SDHC knockout iMEF line; Ctl: hemizygous control iMEF line). g Analysis of synergy between ZFP423 and other mouse TFs. Regulon expression for ZFP423 is indicated as the leftmost column. Regulon expression for the various other TFs are indicated as the rightmost column. Regulon expression for the subset of co-regulated genes are shown in the middle column. h Analysis of synergy between SOX11 and other mouse TFs. Method of representation is the same as in panel (g)
Fig. 5
Fig. 5
SOX11 immunostaining in SDHC-loss and control MEFs. a Representative immunostain images of stable SDHC-loss (Exp) and hemizygous control (Ctl) MEF lines. b Quantification of mean cellular SOX11 immunostain intensity using CellProfiler automated image analysis. Comparisons indicated by asterisks are statistically significant by a two-sided heteroscedastic t-test (p < 0.05)
Fig. 6
Fig. 6
Analysis of ZFP423 and retinoic acid effects in SDHC-loss MEFs. a Representative ZFP423 immunostain images of stable SDHC-loss (Exp) and hemizygous control (Ctl) MEF lines. b Analysis of ZFP423 mean cellular immunostain intensity using CellProfiler automated image analysis approach. c Analysis of ZFP423 subcellular localization using CellProfiler automated image analysis. d Relative RNA-seq gene expression quantification for known retinoic acid receptors and transcriptional co-activators. Comparisons indicated by asterisks are statistically significant by a two-sided heteroscedastic t-test (p < 0.05). e Alamar blue cell viability analysis following 6-d exposure of MEF cells to retinoic acid. f Relative RNA-seq gene expression quantification for Bcl2
Fig. 7
Fig. 7
Analysis of SDH inhibition effects upon retinoic acid-induced differentiation of SH-SY5Y neuroblastoma cells. a Representative confocal microscopy images of SH-SY5Y cells treated with SDH complex inhibitor diethyl malonate (DEM, 5 mM) and/or all-trans retinoic acid (ATRA, 12 μM), visualized with actin and DAPI staining. b Quantification of neurite lengths for individual cells obtained via automated image analysis in CellProfiler (N > 40 cells per condition,* Wilcox rank sum p-value <1E-4)

References

    1. Crona J, Delgado Verdugo A, Maharjan R, Stalberg P, Granberg D, Hellman P, Bjorklund P. Somatic mutations in H-RAS in sporadic pheochromocytoma and paraganglioma identified by exome sequencing. J Clin Endocrinol Metab. 2013;98(7):E1266–E1271. - PubMed
    1. Takahashi M, Ritz J, Cooper GM. Activation of a novel human transforming gene, ret, by DNA rearrangement. Cell. 1985;42(2):581–588. - PubMed
    1. Santoro M, Rosati R, Grieco M, Berlingieri MT, D'Amato GL, de Franciscis V, Fusco A. The ret proto-oncogene is consistently expressed in human pheochromocytomas and thyroid medullary carcinomas. Oncogene. 1990;5(10):1595–1598. - PubMed
    1. Wallace MR, Marchuk DA, Andersen LB, Letcher R, Odeh HM, Saulino AM, Fountain JW, Brereton A, Nicholson J, Mitchell AL, et al. Type 1 neurofibromatosis gene: identification of a large transcript disrupted in three NF1 patients. Science. 1990;249(4965):181–186. - PubMed
    1. Comino-Mendez I, Gracia-Aznarez FJ, Schiavi F, Landa I, Leandro-Garcia LJ, Leton R, Honrado E, Ramos-Medina R, Caronia D, Pita G, et al. Exome sequencing identifies MAX mutations as a cause of hereditary pheochromocytoma. Nat Genet. 2011;43(7):663–667. - PubMed

MeSH terms