Long non-coding RNA HOXB-AS3 promotes myeloid cell proliferation and its higher expression is an adverse prognostic marker in patients with acute myeloid leukemia and myelodysplastic syndrome
- PMID: 31234830
- PMCID: PMC6591843
- DOI: 10.1186/s12885-019-5822-y
Long non-coding RNA HOXB-AS3 promotes myeloid cell proliferation and its higher expression is an adverse prognostic marker in patients with acute myeloid leukemia and myelodysplastic syndrome
Abstract
Background: Long non-coding RNAs (lncRNAs) represent the majority of cellular transcripts and play pivotal roles in hematopoiesis. However, their clinical relevance in acute myeloid leukemia (AML) and myelodysplastic syndrome (MDS) remains largely unknown. Here, we investigated the functions of HOXB-AS3, a lncRNA located at human HOXB cluster, in the myeloid cells, and analyzed the prognostic significances in patients with AML and MDS.
Methods: shRNAs were used to downregulate HOXB-AS3 in the cell lines and the effect was evaluated by quantitative polymerase chain reaction. The proliferation of the cell lines was illustrated by proliferation and BrdU flow assays. Further, we retrospectively analyzed the HOXB-AS3 expression in 193 patients with AML and 157 with MDS by microarray analysis, and evaluated its clinical importance.
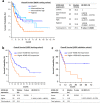
Results: Downregulation of HOXB-AS3 suppressed cell proliferation. Mechanistically, HOXB-AS3 potentiated the expressions of several key factors in cell cycle progression and DNA replication without affecting the expressions of HOX genes. In AML, patients with higher HOXB-AS3 expression had shorter survival than those with lower HOXB-AS3 expression (median overall survival (OS), 17.7 months versus not reached, P < 0.0001; median relapse-free survival, 12.9 months versus not reached, P = 0.0070). In MDS, patients with higher HOXB-AS3 expression also had adverse prognosis compared with those with lower HOXB-AS3 expression (median OS, 14.6 months versus 42.4 months, P = 0.0018). The prognostic significance of HOXB-AS3 expression was validated in the TCGA AML cohort and another MDS cohort from our institute. The subgroup analyses in MDS patients showed that higher HOXB-AS3 expressions could predict poor prognosis only in lower-risk (median OS, 29.2 months versus 77.3 months, P = 0.0194), but not higher-risk group.
Conclusions: This study uncovers a promoting role of HOXB-AS3 in myeloid malignancies and identifies the prognostic value of HOXB-AS3 expression in AML and MDS patients, particularly in the lower-risk group.
Keywords: Acute myeloid leukemia; HOXB-AS3; Myelodysplastic syndrome.
Conflict of interest statement
The authors declare that they have no competing interests.
Figures


Similar articles
-
Molecular leveraging of HOX-embedded non-coding RNAs in the progression of acute myeloid leukemia.Hum Cell. 2024 Nov 30;38(1):24. doi: 10.1007/s13577-024-01149-9. Hum Cell. 2024. PMID: 39614990 Review.
-
Alternative splicing of HOXB-AS3 underlie the promoting effect of nuclear m6A reader YTHDC1 on the self-renewal of leukemic stem cells in acute myeloid leukemia.Int J Biol Macromol. 2023 May 15;237:123990. doi: 10.1016/j.ijbiomac.2023.123990. Epub 2023 Mar 9. Int J Biol Macromol. 2023. PMID: 36906205
-
Long non-coding RNA taurine-upregulated gene 1 correlates with poor prognosis, induces cell proliferation, and represses cell apoptosis via targeting aurora kinase A in adult acute myeloid leukemia.Ann Hematol. 2018 Aug;97(8):1375-1389. doi: 10.1007/s00277-018-3315-8. Epub 2018 Apr 13. Ann Hematol. 2018. PMID: 29654398
-
Genomic loss of EZH2 leads to epigenetic modifications and overexpression of the HOX gene clusters in myelodysplastic syndrome.Oncotarget. 2016 Feb 16;7(7):8119-30. doi: 10.18632/oncotarget.6992. Oncotarget. 2016. PMID: 26812882 Free PMC article.
-
High Expression of Human Homologue of Murine Double Minute 4 and the Short Splicing Variant, HDM4-S, in Bone Marrow in Patients With Acute Myeloid Leukemia or Myelodysplastic Syndrome.Clin Lymphoma Myeloma Leuk. 2016 Aug;16 Suppl:S30-8. doi: 10.1016/j.clml.2016.03.012. Epub 2016 Apr 1. Clin Lymphoma Myeloma Leuk. 2016. PMID: 27155969 Review.
Cited by
-
LncRNA BC200/miR-150-5p/MYB positive feedback loop promotes the malignant proliferation of myelodysplastic syndrome.Cell Death Dis. 2022 Feb 8;13(2):126. doi: 10.1038/s41419-022-04578-2. Cell Death Dis. 2022. PMID: 35136029 Free PMC article.
-
The long non-coding RNA LOC285758 promotes invasion of acute myeloid leukemia cells by down-regulating miR-204-5p.FEBS Open Bio. 2020 May;10(5):734-743. doi: 10.1002/2211-5463.12814. Epub 2020 Mar 26. FEBS Open Bio. 2020. PMID: 32067385 Free PMC article.
-
Molecular leveraging of HOX-embedded non-coding RNAs in the progression of acute myeloid leukemia.Hum Cell. 2024 Nov 30;38(1):24. doi: 10.1007/s13577-024-01149-9. Hum Cell. 2024. PMID: 39614990 Review.
-
A heterozygous CEBPA mutation disrupting the bZIP domain in a RUNX1 and SRSF2 mutational background causes MDS disease progression.Nat Commun. 2025 Jul 1;16(1):5489. doi: 10.1038/s41467-025-60192-8. Nat Commun. 2025. PMID: 40593493 Free PMC article.
-
A concise review of the regulatory, diagnostic, and prognostic implications of HOXB-AS3 in tumors.J Cancer. 2024 Jan 1;15(3):714-728. doi: 10.7150/jca.91033. eCollection 2024. J Cancer. 2024. PMID: 38213732 Free PMC article. Review.
References
-
- Greenberg P, Cox C, LeBeau MM, Fenaux P, Morel P, Sanz G, et al. International scoring system for evaluating prognosis in myelodysplastic syndromes. Blood. 1997;89:2079–2088. - PubMed
-
- Voso MT, Fenu S, Latagliata R, Buccisano F, Piciocchi A, Aloe-Spiriti MA, et al. Revised international prognostic scoring system (IPSS) predicts survival and leukemic evolution of myelodysplastic syndromes significantly better than IPSS and WHO prognostic scoring system: validation by the Gruppo Romano Mielodisplasie Italian regional database. J Clin Oncol. 2013;31:2671–2677. doi: 10.1200/JCO.2012.48.0764. - DOI - PubMed
MeSH terms
Substances
LinkOut - more resources
Full Text Sources
Medical
Molecular Biology Databases
Research Materials
Miscellaneous

