. 2019 Jun 24;18(1):213.
doi: 10.1186/s12936-019-2846-3.

Malaria infection promotes a selective expression of kinin receptors in murine liver

Affiliations

Malaria infection promotes a selective expression of kinin receptors in murine liver

Priscilla D S Ventura et al. Malar J. .

Abstract

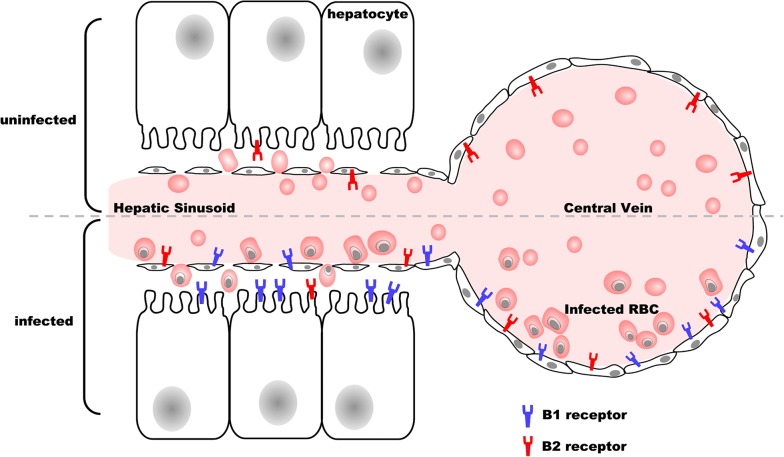
Background: Malaria represents a worldwide medical emergency affecting mainly poor areas. Plasmodium parasites during blood stages can release kinins to the extracellular space after internalization of host kininogen inside erythrocytes and these released peptides could represent an important mechanism in liver pathophysiology by activation of calcium signaling pathway in endothelial cells of vertebrate host. Receptors (B1 and B2) activated by kinins peptides are important elements for the control of haemodynamics in liver and its physiology. The aim of this study was to identify changes in the liver host responses (i.e. kinin receptors expression and localization) and the effect of ACE inhibition during malaria infection using a murine model.

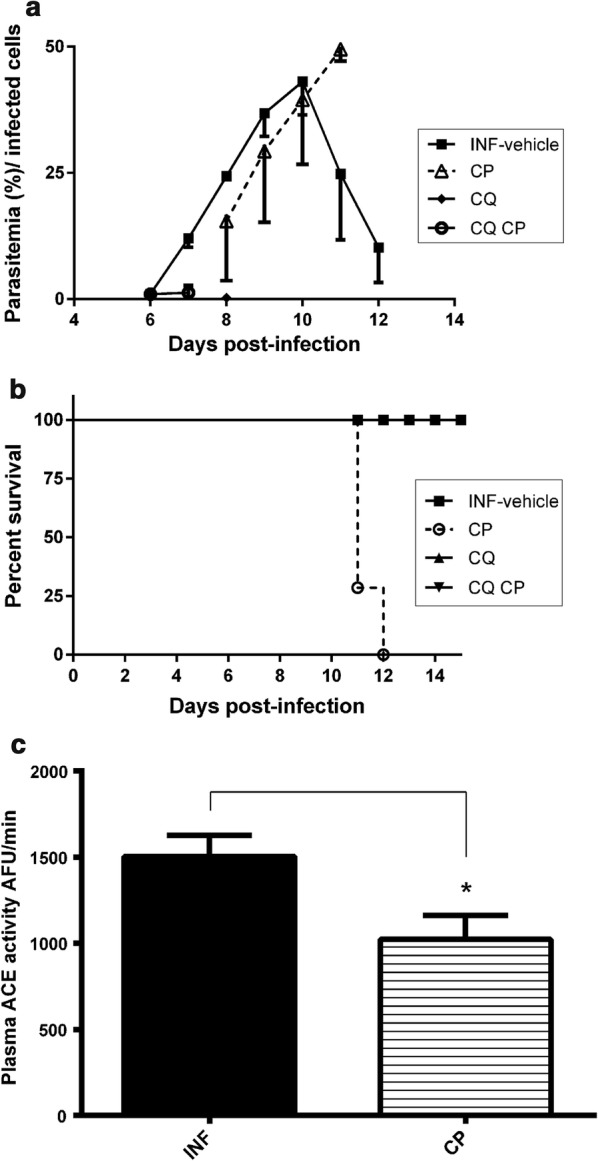
Methods: Balb/C mice infected by Plasmodium chabaudi were treated with captopril, an angiotensin I-converting enzyme (ACE) inhibitor, used alone or in association with the anti-malarial chloroquine in order to study the effect of ACE inhibition on mice survival and the activation of liver responses involving B1R and B2R signaling pathways. The kinin receptors (B1R and B2R) expression and localization was analysed in liver by western blotting and immunolocalization in different conditions.

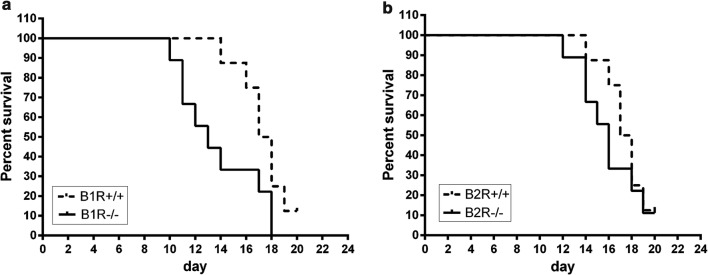
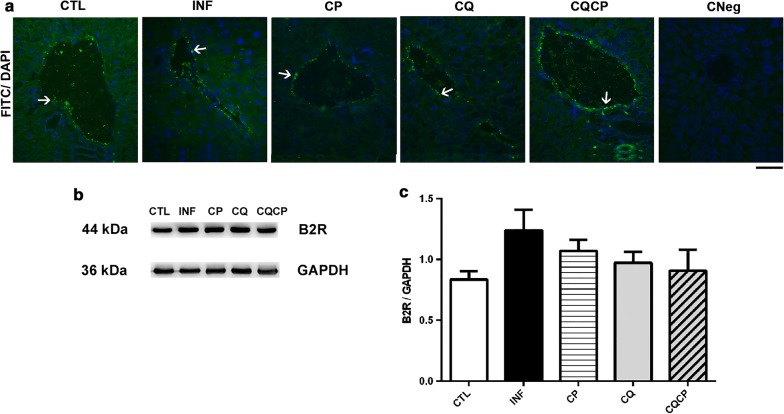
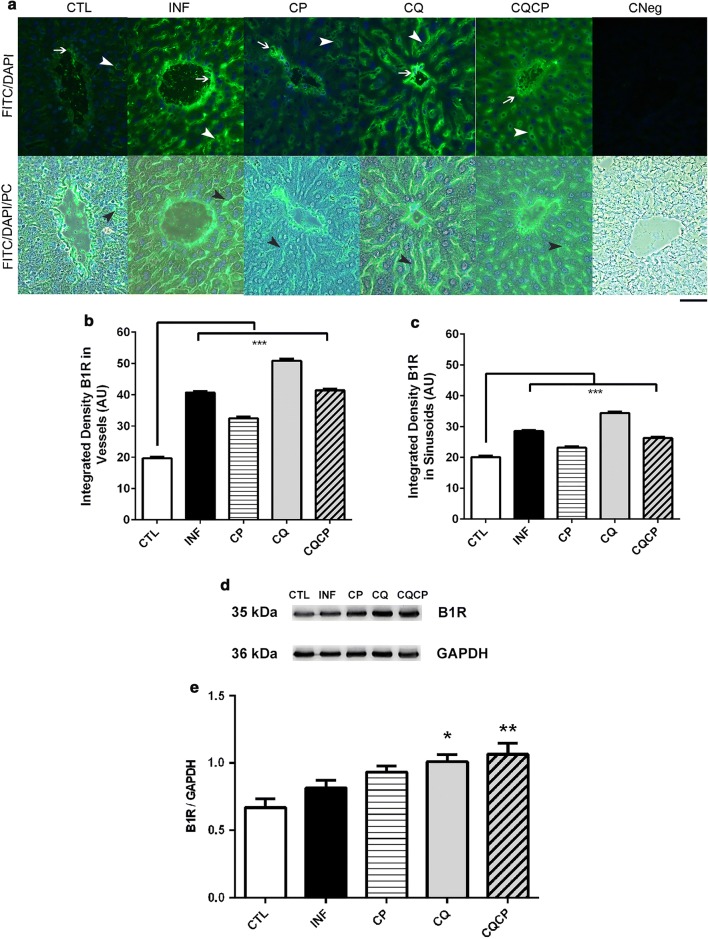
Results: It was verified that captopril treatment caused host death during the peak of malaria infection (parasitaemia about 45%). B1R expression was stimulated in endothelial cells of sinusoids and other blood vessels of mice liver infected by P. chabaudi. At the same time, it was also demonstrated that B1R knockout mice infected presented a significant reduction of survival. However, the infection did not alter the B2R levels and localization in liver blood vessels.

Conclusions: Thus, it was observed through in vivo studies that the vasodilation induced by plasma ACE inhibition increases mice mortality during P. chabaudi infection. Besides, it was also seen that the anti-malarial chloroquine causes changes in B1R expression in liver, even after days of parasite clearance. The differential expression of B1R and B2R in liver during malaria infection may have an important role in the disease pathophysiology and represents an issue for clinical treatments.

Keywords: Captopril; Kinin receptors; Liver; Malaria; Plasmodium.


Conflict of interest statement

The authors declare that they have no competing interests.

Figures

Fig. 1
Fig. 1
Plasmodium chabaudi parasitaemia in mice treated or not with captopril, chloroquine or both drugs (n = 6). a Blood parasitaemia of infected groups with vehicle solution (INF), captopril (CP), chloroquine (CQ), chloroquine and captopril association (CQ CP) (n = 6). b Survival curve of each animal group showed in A (n = 6). c ACE activity measured with Abz-FRK(Dnp)P-OH in blood plasma from mice of infected groups with vehicle solution (INF) or treated with CP. (n = 3). One-way ANOVA with multiple comparison post-test of Bonferroni’s; *p < 0.05, compared with the respective control of treatment (INF, without CP)
Fig. 2
Fig. 2
Survival of bradykinin receptor B1 and B2 knockout mice infected by Plasmodium chabaudi. Each group (knockout and wild type) consisted of C57BL6 (n = 8) infected i.p. with 103 iRBC. a Survival curve of B1 receptor knockout mice vs wild type infected mice (p < 0.05). b Survival curve of B2 receptor knockout mice vs wild type infected mice (p > 0.05; ns). The statistical significance of difference between control and experimental groups was determined with the Log-Rank test for the cumulative survival experiments
Fig. 3
Fig. 3
B2 kinin receptor expression in liver of uninfected and infected mice by Plasmodium chabaudi. a Cellular location of B2 kinin receptor in liver of uninfected group (CLT) and infected-treated with 0.9% NaCl (INF), captopril (CP), chloroquine (CQ) or chloroquine and captopril association (CQCP). Negative control (CNeg) was performed in liver of control mice. The white arrows indicate B2R staining in vessel walls (green). b, c Expression of B2R determined in liver homogenate by western blotting and respective densitometric quantification of immunoreactive bands for B2R immunoblottings (c). All values were normalized by GAPDH bands (36 kDa, internal control). n = 5 for B2R mean ± SEM
Fig. 4
Fig. 4
B1 kinin receptor expression in liver of mice infected with Plasmodium chabaudi. a Immunofluorescence of B1 receptor (green) in liver tissue. The white arrows indicate the B1R immunostaining in blood vessels, and the arrowheads (black or white) show the sinusoidal spaces. Semi-quantitative analysis of B1R density in vessels (b) and sinusoids (c). DNA fluorescence (DAPI/blue) and phase contrast (PC). n = 3/4 mice per group. Kruskal–Wallis with multiple comparison post-test of Dunn’s; ***p < 0.0001. d, e Densitometric quantification of bands for B1R. The values represent mean ± SEM (n = 4); One-way ANOVA test with post-test of Bonferroni’s *p < 0.05 and **p < 0.001 compared with CTL
Fig. 5
Fig. 5
Schematic model of kinin receptors distribution in the liver cells during murine malaria infection. Immunolocalization B1 and B2 receptors in mouse liver uninfected and infected with P. chabaudi from the results obtained at peak infection

References

    1. Cowman AF, Berry D, Baum J. The cellular and molecular basis for malaria parasite invasion of the human red blood cell. J Cell Biol. 2012;198:961–971. doi: 10.1083/jcb.201206112. - DOI - PMC - PubMed
    1. Paul AS, Egan ES, Duraisingh MMT. Host–parasite interactions that guide red blood cell invasion by malaria parasites. Curr Opin Hematol. 2015;22:200–226. doi: 10.1097/MOH.0000000000000135. - DOI - PMC - PubMed
    1. Miller LH, Ackerman HC, Su X, Wellems TE. Malaria biology and disease pathogenesis: insights for new treatments. Nat Med. 2013;19:156–167. doi: 10.1038/nm.3073. - DOI - PMC - PubMed
    1. Moxon CA, Grau GE, Craig AG. Malaria: modification of the red blood cell and consequences in the human host. Br J Haematol. 2011;154:670–679. doi: 10.1111/j.1365-2141.2011.08755.x. - DOI - PMC - PubMed
    1. Beraldo FH, Almeida FM, da Silva AM, Garcia CRS. Cyclic AMP and calcium interplay as second messengers in melatonin-dependent regulation of Plasmodium falciparum cell cycle. J Cell Biol. 2005;170:551–557. doi: 10.1083/jcb.200505117. - DOI - PMC - PubMed

MeSH terms