. 2019 Sep:28:100348.
doi: 10.1016/j.epidem.2019.100348. Epub 2019 Jun 12.

School dismissal as a pandemic influenza response: When, where and for how long?

Affiliations

School dismissal as a pandemic influenza response: When, where and for how long?

Timothy C Germann et al. Epidemics. 2019 Sep.

Abstract

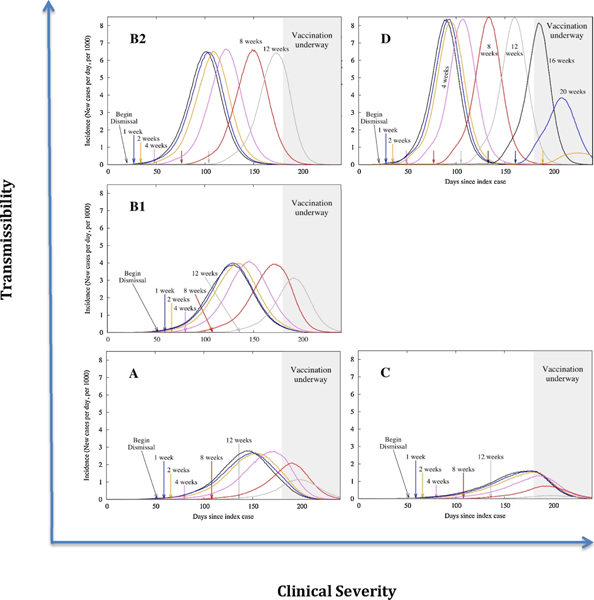
We used individual-based computer simulation models at community, regional and national levels to evaluate the likely impact of coordinated pre-emptive school dismissal policies during an influenza pandemic. Such policies involve three key decisions: when, over what geographical scale, and how long to keep schools closed. Our evaluation includes uncertainty and sensitivity analyses, as well as model output uncertainties arising from variability in serial intervals and presumed modifications of social contacts during school dismissal periods. During the period before vaccines become widely available, school dismissals are particularly effective in delaying the epidemic peak, typically by 4-6 days for each additional week of dismissal. Assuming the surveillance is able to correctly and promptly diagnose at least 5-10% of symptomatic individuals within the jurisdiction, dismissals at the city or county level yield the greatest reduction in disease incidence for a given dismissal duration for all but the most severe pandemic scenarios considered here. Broader (multi-county) dismissals should be considered for the most severe and fast-spreading (1918-like) pandemics, in which multi-month closures may be necessary to delay the epidemic peak sufficiently to allow for vaccines to be implemented.

Keywords: EpiCast; Pandemic influenza; School dismissal; Stochastic individual-based model.


Figures

Fig. 1.
Fig. 1.
Effect of school dismissal duration upon epidemic curves for simultaneous (region-wide) school dismissal for the regional model (the Chicago metropolitan area, with 8.6 M people). Results are shown for the shorter serial interval and nominal (worst-case) contact rate changes upon dismissal, activated when 20 children are symptomatic in a community (i.e., closure upon the first diagnosed case if the diagnosis ratio is 5%). Results are shown for five pandemic scenarios: four historically referenced 20th century influenza pandemics (A: 2009, B1:1968, B2: 1957, D: 1918) and a fifth scenario (C) that corresponds to a clinically severe but less transmissible pandemic.
Fig. 2.
Fig. 2.
U.S. model predictions of the number of (symptomatic) influenza cases averted by a combination of self-isolation, school dismissals, and vaccination, for the shorter serial interval. School dismissal is activated when one symptomatic child is diagnosed at an assumed diagnosis ratio of 5%, 10%, or 20%. Two alternative assumptions for contact rates (CR) during school dismissal are considered: “worst-case” (filled bars: CR involving children in households are doubled and child-related contacts outside the home are reduced by 30%) and “best-case” (extensions: CR involving children in households are unchanged, and child-related contacts outside the home are reduced by 50%). Beginning on day 180, 1 million people per day are vaccinated (see text and SI for details).
Fig. 3.
Fig. 3.
U.S. model results for pandemic scenarios B2 (left panels) and D (right panels). School dismissal activated when 20 children are symptomatic (closure upon first diagnosed at a 5% diagnosis ratio) and a 4-week duration, for the shorter serial interval. (Top) Epidemic curves. (Bottom) Number of schools closed at any time during the outbreak. The “worst- case” assumption for contact rates during school dismissal is used (contact rates involving children in households are doubled, and child-related contacts outside the home are reduced by 30%). Analogous results for the “best-case” contact rates are shown in Fig. S6. Beginning on day 180, 1 million people per day are vaccinated (see text and SI for details). Note that for scenario D, the multi-county and state-wide dismissals are virtually indistinguishable, particularly for the epidemic curves.

References

    1. Biggerstaff M, Jhung M, Kamimoto L, Balluz L, Finelli L, 2012. Self-reported influenza-like illness and receipt of influenza antiviral drugs during the 2009 pandemic, United States, 2009–2010. Am. J. Public Health 102, e21. - PMC - PubMed
    1. Biggerstaff M, et al., 2015. Estimating the potential effects of a vaccine program against an emerging influenza pandemic—united States. Clin. Infect. Dis. 60 (suppl 1), S20–S29. - PMC - PubMed
    1. Blower SM, Dowlatabadi H, 1994. Sensitivity and uncertainty analysis of complex-models of disease transmission – an HIV model, as an example. Int. Stat. Review 62, 229–243.
    1. Brown ST, et al., 2011. Would school closure for the 2009 H1N1 influenza epidemic have been worth the cost?: a computational simulation of Pennsylvania. BMC Public Health 11 (353). - PMC - PubMed
    1. Carrasco LR, Jit M, Chen MI, Lee VJ, Milne GJ, Cook AR, 2013. Trends in parameterization, economics and host behaviour in influenza pandemic modelling: a review and reporting protocol. Emerg. Themes Epi. 10, 3. - PMC - PubMed

Publication types

Substances