. 2019 Aug 16;294(33):12380-12391.
doi: 10.1074/jbc.RA119.008680. Epub 2019 Jun 24.

Mitochondrial fatty acid oxidation and the electron transport chain comprise a multifunctional mitochondrial protein complex

Affiliations

Mitochondrial fatty acid oxidation and the electron transport chain comprise a multifunctional mitochondrial protein complex

Yudong Wang et al. J Biol Chem. .

Abstract

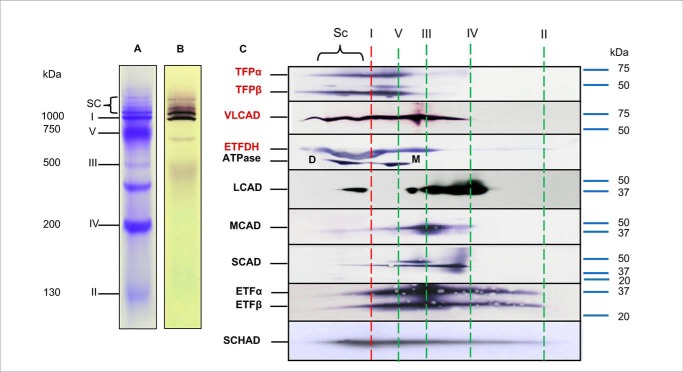
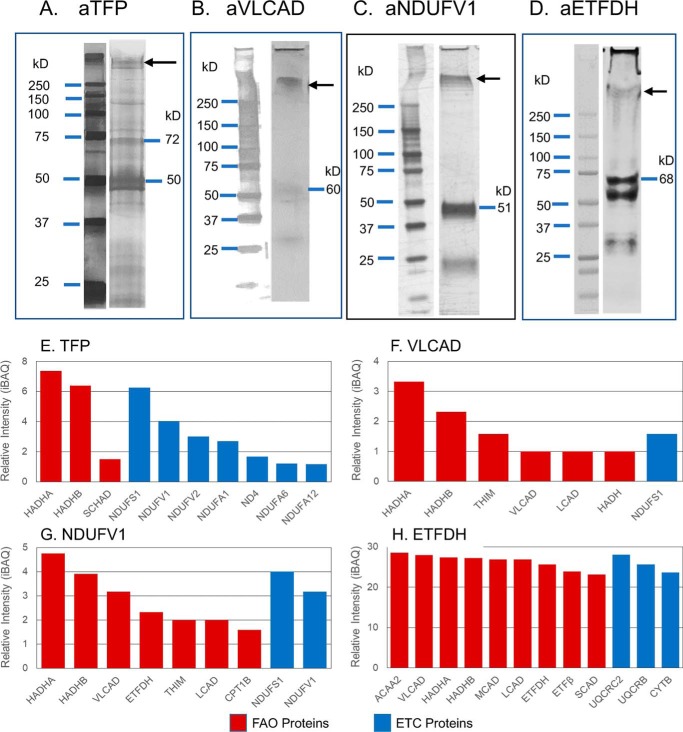
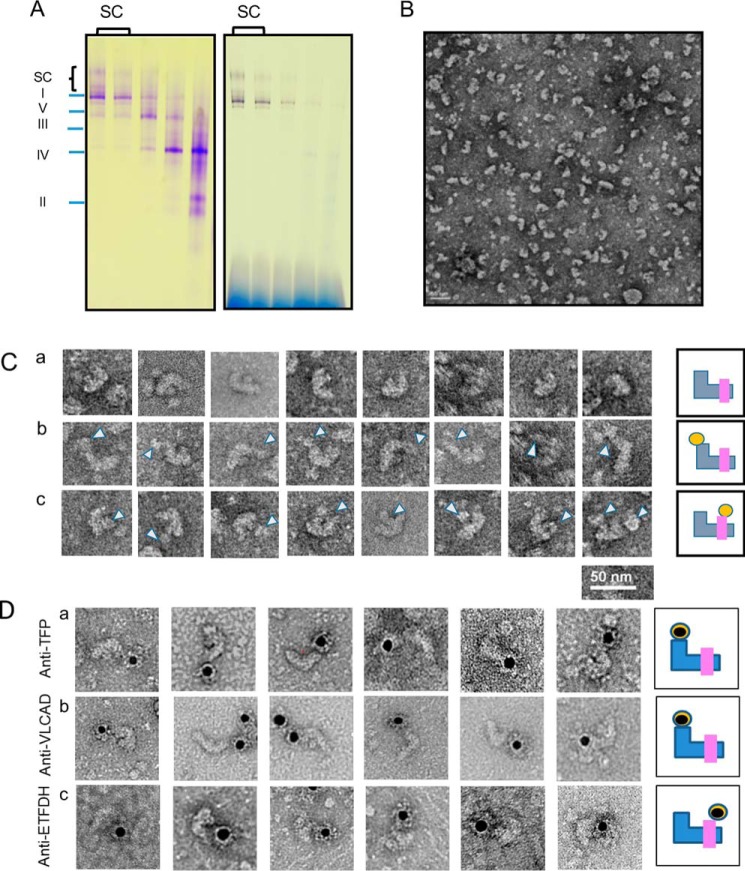
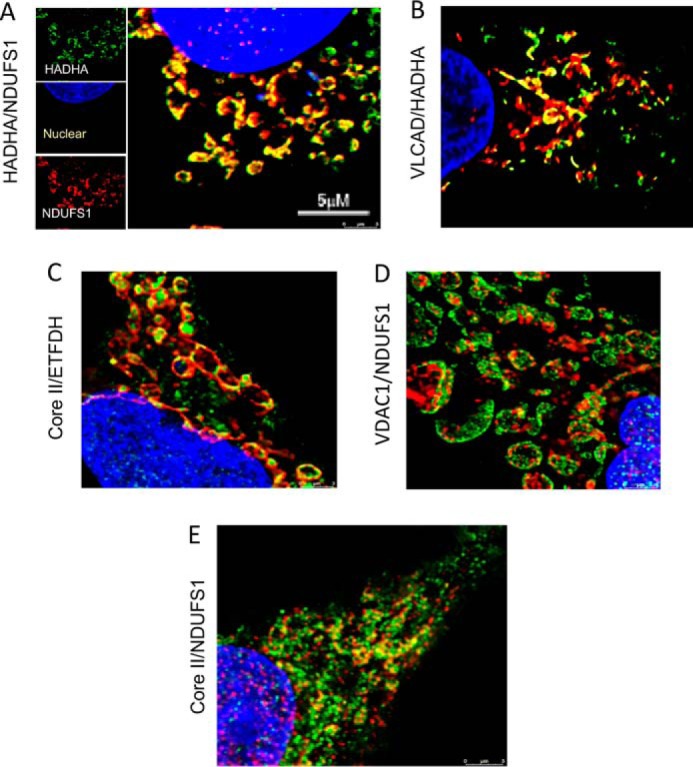
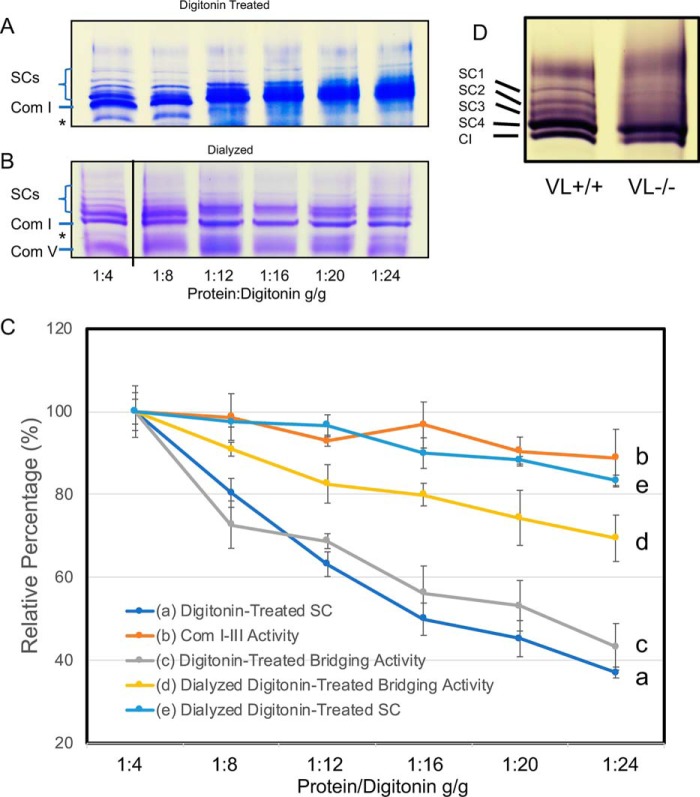
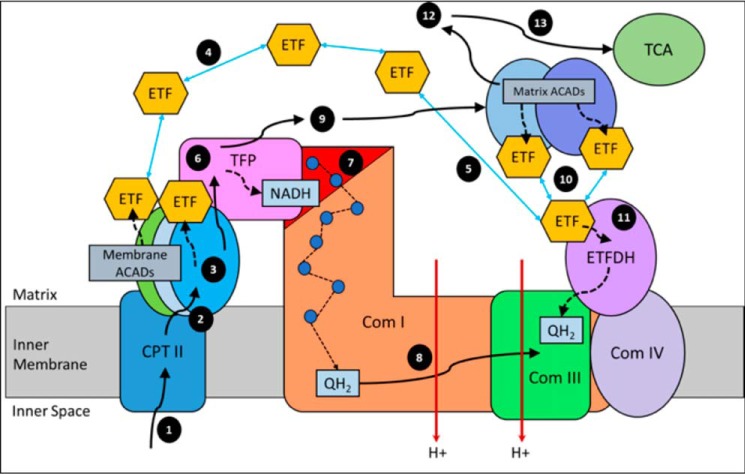
Three mitochondrial metabolic pathways are required for efficient energy production in eukaryotic cells: the electron transfer chain (ETC), fatty acid β-oxidation (FAO), and the tricarboxylic acid cycle. The ETC is organized into inner mitochondrial membrane supercomplexes that promote substrate channeling and catalytic efficiency. Although previous studies have suggested functional interaction between FAO and the ETC, their physical interaction has never been demonstrated. In this study, using blue native gel and two-dimensional electrophoreses, nano-LC-MS/MS, immunogold EM, and stimulated emission depletion microscopy, we show that FAO enzymes physically interact with ETC supercomplexes at two points. We found that the FAO trifunctional protein (TFP) interacts with the NADH-binding domain of complex I of the ETC, whereas the electron transfer enzyme flavoprotein dehydrogenase interacts with ETC complex III. Moreover, the FAO enzyme very-long-chain acyl-CoA dehydrogenase physically interacted with TFP, thereby creating a multifunctional energy protein complex. These findings provide a first view of an integrated molecular architecture for the major energy-generating pathways in mitochondria that ensures the safe transfer of unstable reducing equivalents from FAO to the ETC. They also offer insight into clinical ramifications for individuals with genetic defects in these pathways.

Keywords: electron microscopy (EM); fatty acid oxidation; mitochondrial metabolism; mitochondrial respiratory chain complex; primary metabolism; protein structure; proteomics; stimulated emission depletion microscopy (STED); supercomplex; trifunctional protein (TFP).


Conflict of interest statement

The authors declare that they have no conflicts of interest with the contents of this article

Figures

Figure 1.
Figure 1.
Interaction of FAO enzymes with ETC supercomplexes. Mouse heart mitochondria were treated with digitonin and analyzed using BN and a second dimension of SDS-PAGE. A, Coomassie Blue-stained BN-PAGE shows multiple ET-related bands: supercomplexes (SCs); complex I (∼1,000 kDa); complex V (∼750 kDa); complex III (∼500 kDa); complex IV (∼200 kDa); and complex II (∼130 kDa). B, in-gel enzyme activity stain shows that both the isolated complex I and the SC bands have complex I activity. C, two-dimensional separation of mitochondrial proteins. BN-PAGE was followed by SDS-PAGE and then Western blotting with antibodies against FAO enzymes, including TFP, VLCAD, ETFDH, LCAD, MACD, SCAD, ETF, and SCHAD. Anti-ATPase antibody was used as a marker to reference the locations of the other protein. The ATPase dimer is labeled as D, and the monomer as M, which serves as the low molecular mass boundary of the SCs. The position of molecular mass markers on the full gel is shown to the right of C. Long-chain FAO proteins are seen to distribute in the high-molecular-mass portion of the BN gel rather than in the region corresponding to each isolated protein. The vertical red dashed lines indicate the locations of individual ETC complexes on BN-PAGE as shown in A.
Figure 2.
Figure 2.
MCAD activity in solubilized mitochondria after sucrose density centrifugation. The lowest numbered fractions are the densest. Digitonin-treated rat heart mitochondria were separated by sucrose gradient centrifugation and divided into 12 fractions. SCs were mainly distributed in the first four (highest density) fractions (see Fig. 5, A and B). The graph shows the distribution of oxidation of C8CoA (MCAD substrate). The distribution of MCAD activity is highest in the middle gradient fractions, representing isolated homotetramers. However, a significant amount of activity still associates in the highest molecular mass fractions (lowest gradient numbers) containing the ETC supercomplexes. In contrast, most VLCAD activity has previously been shown to associate with the high-molecular mass fractions (3).
Figure 3.
Figure 3.
Fatty acid oxidation proteins are associated with those of ETC. WT mouse heart mitochondria were solubilized and separated on a sucrose gradient, and high-molecular mass fractions containing the ETC supercomplexes were collected and analyzed for proteins by MS. A, MS identified 41 complex I subunits, the most abundant of which were NDUFA4, NDUFS6, and NDUFA8. None of the NADH-binding domain subunits were identified. Seven complex III subunits were also seen. B, MS analysis of the high-molecular mass sucrose gradient fractions of solubilized mitochondria from three tissues also identified 12 FAO enzymes. The full list of identified proteins can be found in Tables S1–S4.
Figure 4.
Figure 4.
Mass spectrometry analysis of proteins isolated by co-immunoprecipitation from mouse heart mitochondria treated with protein cross-linking agents. Rat heart mitochondria were incubated with the chemical cross-linker EGS, incubated with an anti-TFP, anti-VLCAD, anti-ETFDH, or anti-ETFDH antibody. The cross-linked products were co-immunoprecipitated using protein A–Sepharose 4B, followed by SDS-PAGE separation, in-gel protein digest, and MS analysis. A–D, Western blottings of the SDS-polyacrylamide gels with the indicated antisera identified larger molecular mass bands consistent with other proteins cross-linked to the primary antigen as seen to the right of A–D. The region of the SDS-polyacrylamide gel corresponding to that indicated by the arrows was cut from the gel and subjected to MS analysis. E–H, proteins identified by MS analysis of high-molecular mass bands from SDS-PAGE of cross-linked samples. Red bars represent FAO proteins, and blue bars represent ETC proteins. E, co-immunoprecipitation with anti-TFP antibody identified three complex I NADH-binding domain subunits. F, treatment with anti-VLCAD antibody also precipitated HADHA and HADHB subunits and ETC complex I subunit, NDUFS1, one of the NADH-binding domain subunits seen to bind to TFP. G, precipitation with an anti-NDUFV1 antibody precipitated HADHA and HADHB and NDUFS1 subunit of complex I. H, treatment with anti-ETFDH antibody precipitated one complex III subunit, core II, plus numerous membrane and matrix-associated FAO proteins (HADHA, HADHB, and VLCAD), along with other acyl-CoA dehydrogenases and ETF subunits.
Figure 5.
Figure 5.
EM visualization of rat heart mitochondria FAO–ETC protein complexes. A, FAO–digitonin-permeabilized rat heart mitochondria were separated by a sucrose gradient centrifugation, and the gradient fractions were analyzed by BN-PAGE. The left panel shows a protein stain of the gel, and the right panel shows a complex I activity stain. The complex I and supercomplex fractions of the sucrose gradient were combined for EM analysis. B, EM grid with negative staining shows that there are variable forms of SC particles. C, panel a, particles are the main supercomplex form identified, representing one molecule each of complexes I, III, and IV. Panel b, additional particle binds on top of the short arm of complex I in some particles (as indicated by arrowheads). Panel c, extra particle also is seen binding to the top of complex III. In the final image in this row, both extra masses are seen simultaneously with the short (matrix) arm of complex I and the top of complex III (as indicated by arrowheads). Schematics to the right of each image stylize the three types of association with blue representing complex I; pink representing complex III; and orange representing complex IV. D, gold-labeled antisera as indicated to the left of the figure were incubated with supercomplexes on EM grids and then imaged. The black dots are the gold particles, and a summary of each set of binding experiments is cartooned to the right of the images.
Figure 6.
Figure 6.
STED imaging of HEPG2 cells. Cells grown in monolayers were separately decorated with different pairs of primary antibodies with either a red or green fluorometric label. The target protein pairs of antibodies include rabbit anti-HADHA/mouse anti-NDUFS1 (A), rabbit anti-HADHA/mouse anti-VLCAD (B), and rabbit anti-core II/mouse anti-ETFDH (C). As negative control, cells were treated with the antibody pair rabbit anti-VDAC1/mouse anti-NDUFS1 (D). Antibodies to core II and NDUFS1 served as an internal collaboration showing results for a known molecular distance of 15–20 nm (E). Nuclei were stained with DAPI. A, three images on the left show the individual color signals for anti-HADHA (green), NDUFS1 (green), and DAPI (blue). The large image is the merged image with overlapping signals shown as yellow. B–E, each panel shows only the merged image of each pair of antibody pairs.
Figure 7.
Figure 7.
Functional studies of rat mitochondrial FAO–ETC complexes. A, BNGE of mitochondrial samples treated with increasing concentrations of digitonin (as per the x axis of C). Com I, ETC complex I. Only the top portion of the gel containing the SCs and complex I is shown. The band immediately below Com I is nonspecific and present in all samples regardless of treatment. B, samples as in A were dialyzed to remove the digitonin and then analyzed by BNGE. Samples are arranged as in A. Note that the 1:4 dilution slot was electronically spliced to be next to the remaining slots on the same gel. C, functional assays of rat mitochondrial samples treated with digitonin. Yellow (line d): linked ETC complex I to III assay. Gray (line c): linked FAO–ETC assay of dialyzed digitonin-treated samples. Orange (line b): linked enzymatic assays of rat mitochondrial samples. Dark blue (line a): densitometric tracing of the supercomplex bands on the blue native gel shown in A; and light blue (line e): samples from a dialyzed to remove digitonin. The y axis shows the percent of each respective measurement compared with the 1:4 sample. The x axis shows the protein/digitonin ratio. D, complex I activity gel stain of BNGE of digitonin-treated heart mitochondria isolated from wild type (WT) and VLCAD-deficient mice (VL−). Supercomplex 1–3 bands are missing in the VLCAD-deficient mitochondria. SC1–4, supercomplex bands. CI, ETC complex I.
Figure 8.
Figure 8.
Working model of fatty acid oxidation and respiratory chain protein interactions. See text for description.

References

    1. Vockley J., Bennett M. J., and Gillingham M. B. (2016) in The Online Metabolic and Molecular Bases of Inherited Disease (Beaudet A. L., Vogelstein B., Kinzler K. W., Antonarakis S. E., Ballabio A., Gibson K. M., and Mitchell G., eds) McGraw-Hill Co., Inc., New York
    1. Longo N., Frigeni M., and Pasquali M. (2016) Carnitine transport and fatty acid oxidation. Biochim. Biophys. Acta 1863, 2422–2435 10.1016/j.bbamcr.2016.01.023 - DOI - PMC - PubMed
    1. Wang Y., Mohsen A. W., Mihalik S. J., Goetzman E. S., and Vockley J. (2010) Evidence for physical association of mitochondrial fatty acid oxidation and oxidative phosphorylation complexes. J. Biol. Chem. 285, 29834–29841 10.1074/jbc.M110.139493 - DOI - PMC - PubMed
    1. Liang K., Li N., Wang X., Dai J., Liu P., Wang C., Chen X. W., Gao N., and Xiao J. (2018) Cryo-EM structure of human mitochondrial trifunctional protein. Proc. Natl. Acad. Sci. U.S.A. 115, 7039–7044 10.1073/pnas.1801252115 - DOI - PMC - PubMed
    1. McAndrew R. P., Wang Y., Mohsen A. W., He M., Vockley J., and Kim J. J. (2008) Structural basis for substrate fatty acyl chain specificity: crystal structure of human very-long-chain acyl-CoA dehydrogenase. J. Biol. Chem. 283, 9435–9443 10.1074/jbc.M709135200 - DOI - PMC - PubMed

Publication types