. 2019 Sep 6;201(19):e00321-19.
doi: 10.1128/JB.00321-19. Print 2019 Oct 1.

Expansion of the Spore Surface Polysaccharide Layer in Bacillus subtilis by Deletion of Genes Encoding Glycosyltransferases and Glucose Modification Enzymes

Affiliations

Expansion of the Spore Surface Polysaccharide Layer in Bacillus subtilis by Deletion of Genes Encoding Glycosyltransferases and Glucose Modification Enzymes

Bentley Shuster et al. J Bacteriol. .

Abstract

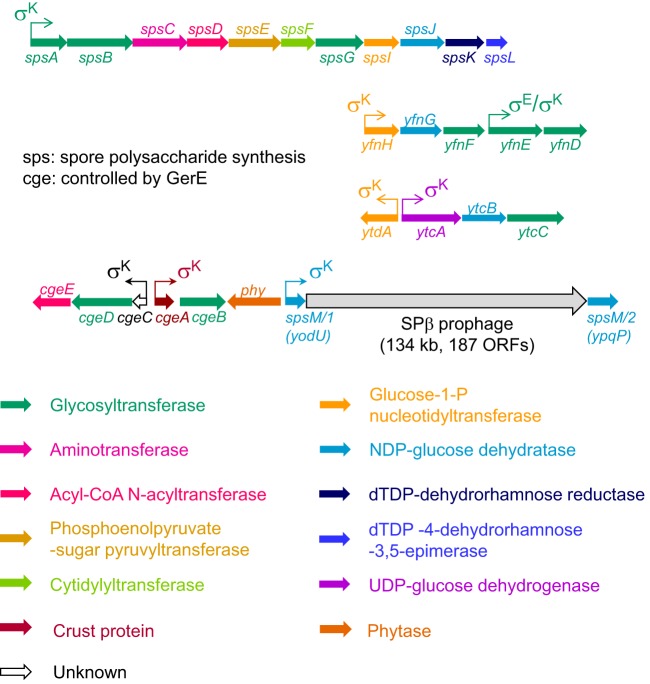
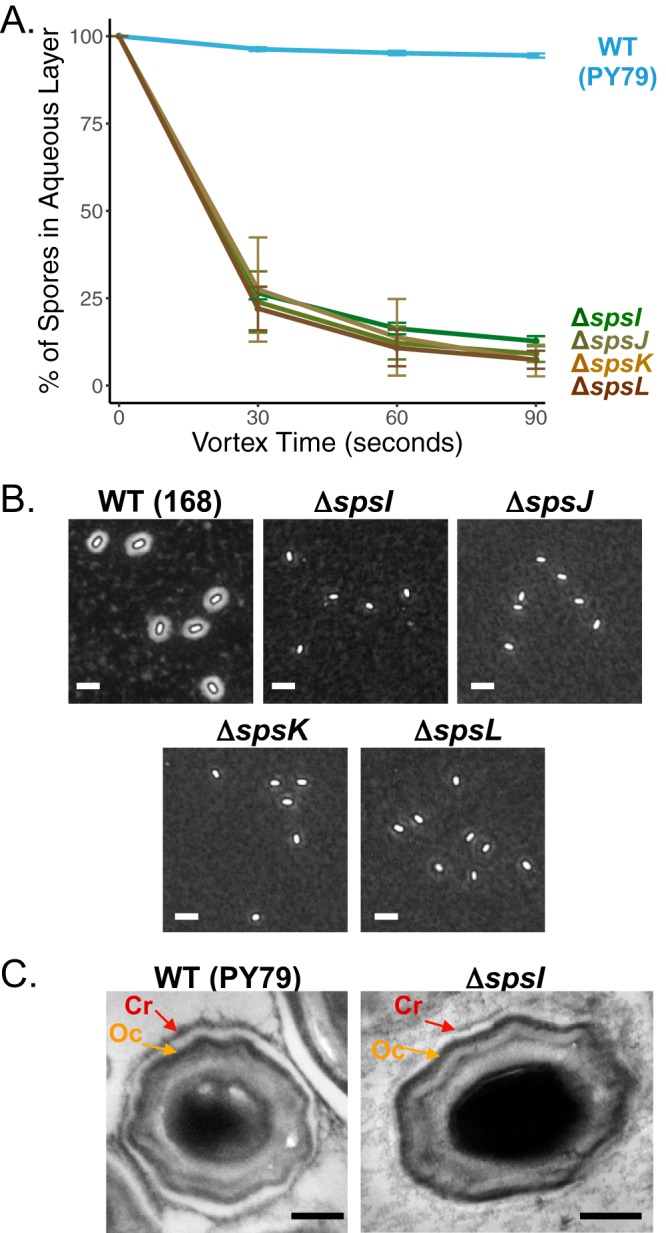
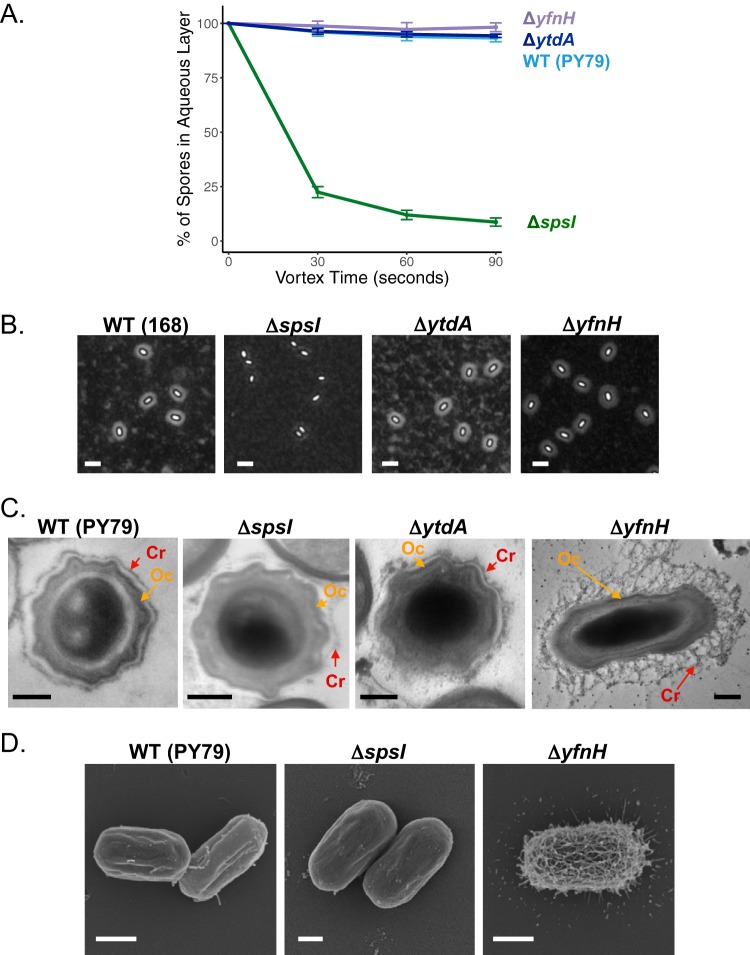
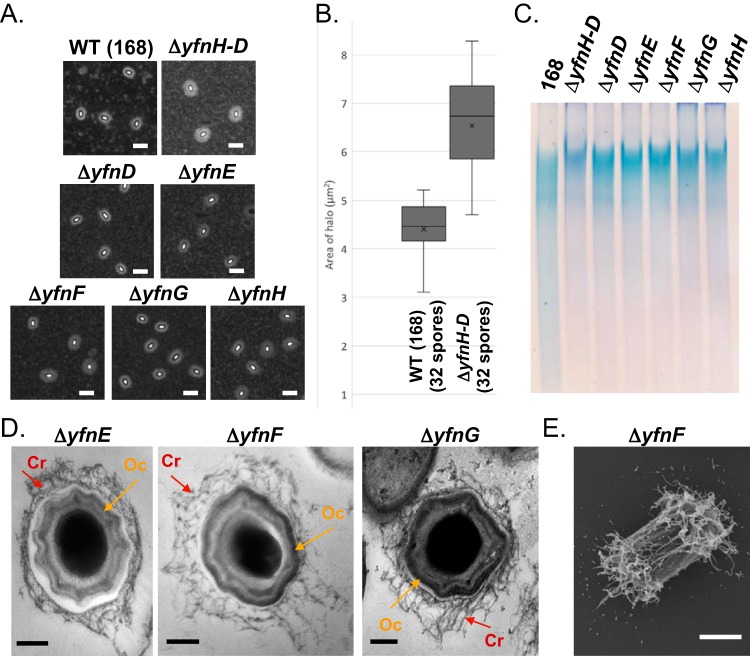
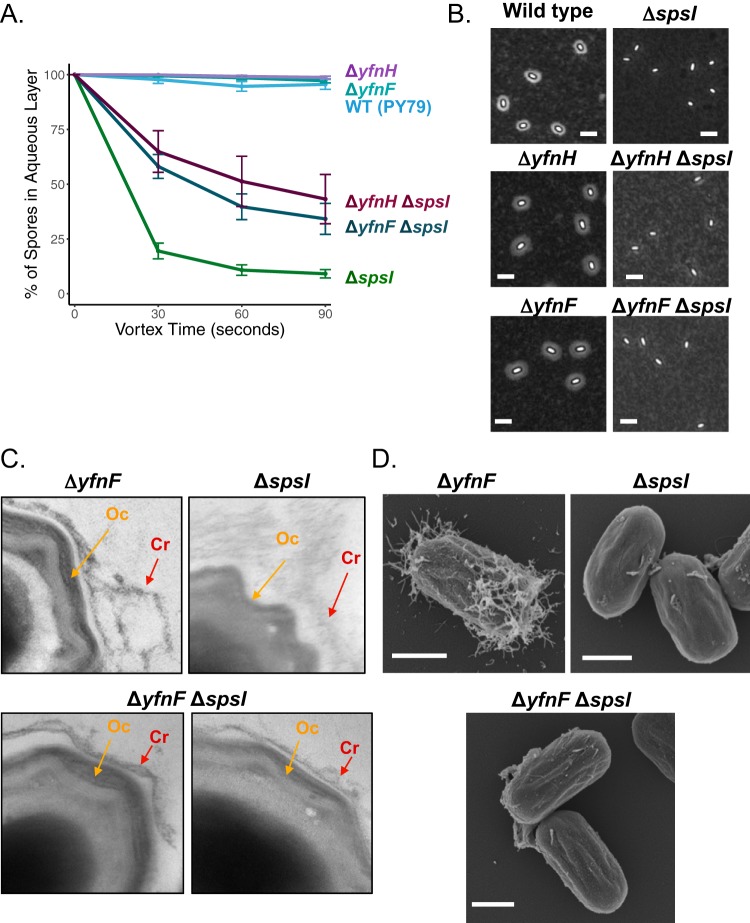
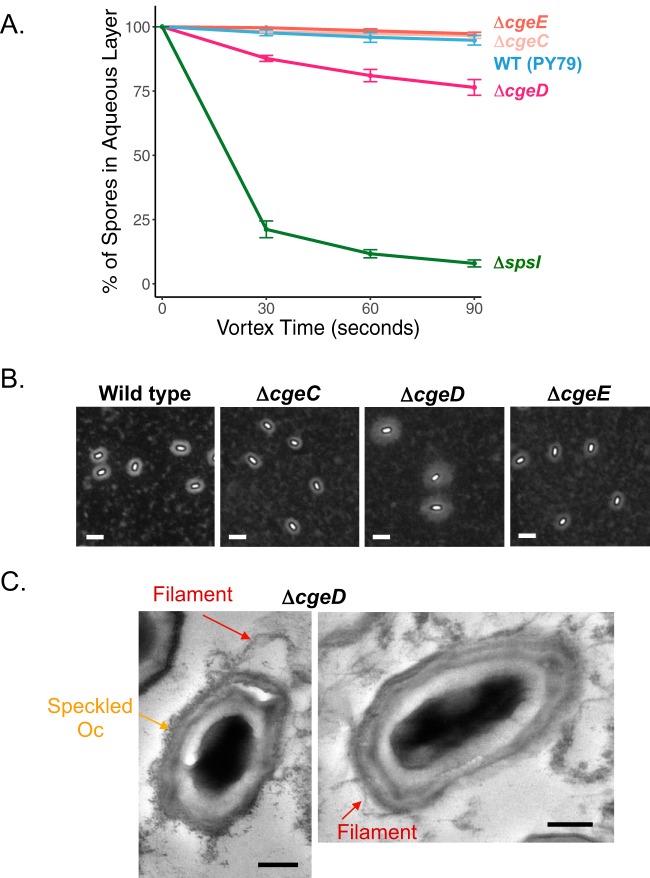
Polysaccharides (PS) decorate the surface of dormant endospores (spores). In the model organism for sporulation, Bacillus subtilis, the composition of the spore PS is not known in detail. Here, we have assessed how PS synthesis enzymes produced during the late stages of sporulation affect spore surface properties. Using four methods, bacterial adhesion to hydrocarbons (BATH) assays, India ink staining, transmission electron microscopy (TEM) with ruthenium red staining, and scanning electron microscopy (SEM), we characterized the contributions of four sporulation gene clusters, spsABCDEFGHIJKL, yfnHGF-yfnED, ytdA-ytcABC, and cgeAB-cgeCDE, on the morphology and properties of the crust, the outermost spore layer. Our results show that all mutations in the sps operon result in the production of spores that are more hydrophobic and lack a visible crust, presumably because of reduced PS deposition, while mutations in cgeD and the yfnH-D cluster noticeably expand the PS layer. In addition, yfnH-D mutant spores exhibit a crust with an unusual weblike morphology. The hydrophobic phenotype from sps mutant spores was partially rescued by a second mutation inactivating any gene in the yfnHGF operon. While spsI, yfnH, and ytdA are paralogous genes, all encoding glucose-1-phosphate nucleotidyltransferases, each paralog appears to contribute in a distinct manner to the spore PS. Our data are consistent with the possibility that each gene cluster is responsible for the production of its own respective deoxyhexose. In summary, we found that disruptions to the PS layer modify spore surface hydrophobicity and that there are multiple saccharide synthesis pathways involved in spore surface properties.IMPORTANCE Many bacteria are characterized by their ability to form highly resistant spores. The dormant spore state allows these species to survive even the harshest treatments with antimicrobial agents. Spore surface properties are particularly relevant because they influence spore dispersal in various habitats from natural to human-made environments. The spore surface in Bacillus subtilis (crust) is composed of a combination of proteins and polysaccharides. By inactivating the enzymes responsible for the synthesis of spore polysaccharides, we can assess how spore surface properties such as hydrophobicity are modulated by the addition of specific carbohydrates. Our findings indicate that several sporulation gene clusters are responsible for the assembly and allocation of surface polysaccharides. Similar mechanisms could be modulating the dispersal of infectious spore-forming bacteria.

Keywords: Bacillus subtilis; cell surface; polysaccharides; spore coat; spore crust; sporulation.


Figures

FIG 1
FIG 1
Gene clusters involved in spore polysaccharide synthesis. Chromosomal regions encoding enzymes involved in spore PS synthesis in B. subtilis are shown. Arrows for each gene signal the transcriptional direction and the colors are associated with respective gene functions. Promoter locations and sporulation σ factor dependencies for each operon are also indicated with arrows (43, 45). Several of these operons have been partially characterized. The last four genes of the spsA–L operon are involved in rhamnose synthesis (8). The spsM gene (interrupted by the SPβ prophage, which is excised from the mother cell genome during sporulation) is also known to be necessary for spore PS synthesis (23). The cgeAB operon encodes a protein component of the spore crust (CgeA) and a putative glycosyltransferase (CgeB) (20, 40). The glucose-1-phosphate nucleotidyltransferase, SpsI, has two paralogs, YfnH and YtdA, both expressed during the late stages of sporulation under the control of the mother cell sigma factor σK (31). Based on sequence homology, adjacent sporulation genes also appear to be involved in PS synthesis. Putative PS synthesis pathways are detailed in Fig. S1. ORFs, open reading frames.
FIG 2
FIG 2
Contributions of the spsA–L operon to spore surface properties. (A) BATH assay of spores with the following gene deletions: ΔspsI (PE2763), ΔspsJ (PE3348), ΔspsK (PE3349), and ΔspsL (PE3350). An inability to synthesize rhamnose causes an increase in relative hydrophobicity profiles compared to wild-type (WT) spores (PY79). Deletions of genes upstream of spsI also result in the production of spores that are more hydrophobic (Fig. S2A). Experiments were performed in triplicate; error bars represent standard deviations. (B) India ink staining is a method revealing the presence of a PS layer by negative staining. Wild-type spores (168) are surrounded by a halo confirming the presence of a PS layer. The following sps mutant spores exhibit no halo, suggesting disruption of the PS layer: ΔspsI (BKE37840), ΔspsJ (BKE37830), ΔspsK (BKE37820), and ΔspsL (BKE37810). Similar results are obtained with deletions upstream of spsI or by deletion of the entire sps operon (Fig. S2B). Scale bars = 2.5 μm. (C) Analysis of spore crust morphology by TEM with ruthenium red staining shows that wild-type spores (PY79) are surrounded by an electron-dense outer coat layer (Oc, orange arrow) and a crust (Cr, red arrow). ΔspsI spores (PE2763) have a greatly reduced crust (red arrow), while the outer coat remains intact (orange arrow). Scale bars = 200 nm. Analysis of the localization of the crust proteins CotX-GFP, CotY-GFP, CotZ-GFP, and CgeA-GFP in ΔspsI mutant sporulating cells indicates that their localization is unaffected, suggesting that the deletion of spsI does not interfere with crust protein assembly but prevents PS deposition (Fig. S2C).
FIG 3
FIG 3
Putative glucose-1-phosphate nucleotidyltransferases expressed during late sporulation play different roles in spore PS synthesis. The following three σK-dependent sporulation genes encode putative glucose-1-phosphate nucleotidyltransferases: spsI, yfnH, and ytdA. (A) Analysis by BATH assays. While deletion of spsI (PE2763) causes a significant increase in spore hydrophobicity, ΔyfnH (PE2919) and ΔytdA (PE2764) mutant spores are indistinguishable from wild-type spores (PY79). Experiments were performed in triplicate; error bars represent standard deviations. (B) Analysis by India ink staining. ΔspsI mutant spores (BKE37840) show no halo, ΔytdA mutant spores (BKE30850) have halos that are similar in size to wild-type (168) spores, and ΔyfnH mutant spores (BKE07270) have expanded halos. Quantification of halo areas for ΔytdA and ΔyfnH mutant spores is reported in Fig. S3A and S4A, respectively. Scale bars = 2.5 μm. (C) Imaging of wild-type (PY79), ΔspsI mutant (PE2763), ΔytdA (PE2764), and ΔyfnH mutant (PE2919) spores by TEM with ruthenium red staining. Inactivation of yfnH results in the production of spores surrounded by a large and extensive weblike PS (red arrow) with an intact outer coat (orange arrow). Scale bars = 200 nm. Additional TEM images can be found in Fig. S3B to D. (D) Scanning electron micrographs of wild-type (PY79), ΔspsI mutant (PE2763), and ΔyfnH mutant (PE2919) spores. Scale bars = 500 nm. Additional SEM images can be found in Fig. S3E to G. BATH assays and India ink staining for deletions in the ytcABC operon are presented in Fig. S3H and I, respectively.
FIG 4
FIG 4
Gene deletions in the yfnHGFED cluster result in expansion of the PS layer. (A) Analyses by India ink staining of a deletion mutant of the entire yfnH–D gene cluster (NY35) and individual gene deletions, as follows: ΔyfnD (BKE07310), ΔyfnE (BKE07300), ΔyfnF (BKE07290), ΔyfnG (BKE07280) and ΔyfnH (BKE07270). All deletion mutants exhibit an increase in spore halo width compared to wild-type spores (168). Scale bars = 2.5 μm. (B) Measurements of the halo areas (numbers of spores correspond to the number of spores considered for the measurements) for wild-type (168) and ΔyfnH–D (NY35) spores. Measurements for ΔyfnD (BKE07310), ΔyfnE (BKE07300), ΔyfnF (BKE07290), ΔyfnG (BKE07280) and ΔyfnH (BKE07270) mutant spores can be found in Fig. S4A. (C) Analyses of spore surface extracts by gel electrophoresis (5% polyacrylamide, Tris-borate-EDTA [TBE], stained with Stains-All). All mutants show an increase in size presumably caused by an expansion in PS content. BATH assays for each deletion mutant in the yfnH–D cluster are displayed in Fig. S4B. (D) Imaging of ΔyfnE (PE3063), ΔyfnF (PE3062), and ΔyfnG (PE2961) mutant spores by TEM with ruthenium red staining. Mutant spores exhibit extensive weblike PS (red arrow) with an intact outer coat (orange arrow). Scale bars = 200 nm. TEM images of spore fields can be found in Fig. S4C to E. (E) Analysis of ΔyfnF (PE3062) mutant spores by SEM. Scale bar = 500 nm. A larger field of spores is displayed in Fig. S4F.
FIG 5
FIG 5
Partial complementation of the ΔspsI phenotype by deletion of yfnH or yfnF. (A) By BATH assay, the ΔyfnH ΔspsI (PE3119) or ΔyfnF ΔspsI (PE3118) double-deletion mutants have a greater percentage of spores remaining in the aqueous layer than did ΔspsI single-mutation spores (PE2763), and fewer spores remaining in the aqueous layer than ΔyfnH (PE2919) or ΔyfnF (PE3062) single-mutation spores, implying partial complementation. BATH assays for ΔyfnD ΔspsI (PE3357) and ΔyfnE ΔspsI (PE3117) mutants are shown in Fig. S5A. Experiments were performed in triplicate; error bars represent standard deviation. (B) Analysis of the PS layer in double mutants by India ink staining; ΔyfnH ΔspsI (PE3119) and ΔyfnF ΔspsI (PE3118) mutants do not seem to have a larger halo than do ΔspsI (BKE37840) mutant spores. Scale bars = 2.5 μm. (C) Close-ups of ΔspsI ΔyfnF mutant spores imaged by TEM and ruthenium red staining. The complete spores are shown in Fig. S5B. Top left, ΔyfnF (PE3062) mutant spores have an expanded and weblike PS layer (red arrow) in relation to the outer coat (orange arrow). Top right, ΔspsI (PE2763) mutant spores have thinned and scarcely visible crust. Bottom, ΔyfnF ΔspsI (PE3118) mutant spores have a more visible crust structure, suggesting partial rescue of the surface morphology defects observed in ΔspsI (PE2763) mutant spores. A similar analysis for ΔyfnE (PE3063), ΔyfnH (PE2919), ΔyfnE ΔspsI (PE3117), and ΔyfnH ΔspsI (PE3119) mutant spores is provided in Fig. S5C. (D) Analysis of ΔyfnF (PE3062), ΔspsI (PE2763), and ΔyfnF ΔspsI (PE3118) mutant spores by SEM. Scale bars = 500 nm. SEM images for ΔyfnH (PE2919) and ΔyfnH ΔspsI (PE3119) mutant spores can be found in Fig. S5D. An additional SEM image of a field of and ΔyfnF ΔspsI (PE3118) mutant spores is provided in Fig. S5E.
FIG 6
FIG 6
Analysis of spore surface properties in mutants with deletions in the cgeCDE operon. (A) BATH assays reveal a slight increase in hydrophobicity in ΔcgeD spores (PE2918) compared to wild-type spores (PY79), while ΔcgeC (PE2917) and ΔcgeE (PE3065) mutant spores are indistinguishable from the wild type. Experiments were performed in triplicate; error bars represent standard deviation. (B) By negative staining with India ink, ΔcgeD (NY227) mutant spores have a spread and increased width PS layer. The ΔcgeC (NY226) and ΔcgeE (NY228) mutants have no observable change to the PS layer. Scale bars = 2.5 μm. Measurements of halo areas for ΔcgeD (NY227) mutant spores are provided in Fig. S6A and additional images of spores in Fig. S6B. Analyses of spore surface extracts by gel electrophoresis can be found in Fig. S6C. Extracts from ΔcgeD (NY227) mutant spores show an increase in size presumably caused by an expansion in PS content; the size distribution for extracts from ΔcgeC (NY226) and ΔcgeE (NY228) mutant spores is similar to that observed for wild-type spores (168). (C) TEM with ruthenium red staining of ΔcgeD (PE2918) mutant spores reveals elongated crust filaments (red arrow), which can be attached or balloon away from a speckled outer coat (orange arrow). Scale bars = 200 nm.

Similar articles

Cited by

References

    1. Power PM, Jennings MP. 2003. The genetics of glycosylation in Gram-negative bacteria. FEMS Microbiol Lett 218:211–222. doi:10.1111/j.1574-6968.2003.tb11520.x. - DOI - PubMed
    1. Schmidt MA, Riley LW, Benz I. 2003. Sweet new world: glycoproteins in bacterial pathogens. Trends Microbiol 11:554–561. doi:10.1016/j.tim.2003.10.004. - DOI - PubMed
    1. Tytgat HL, Lebeer S. 2014. The sweet tooth of bacteria: common themes in bacterial glycoconjugates. Microbiol Mol Biol Rev 78:372–417. doi:10.1128/MMBR.00007-14. - DOI - PMC - PubMed
    1. Tytgat HLP, de Vos WM. 2016. Sugar coating the envelope: glycoconjugates for microbe-host crosstalk. Trends Microbiol 24:853–861. doi:10.1016/j.tim.2016.06.004. - DOI - PubMed
    1. Eichler J, Koomey M. 2017. Sweet new roles for protein glycosylation in prokaryotes. Trends Microbiol 25:662–672. doi:10.1016/j.tim.2017.03.001. - DOI - PubMed

Publication types

LinkOut - more resources