

Antiretroviral Drug Concentrations in Lymph Nodes: A Cross-Species Comparison of the Effect of Drug Transporter Expression, Viral Infection, and Sex in Humanized Mice, Nonhuman Primates, and Humans
- PMID: 31235531
- PMCID: PMC6695867
- DOI: 10.1124/jpet.119.259150
Antiretroviral Drug Concentrations in Lymph Nodes: A Cross-Species Comparison of the Effect of Drug Transporter Expression, Viral Infection, and Sex in Humanized Mice, Nonhuman Primates, and Humans
Abstract
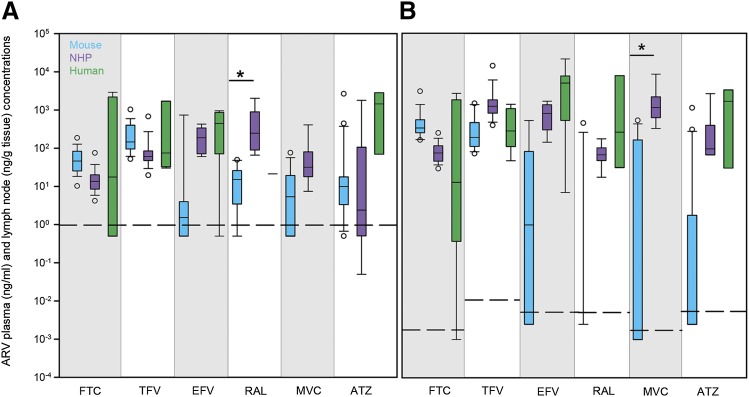
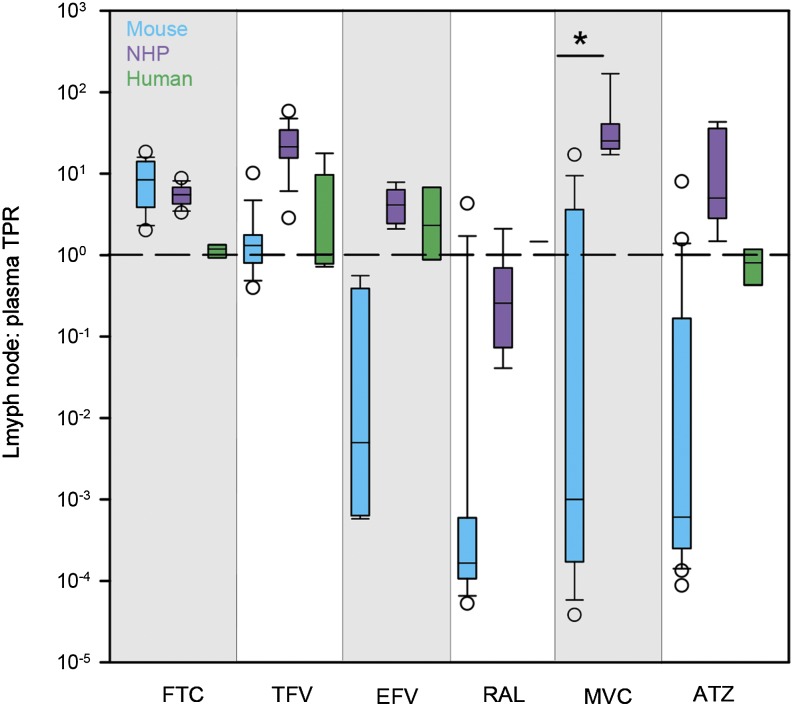
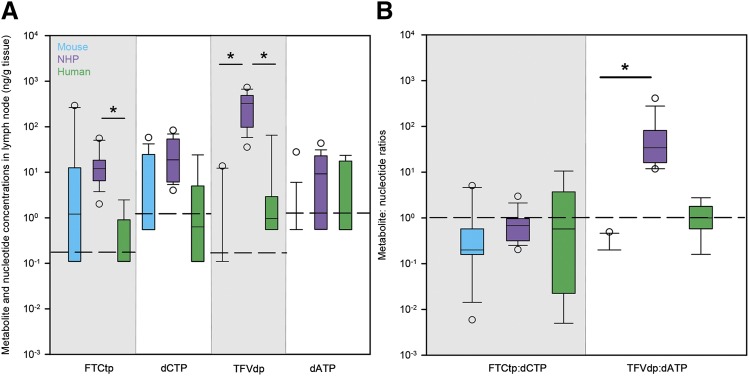
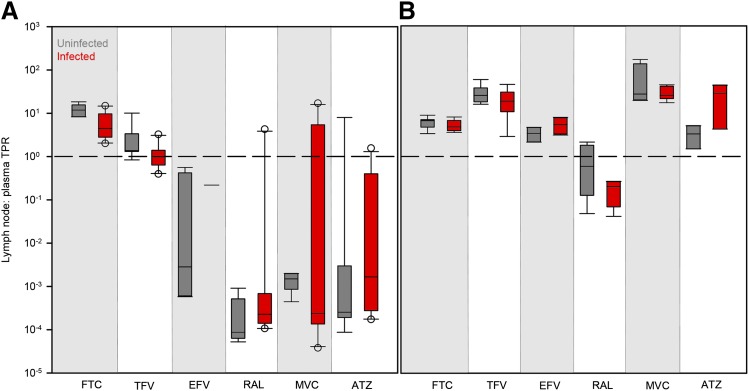
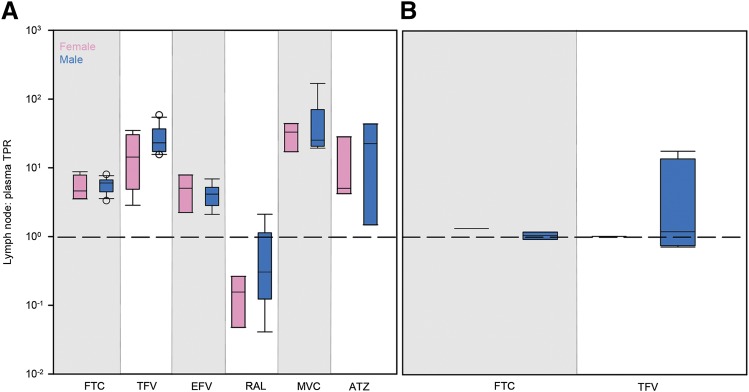
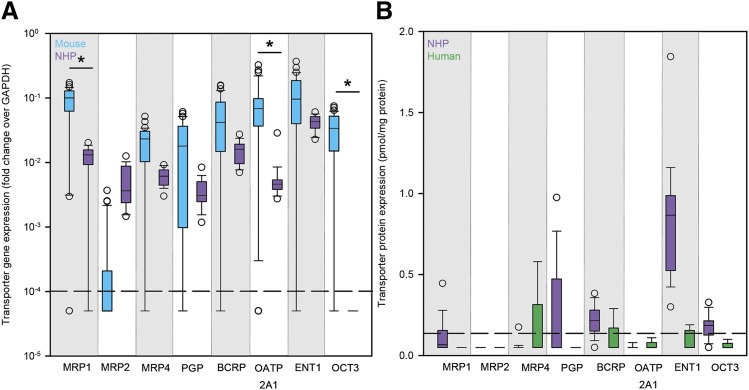
In a "kick and kill" strategy for human immunodeficiency virus (HIV) eradication, protective concentrations of antiretrovirals (ARVs) in the lymph node are important to prevent vulnerable cells from further HIV infection. However, the factors responsible for drug distribution and concentration into these tissues are largely unknown. Although humanized mice and nonhuman primates (NHPs) are crucial to HIV research, ARV tissue pharmacology has not been well characterized across species. This study investigated the influence of drug transporter expression, viral infection, and sex on ARV penetration within lymph nodes of animal models and humans. Six ARVs were dosed for 10 days in humanized mice and NHPs. Plasma and lymph nodes were collected at necropsy, 24 hours after the last dose. Human lymph node tissue and plasma from deceased patients were collected from tissue banks. ARV, active metabolite, and endogenous nucleotide concentrations were measured by liquid chromatography-tandem mass spectrometry, and drug transporter expression was measured using quantitative polymerase chain reaction and quantitative targeted absolute proteomics. In NHPs and humans, lymph node ARV concentrations were greater than or equal to plasma, and tenofovir diphosphate/deoxyadenosine triphosphate concentration ratios achieved efficacy targets in lymph nodes from all three species. There was no effect of infection or sex on ARV concentrations. Low drug transporter expression existed in lymph nodes from all species, and no predictive relationships were found between transporter gene/protein expression and ARV penetration. Overall, common preclinical models of HIV infection were well suited to predict human ARV exposure in lymph nodes, and low transporter expression suggests primarily passive drug distribution in these tissues. SIGNIFICANCE STATEMENT: During human immunodeficiency virus (HIV) eradication strategies, protective concentrations of antiretrovirals (ARVs) in the lymph node prevent vulnerable cells from further HIV infection. However, ARV tissue pharmacology has not been well characterized across preclinical species used for HIV eradication research, and the influence of drug transporters, HIV infection, and sex on ARV distribution and concentration into the lymph node is largely unknown. Here we show that two animal models of HIV infection (humanized mice and nonhuman primates) were well suited to predict human ARV exposure in lymph nodes. Additionally, we found that drug transporter expression was minimal and-along with viral infection and sex-did not affect ARV penetration into lymph nodes from any species.
Copyright © 2019 by The American Society for Pharmacology and Experimental Therapeutics.
Figures
Similar articles
-
Antiretroviral Penetration and Drug Transporter Concentrations in the Spleens of Three Preclinical Animal Models and Humans.Antimicrob Agents Chemother. 2020 Sep 21;64(10):e01384-20. doi: 10.1128/AAC.01384-20. Print 2020 Sep 21. Antimicrob Agents Chemother. 2020. PMID: 32661005 Free PMC article.
-
Quantitative Imaging Analysis of the Spatial Relationship between Antiretrovirals, Reverse Transcriptase Simian-Human Immunodeficiency Virus RNA, and Collagen in the Mesenteric Lymph Nodes of Nonhuman Primates.Antimicrob Agents Chemother. 2021 May 18;65(6):e00019-21. doi: 10.1128/AAC.00019-21. Print 2021 May 18. Antimicrob Agents Chemother. 2021. PMID: 33782003 Free PMC article.
-
Antiretroviral drug exposure in lymph nodes is heterogeneous and drug dependent.J Int AIDS Soc. 2022 Apr;25(4):e25895. doi: 10.1002/jia2.25895. J Int AIDS Soc. 2022. PMID: 35441468 Free PMC article.
-
Role and modulation of drug transporters in HIV-1 therapy.Adv Drug Deliv Rev. 2016 Aug 1;103:121-143. doi: 10.1016/j.addr.2016.05.001. Epub 2016 May 13. Adv Drug Deliv Rev. 2016. PMID: 27181050 Review.
-
Intracellular Pharmacokinetics of Antiretroviral Drugs in HIV-Infected Patients, and their Correlation with Drug Action.Clin Pharmacokinet. 2010;49(1):17-45. doi: 10.2165/11318110-000000000-00000. Clin Pharmacokinet. 2010. PMID: 20000887 Review.
Cited by
-
Antiretroviral Penetration and Drug Transporter Concentrations in the Spleens of Three Preclinical Animal Models and Humans.Antimicrob Agents Chemother. 2020 Sep 21;64(10):e01384-20. doi: 10.1128/AAC.01384-20. Print 2020 Sep 21. Antimicrob Agents Chemother. 2020. PMID: 32661005 Free PMC article.
-
Antiretroviral Penetration across Three Preclinical Animal Models and Humans in Eight Putative HIV Viral Reservoirs.Antimicrob Agents Chemother. 2019 Dec 20;64(1):e01639-19. doi: 10.1128/AAC.01639-19. Print 2019 Dec 20. Antimicrob Agents Chemother. 2019. PMID: 31611355 Free PMC article.
-
Evaluation of Sex Differences in Preclinical Pharmacology Research: How Far Is Left to Go?Pharmaceuticals (Basel). 2023 May 24;16(6):786. doi: 10.3390/ph16060786. Pharmaceuticals (Basel). 2023. PMID: 37375734 Free PMC article. Review.
-
The Humanized Mouse Model: What Added Value Does It Offer for HIV Research?Pathogens. 2023 Apr 17;12(4):608. doi: 10.3390/pathogens12040608. Pathogens. 2023. PMID: 37111494 Free PMC article. Review.
-
More than a Gender Issue: Testis as a Distinctive HIV Reservoir and Its Implication for Viral Eradication.Methods Mol Biol. 2022;2407:173-186. doi: 10.1007/978-1-0716-1871-4_13. Methods Mol Biol. 2022. PMID: 34985665
References
-
- Alam C, Whyte-Allman S-K, Omeragic A, Bendayan R. (2016) Role and modulation of drug transporters in HIV-1 therapy. Adv Drug Deliv Rev 103:121–143. - PubMed
-
- Antonelli G, Turriziani O, Cianfriglia M, Riva E, Dong G, Fattorossi A, Dianzani F. (1992) Resistance of HIV-1 to AZT might also involve the cellular expression of multidrug resistance P-glycoprotein. AIDS Res Hum Retroviruses 8:1839–1844. - PubMed
-
- Chun TW, Davey RT, Jr, Engel D, Lane HC, Fauci AS. (1999) Re-emergence of HIV after stopping therapy. Nature 401:874–875. - PubMed
Publication types
MeSH terms
Substances
Grants and funding
LinkOut - more resources
Full Text Sources
Medical
