. 2019 Aug 23;63(9):e00707-19.
doi: 10.1128/AAC.00707-19. Print 2019 Sep.

Disruption of Membrane Integrity by the Bacterium-Derived Antifungal Jagaricin

Affiliations

Disruption of Membrane Integrity by the Bacterium-Derived Antifungal Jagaricin

Daniel Fischer et al. Antimicrob Agents Chemother. .

Abstract

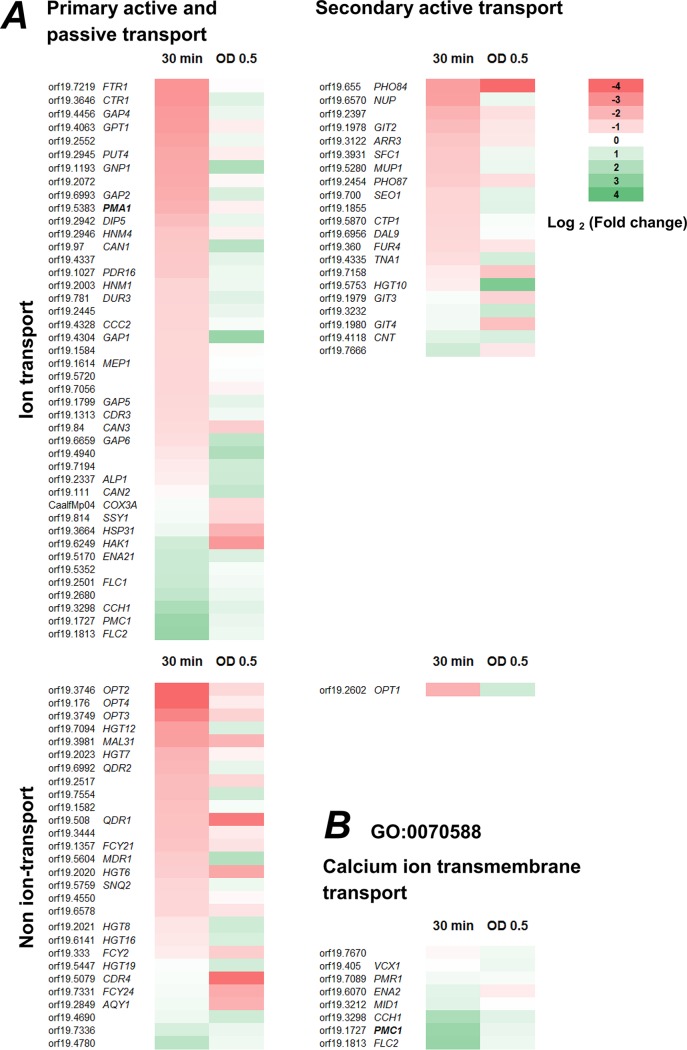
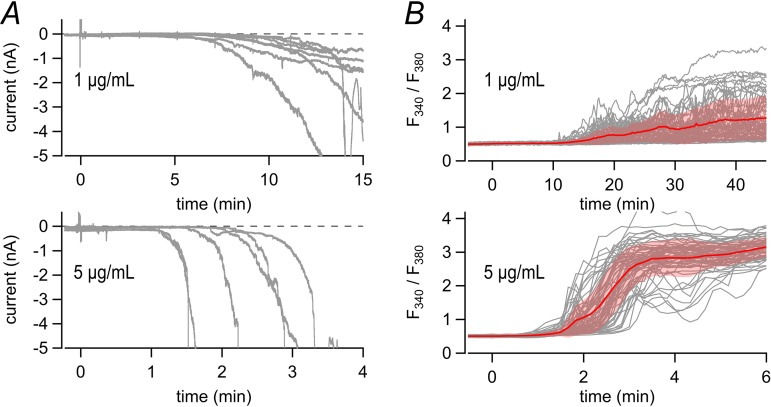
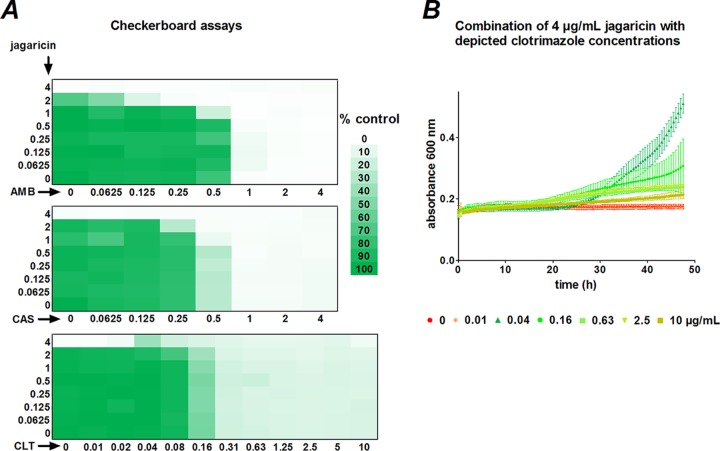
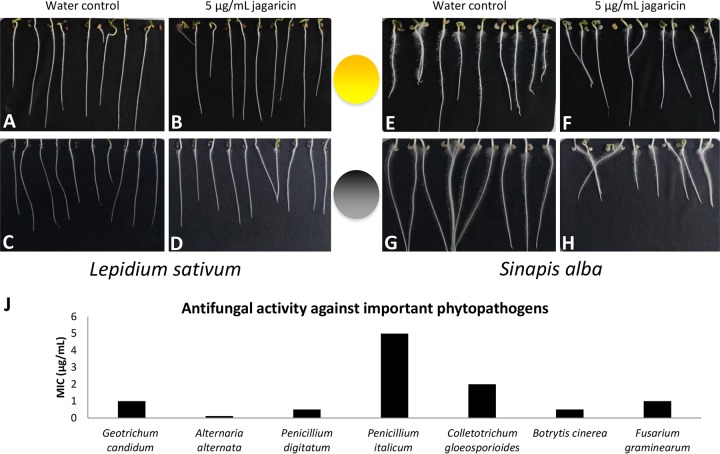
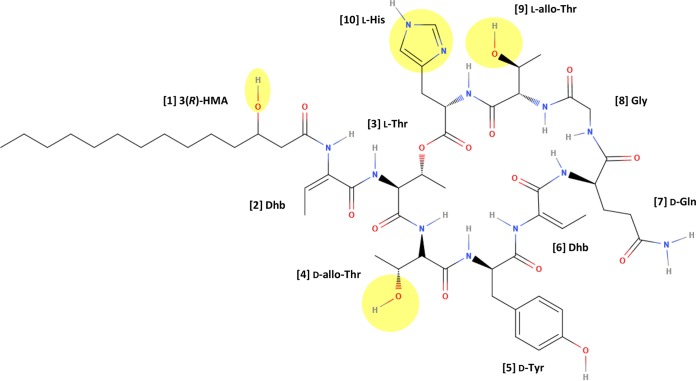
Jagaricin is a lipopeptide produced by the bacterial mushroom pathogen Janthinobacterium agaricidamnosum, the causative agent of mushroom soft rot disease. Apart from causing lesions in mushrooms, jagaricin is a potent antifungal active against human-pathogenic fungi. We show that jagaricin acts by impairing membrane integrity, resulting in a rapid flux of ions, including Ca2+, into susceptible target cells. Accordingly, the calcineurin pathway is required for jagaricin tolerance in the fungal pathogen Candida albicans Transcriptional profiling of pathogenic yeasts further revealed that jagaricin triggers cell wall strengthening, general shutdown of membrane potential-driven transport, and the upregulation of lipid transporters, linking cell envelope integrity to jagaricin action and resistance. Whereas jagaricin shows hemolytic effects, it exhibited either no or low plant toxicity at concentrations at which the growth of prevalent phytopathogenic fungi is inhibited. Therefore, jagaricin may have potential for agricultural applications. The action of jagaricin as a membrane-disrupting antifungal is promising but would require modifications for use in humans.

Keywords: Candida albicans; calcium influx; jagaricin; membrane integrity; mode of action; pathogenic fungi; susceptibility testing.


Figures

FIG 1
FIG 1
Susceptibility analysis D. discoideum and killing of C. albicans. (A) Killing of C. albicans by jagaricin. (Left) Transient positive staining of C. albicans yeasts by PI indicates recent cell death; (right) extrapolated cumulative cell death of the population based on PI staining kinetics obtained at the respective jagaricin concentration (see Materials and Methods). At low jagaricin concentrations (0, 1, and 2 μg/ml), yeast growth made analysis impossible after 7 h for the original PI staining and prohibited the obtainment of PI staining kinetics. Geometric means of three biological replicates for either the % PI positive cells (left) or the % dead cells (right) ± the geometric standard deviations are plotted. (B) Jagaricin susceptibility of D. discoideum. Jagaricin showed strong inhibitory activity toward D. discoideum (IC50 = 19.97 ng/ml; log10 IC50 = −1.70 ± 0.21). Individual log10 IC50 values are marked on the x axis. Three biological replicates with weighted arithmetic means of three technical replicates ± the standard deviations are plotted.
FIG 2
FIG 2
Jagaricin susceptibility of selected C. albicans (black, orf19.nnn) and C. glabrata (light blue, CAGL0nnn) mutants. Jagaricin effects on selected C. albicans and C. glabrata mutants are shown. The growth of Candida strains at 3 μg/ml (growth-inhibiting), 2 μg/ml (growth-permissive), and 0 μg/ml jagaricin was recorded in individual wells of a 96-well plate by measuring absorbance at 600 nm every 30 min over a period of 3 days under continuous incubation in an enzyme-linked immunosorbent assay reader. (A) The A (600 nm) % WT was calculated as the geometric mean of three biological replicates. The growth speed index is –log2 of the maximum t1/2 ratio of the mutant and reference strain, where the maximum t1/2 is the time to half-maximal A (600 nm) value; negative values indicate slower and positive values faster growth than the wild type; the arithmetic means of three biological replicates are shown. The individual origins of the strains are listed in Table S2. Genes depicted in boldface showed “stable growth” (for the definition, see Materials and Methods) at the otherwise growth-inhibiting jagaricin concentration of 3 μg/ml. (B) Individual growth curves of these mutants (and the corresponding C. glabrata [ATCC 2001 hlt] and C. albicans [SN250] reference strains) are shown. Arithmetic means of A (600 nm) values of three biological replicates ± the standard deviations are shown.
FIG 3
FIG 3
Enriched GO-terms upon exposure to jagaricin. Global short-term transcriptional response of C. albicans to a 30-min exposure to nontoxic jagaricin levels. GO-terms in the “biological process” domain were summarized by Revigo (66) for upregulated (top) and downregulated (bottom) genes (cutoff –log10 P > 2).
FIG 4
FIG 4
Transcriptomic response: regulation of transporters. The regulation of transporter genes in response to short-term (i.e., after 30 min) jagaricin exposure or jagaricin exposure during growth phase (grown to an OD600 of 0.5) was assessed. Genes upregulated under jagaricin treatment are indicated in green; downregulated genes are indicated in red. (A) Depicted genes were selected according to an annotated function as transporter gene and a >2-fold up- or downregulation for at least one time point. (B) Against the general trend toward transporter downregulation, Ca2+ transporters are upregulated in the short-term response.
FIG 5
FIG 5
Erythrocyte lysis. Jagaricin lyses human erythrocytes. A total of 107 erythrocytes were incubated with various amounts of jagaricin for 1 h, and the OD541 of the supernatant was determined. Three biological replicates with two technical replicates each resulted in a weighted mean IC50 of 4.16 μg/ml (log10 IC50 = 0.62 ± 0.18).
FIG 6
FIG 6
Ion fluxes in human cells upon jagaricin exposure. Jagaricin effects on HEK293T cells were assessed. (A) Whole-cell patch-clamp recordings of HEK293T cells. Cells were voltage clamped at −40 mV. The resulting current is shown for individual cells. Downward deflection indicates the inward flux of cations or the outward flux of anions. Jagaricin was applied at time point zero (top, 1 μg/ml; bottom, 5 μg/ml). (B) HEK293T cells were loaded with the Ca2+ indicator Fura-2-AM. The intracellular free Ca2+ concentration was determined from the fluorescence ratio of the dye at 340 and 380 nm (F340/F380) and is plotted as a function of time. Individual cell traces are superimposed (gray); the red trace indicates the mean, with shading indicating the standard deviations. Jagaricin application was as described for panel A. A representative graph of five independent experiments is shown for each jagaricin concentration.
FIG 7
FIG 7
Checkerboard assay. Cooperative tests of jagaricin action with amphotericin B (AMB), caspofungin (CAS), or clotrimazole (CLT) after 2 days of incubation; compound concentrations are given in μg/ml. (A) While fractional inhibitory concentration index (ΣFICI) calculation after 1 day of incubation showed indifferent interactions between jagaricin and each of the three tested antimycotics, clotrimazole restored some growth at the otherwise fully growth-inhibiting jagaricin concentration of 4 μg/ml, seen here after 2 days of incubation. Similarly, low levels of jagaricin allowed (very limited) growth at the otherwise toxic amphotericin B concentration of 1 μg/ml over 2 days. (B) Individual growth curves of selected clotrimazole concentrations from panel A with 4 μg/ml jagaricin are shown. The data points represent the arithmetic means of three biological replicates ± the standard deviations.
FIG 8
FIG 8
Susceptibility tests for application (plants and phytopathogenic fungi). Phytotoxicity assays with jagaricin were performed. Lepidium sativum (left) or Sinapis alba (right) seedlings were grown in the presence (top) or absence (bottom) of light in substrate containing distilled water (control; A, C, E, and G) or jagaricin at 5 μg/ml (B, D, F, and H). In general, 5 μg/ml jagaricin caused no inhibition of seed germination; root length was only inhibited with Sinapis alba in the absence of light (root growth inhibition = 40.4%). (J) Jagaricin shows low MICs for different phytopathogenic fungi. The bars represent the arithmetic means of two biological replicates.
FIG 9
FIG 9
Polarity distribution within the jagaricin molecule. The structure and distribution of polar and apolar parts within the jagaricin molecule are depicted. Polar functional groups are highlighted in light yellow.

References

    1. Newman DJ, Cragg GM. 2012. Natural products as sources of new drugs over the 30 years from 1981 to 2010. J Nat Prod 75:311–335. doi:10.1021/np200906s. - DOI - PMC - PubMed
    1. Graupner K, Scherlach K, Bretschneider T, Lackner G, Roth M, Gross H, Hertweck C. 2012. Imaging mass spectrometry and genome mining reveal highly antifungal virulence factor of mushroom soft rot pathogen. Angew Chem Int Ed Engl 51:13173–13177. doi:10.1002/anie.201206658. - DOI - PubMed
    1. Brown GD, Denning DW, Gow NA, Levitz SM, Netea MG, White TC. 2012. Hidden killers: human fungal infections. Sci Transl Med 4:165rv113. - PubMed
    1. Chowdhary A, Sharma C, Meis JF. 2017. Candida auris: a rapidly emerging cause of hospital-acquired multidrug-resistant fungal infections globally. PLoS Pathog 13:e1006290. doi:10.1371/journal.ppat.1006290. - DOI - PMC - PubMed
    1. Chrispeels MJ, Sadava DE. 2003. Plants, genes, and crop biotechnology, 2nd ed Jones & Bartlett Publishers, Sudbury, MA.

Publication types

MeSH terms

LinkOut - more resources