

Predicting Perceptual Decisions Using Visual Cortical Population Responses and Choice History
- PMID: 31235648
- PMCID: PMC6703876
- DOI: 10.1523/JNEUROSCI.0035-19.2019
Predicting Perceptual Decisions Using Visual Cortical Population Responses and Choice History
Abstract
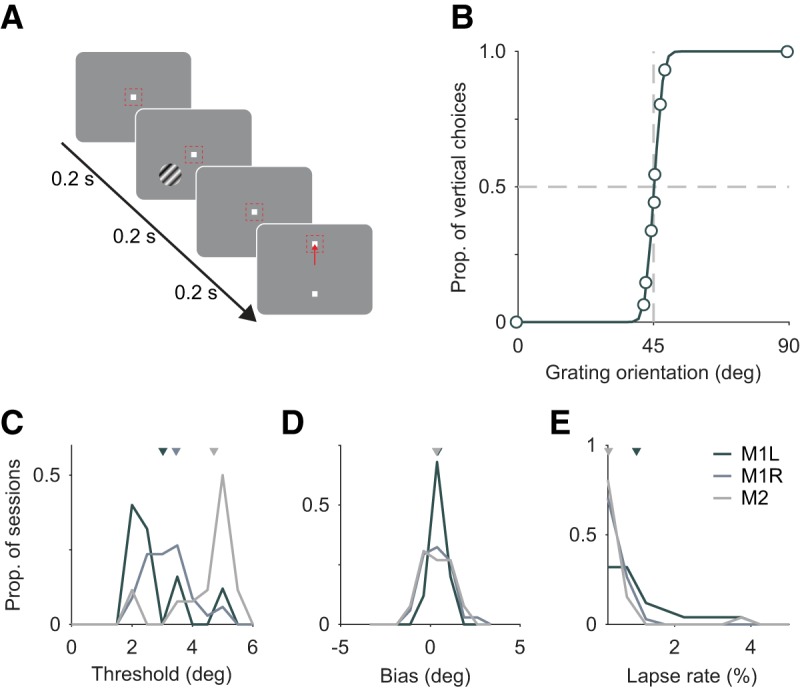
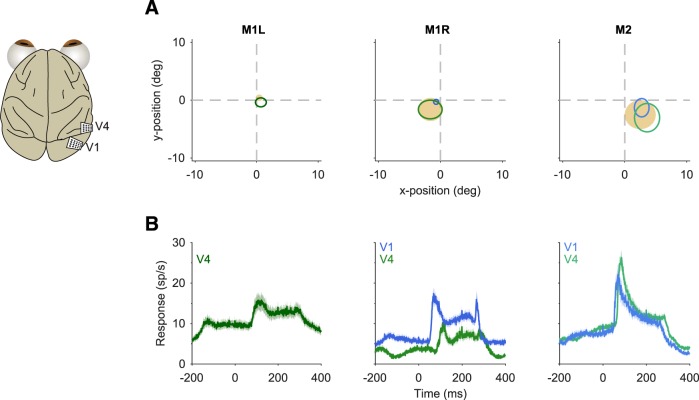
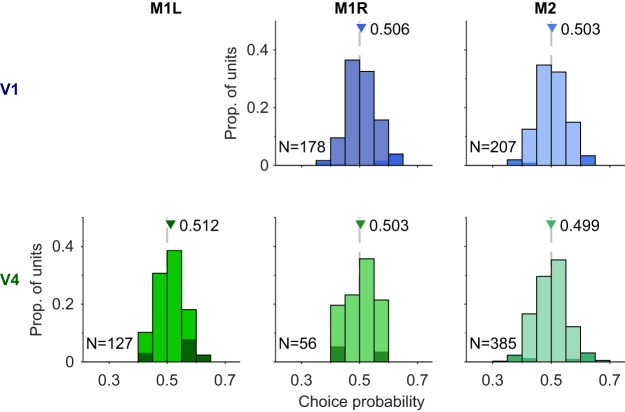
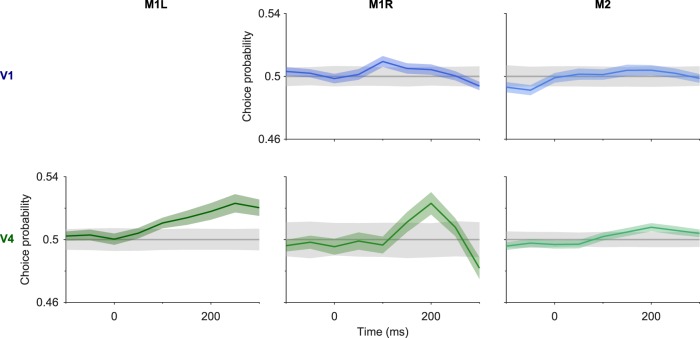
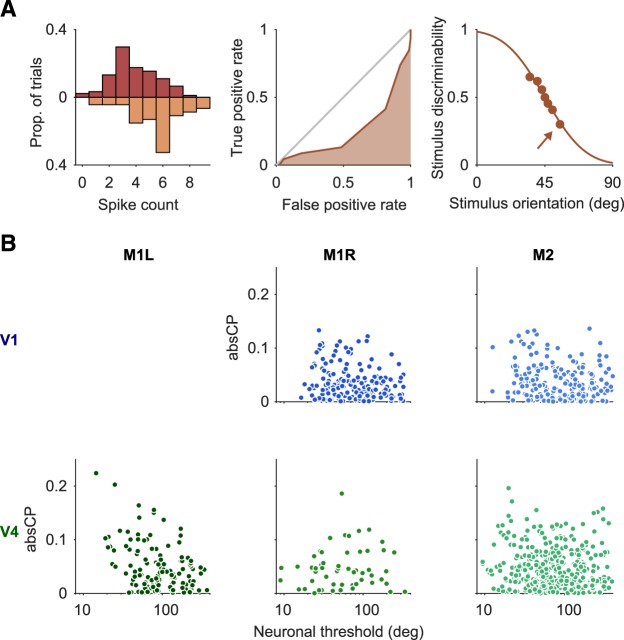
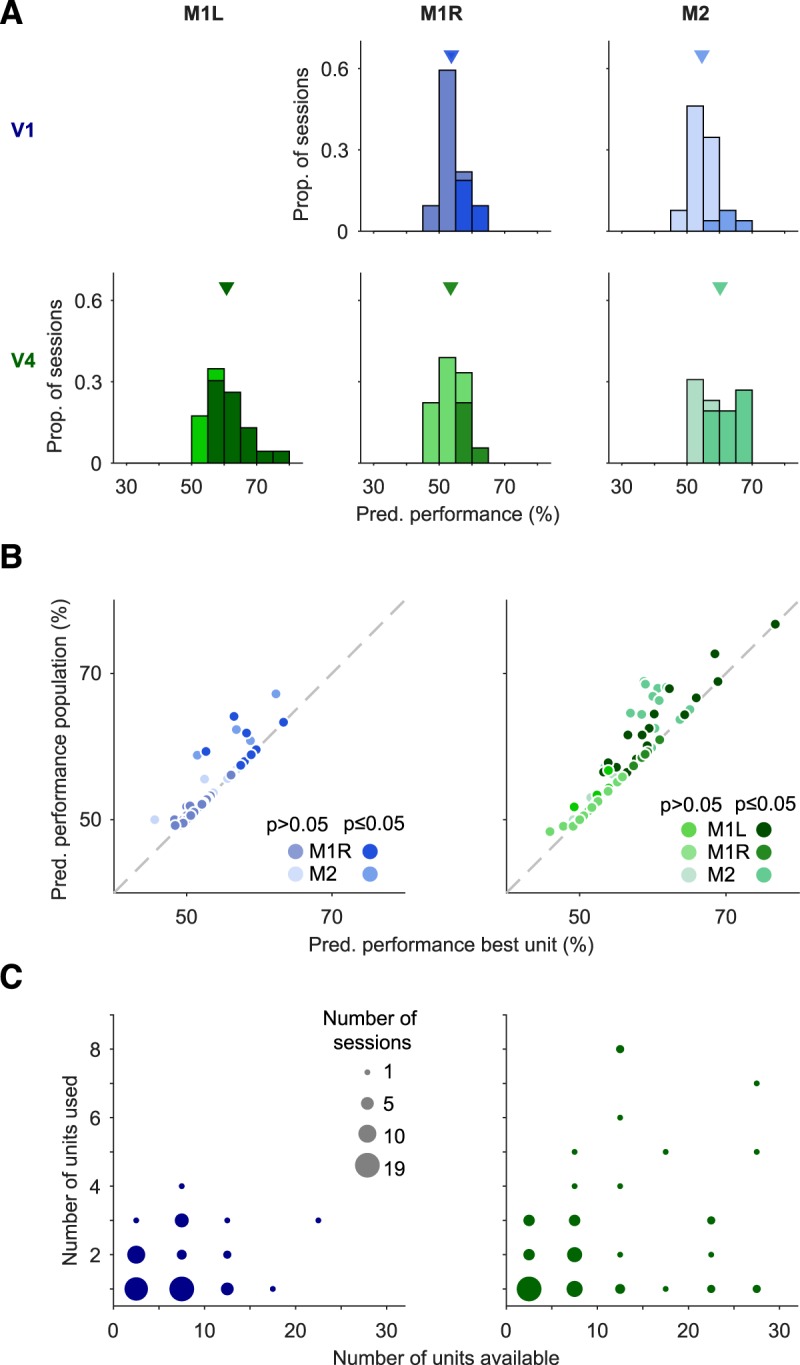
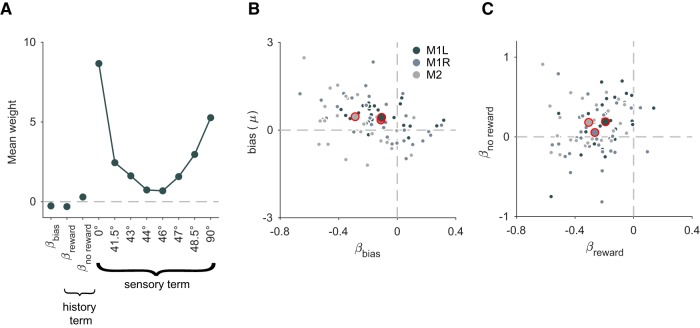
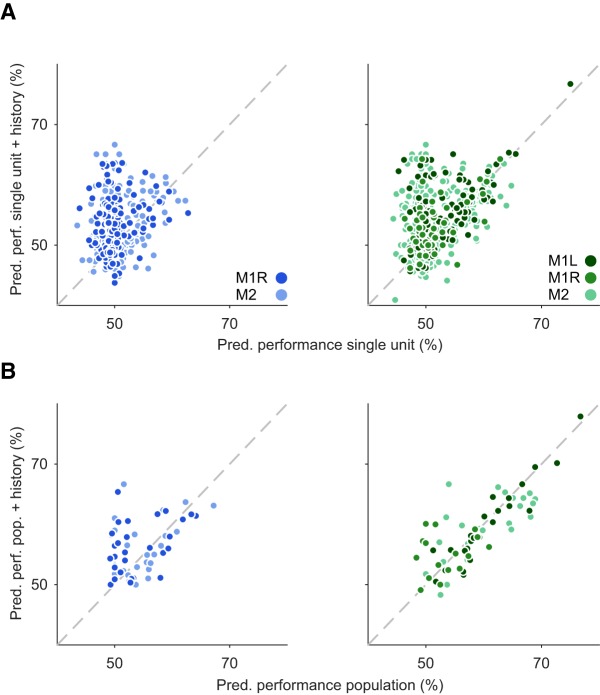
Our understanding of the neural basis of perceptual decision making has been built in part on relating co-fluctuations of single neuron responses to perceptual decisions on a trial-by-trial basis. The strength of this relationship is often compared across neurons or brain areas, recorded in different sessions, animals, or variants of a task. We sought to extend our understanding of perceptual decision making in three ways. First, we measured neuronal activity simultaneously in early [primary visual cortex (V1)] and midlevel (V4) visual cortex while macaque monkeys performed a fine orientation discrimination perceptual task. This allowed a direct comparison of choice signals in these two areas, including their dynamics. Second, we asked how our ability to predict animals' decisions would be improved by considering small simultaneously-recorded neuronal populations rather than individual units. Finally, we asked whether predictions would be improved by taking into account the animals' choice and reward histories, which can strongly influence decision making. We found that responses of individual V4 neurons were weakly predictive of decisions, but only in a brief epoch between stimulus offset and the indication of choice. In V1, few neurons showed significant decision-related activity. Analysis of neuronal population responses revealed robust choice-related information in V4 and substantially weaker signals in V1. Including choice- and reward-history information improved performance further, particularly when the recorded populations contained little decision-related information. Our work shows the power of using neuronal populations and decision history when relating neuronal responses to the perceptual decisions they are thought to underlie.SIGNIFICANCE STATEMENT Decades of research has provided a rich description of how visual information is represented in the visual cortex. Yet how cortical responses relate to visual perception remains poorly understood. Here we relate fluctuations in small neuronal population responses, recorded simultaneously in primary visual cortex (V1) and area V4 of monkeys, to perceptual reports in an orientation discrimination task. Choice-related signals were robust in V4, particularly late in the behavioral trial, but not in V1. Models that include both neuronal responses and choice-history information were able to predict a substantial portion of decisions. Our work shows the power of integrating information across neurons and including decision history in relating neuronal responses to perceptual decisions.
Keywords: choice signals; perceptual decision making; visual cortex.
Copyright © 2019 the authors.
Figures
Similar articles
-
Decision Signals in the Local Field Potentials of Early and Mid-Level Macaque Visual Cortex.Cereb Cortex. 2021 Jan 1;31(1):169-183. doi: 10.1093/cercor/bhaa218. Cereb Cortex. 2021. PMID: 32852540 Free PMC article.
-
Dissociation of Choice Formation and Choice-Correlated Activity in Macaque Visual Cortex.J Neurosci. 2017 May 17;37(20):5195-5203. doi: 10.1523/JNEUROSCI.3331-16.2017. Epub 2017 Apr 21. J Neurosci. 2017. PMID: 28432137 Free PMC article.
-
Neuronal Adaptation Reveals a Suboptimal Decoding of Orientation Tuned Populations in the Mouse Visual Cortex.J Neurosci. 2019 May 15;39(20):3867-3881. doi: 10.1523/JNEUROSCI.3172-18.2019. Epub 2019 Mar 4. J Neurosci. 2019. PMID: 30833509 Free PMC article.
-
Linking Neuronal Direction Selectivity to Perceptual Decisions About Visual Motion.Annu Rev Vis Sci. 2020 Sep 15;6:335-362. doi: 10.1146/annurev-vision-121219-081816. Annu Rev Vis Sci. 2020. PMID: 32936737 Review.
-
Bottom-up and top-down dynamics in visual cortex.Prog Brain Res. 2005;149:65-81. doi: 10.1016/S0079-6123(05)49006-8. Prog Brain Res. 2005. PMID: 16226577 Review.
Cited by
-
Disentangling the flow of signals between populations of neurons.Nat Comput Sci. 2022 Aug;2(8):512-525. doi: 10.1038/s43588-022-00282-5. Epub 2022 Aug 18. Nat Comput Sci. 2022. PMID: 38177794 Free PMC article.
-
Distributed context-dependent choice information in mouse posterior cortex.Nat Commun. 2023 Jan 12;14(1):192. doi: 10.1038/s41467-023-35824-6. Nat Commun. 2023. PMID: 36635318 Free PMC article.
-
Weak evidence for neural correlates of task-switching in macaque V1.J Neurophysiol. 2023 May 1;129(5):1021-1044. doi: 10.1152/jn.00085.2022. Epub 2023 Mar 22. J Neurophysiol. 2023. PMID: 36947884 Free PMC article.
-
Prefrontal cortex represents heuristics that shape choice bias and its integration into future behavior.Curr Biol. 2021 Mar 22;31(6):1234-1244.e6. doi: 10.1016/j.cub.2021.01.068. Epub 2021 Feb 26. Curr Biol. 2021. PMID: 33639107 Free PMC article.
-
Feedforward and feedback interactions between visual cortical areas use different population activity patterns.Nat Commun. 2022 Mar 1;13(1):1099. doi: 10.1038/s41467-022-28552-w. Nat Commun. 2022. PMID: 35232956 Free PMC article.
References
Publication types
MeSH terms
Grants and funding
LinkOut - more resources
Full Text Sources