. 2019 Jun 24;10(7):492.
doi: 10.1038/s41419-019-1738-3.

Long noncoding RNA ANCR inhibits the differentiation of mesenchymal stem cells toward definitive endoderm by facilitating the association of PTBP1 with ID2

Affiliations

Long noncoding RNA ANCR inhibits the differentiation of mesenchymal stem cells toward definitive endoderm by facilitating the association of PTBP1 with ID2

Jing Li et al. Cell Death Dis. .

Abstract

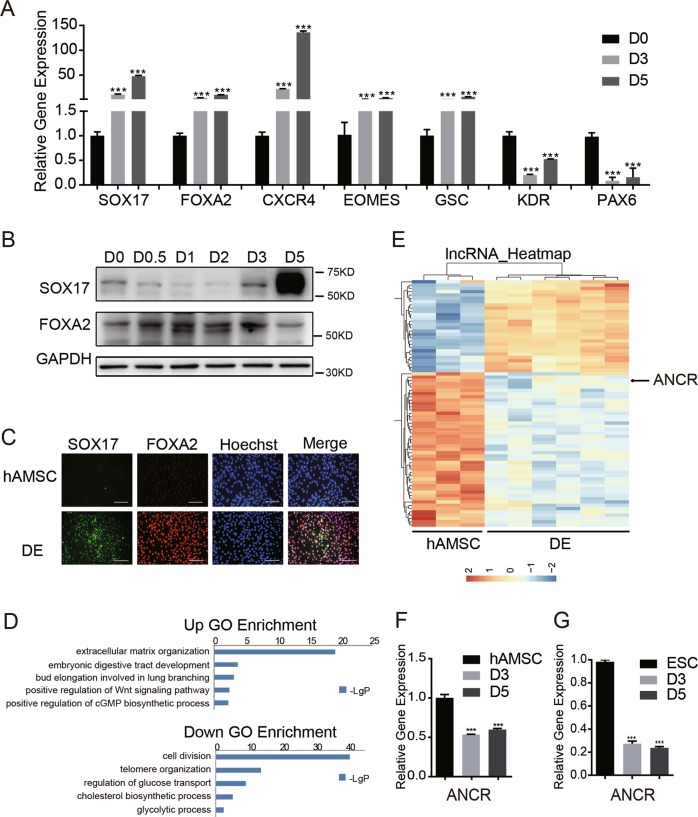
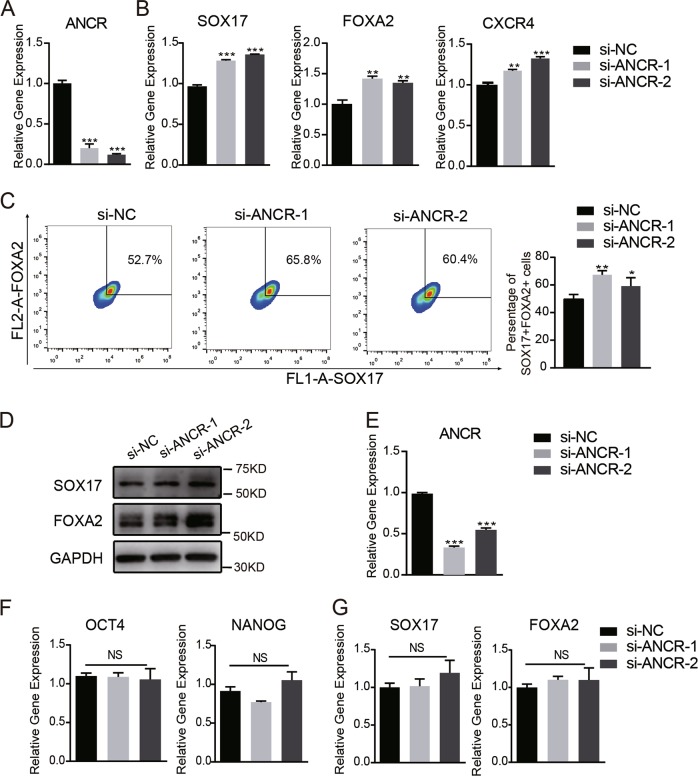
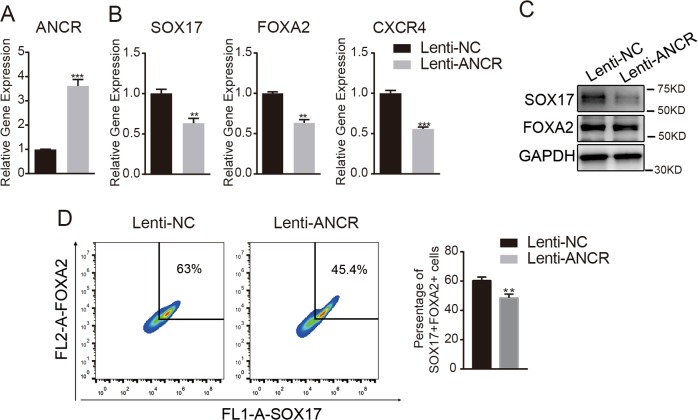
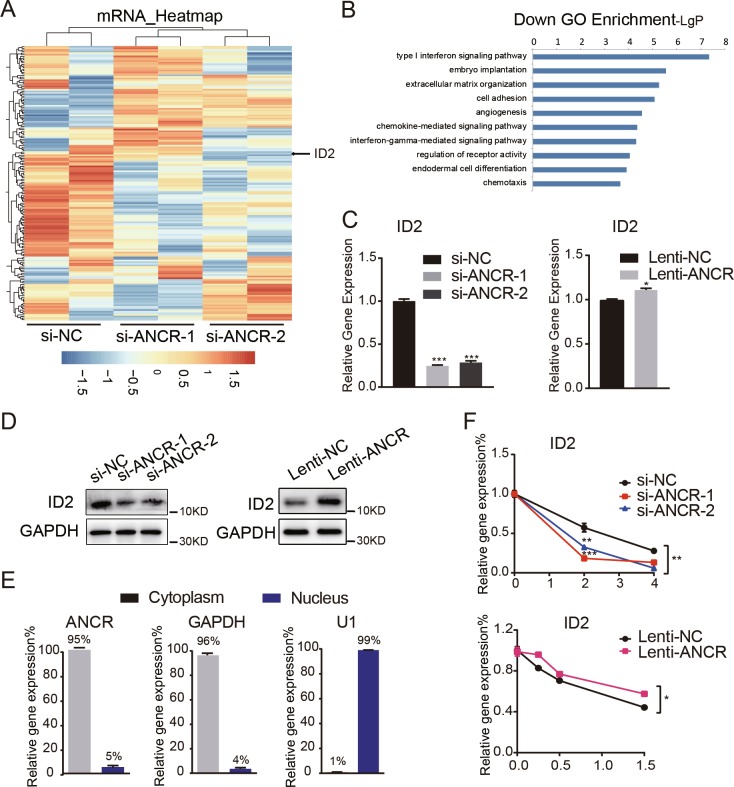
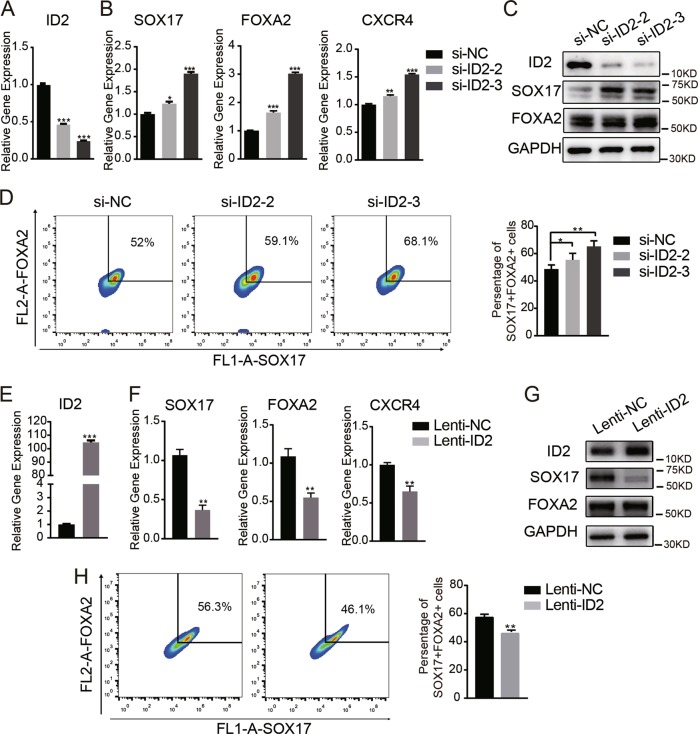
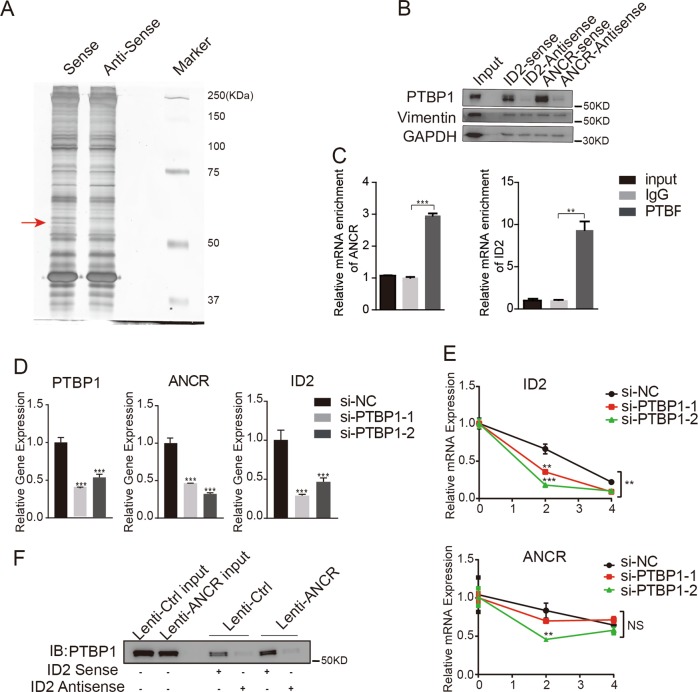
The generation of definitive endoderm (DE) cells in sufficient numbers is a prerequisite for cell-replacement therapy for liver and pancreatic diseases. Previously, we reported that human adipose-derived mesenchymal stem cells (hAMSCs) can be induced to DE lineages and subsequent functional cells. Clarifying the regulatory mechanisms underlying the fate conversion from hAMSCs to DE is helpful for developing new strategies to improve the differentiation efficiency from hAMSCs to DE organs. Long noncoding RNAs (lncRNAs) have been shown to play pivotal roles in developmental processes, including cell fate determination and differentiation. In this study, we profiled the expression changes of lncRNAs and found that antidifferentiation noncoding RNA (ANCR) was downregulated during the differentiation of both hAMSCs and embryonic stem cells (ESCs) to DE cells. ANCR knockdown resulted in the elevated expression of DE markers in hAMSCs, but not in ESCs. ANCR overexpression reduced the efficiency of hAMSCs to differentiate into DE cells. Inhibitor of DNA binding 2 (ID2) was notably downregulated after ANCR knockdown. ID2 knockdown enhanced DE differentiation, whereas overexpression of ID2 impaired this process in hAMSCs. ANCR interacts with RNA-binding polypyrimidine tract-binding protein 1 (PTBP1) to facilitate its association with ID2 mRNA, leading to increased ID2 mRNA stability. Thus, the ANCR/PTBP1/ID2 network restricts the differentiation of hAMSCs toward DE. Our work highlights the inherent discrepancies between hAMSCs and ESCs. Defining hAMSC-specific signaling pathways might be important for designing optimal differentiation protocols for directing hAMSCs toward DE.


Conflict of interest statement

The authors declare that they have no conflict of interest.

Figures

Fig. 1
Fig. 1. ANCR was dramatically downregulated during the differentiation of hAMSCs to DE.
a qRT-PCR analysis for DE marker genes (SOX17, FOXA2, and CXCR4), mesendoderm marker genes (EOMES and GSC), mesoderm marker KDR and the ectoderm marker PAX6 in hAMSCs on days 0, 3, and 5 after DE induction. b The western blot assay for DE markers (SOX17 and FOXA2) in hAMSCs at the indicated time points after DE induction. c Immunofluorescence (IF) staining for DE markers (SOX17 and FOXA2) in ANCR-knockdown hAMSCs or control hAMSCs after DE induction. The nuclei were stained with Hoechst 33342. Scale bar = 100 μm. d Gene Ontology (GO) analysis on the commonly upregulated (top) or downregulated (bottom) coding genes in three donors derived from hAMSCs after DE induction at day 5 compared to hAMSCs at day 0. The y-axis shows the GO terms and the x-axis shows the statistical significance (negative logarithm of p value). e Hierarchical clustering of significantly changed lncRNA on day 3 or 5 after induction compared with day 0 in matched hAMSCs from three donors. f, g qRT-PCR analysis of ANCR levels in hAMSC (f) and ESC (g) at the indicated time points after DE induction. Data are shown as the means ± S.D. (n = 3). *p < 0.05, **p < 0.01, and ***p < 0.001
Fig. 2
Fig. 2. ANCR knockdown improved the differentiation of hAMSCs to DE.
a ANCR was silenced in hAMSCs using two independent siRNAs (si-ANCR-1 and si-ANCR-2). The knockdown efficiency was verified by qRT-PCR compared with the negative control (NC). b qRT-PCR analysis detected DE marker genes (SOX17, FOXA2, and CXCR4) in ANCR-knockdown hAMSCs or control hAMSCs on day 5 after DE induction. c Flow cytometry analysis of the FOXA2+/SOX17+ subpopulation in ANCR-knockdown hAMSCs or control hAMSCs after DE induction. d Western blot detected DE markers (SOX17 and FOXA2) in ANCR-knockdown hAMSCs or control hAMSCs on day 5 after DE induction. e ANCR was silenced in ESCs using two independent siRNAs (si-ANCR-1 and si-ANCR-2). The knockdown efficiency was verified by qRT-PCR compared with the negative control (NC). f, g qRT-PCR analysis of detected stem cell markers genes (OCT4 and NANOG) from ESCs (f) and DE marker genes (SOX17 and FOXA2) after DE induction (g) in ANCR-knockdown ESCs or control ESCs. Data are shown as the means ± S.D. (n = 3). *p < 0.05, **p < 0.01, and ***p < 0.001
Fig. 3
Fig. 3. Overexpression of ANCR inhibited the differentiation of hAMSCs to DE.
a hAMSCs were transduced with lentivirus overexpressing ANCR (Lenti-ANCR) or empty vectors (Lenti-NC). The efficiency of ectopic expression was verified by qRT-PCR. b qRT-PCR analysis for DE marker genes (SOX17, FOXA2, and CXCR4) in ANCR-overexpressing hAMSCs or control hAMSCs on day 5 after DE induction. c The western blot assay for DE markers (SOX17 and FOXA2) in ANCR-overexpressing hAMSCs or control hAMSCs on day 5 after DE induction. d Flow cytometry analysis of the FOXA2+/SOX17+ subpopulation in ANCR-overexpressing hAMSCs or control hAMSCs after DE induction. Data are shown as the means ± S.D. (n = 3). *p < 0.05, **p < 0.01, and ***p < 0.001
Fig. 4
Fig. 4. ANCR regulated the expression of ID2.
a Microarray analysis was performed in hAMSCs transfected with si-ANCR1, si-ANCR2, and si-NC after 48 h. The heatmap represented 172 differentially expressed genes after siRNA-mediated ANCR knockdown (fold change ≥2, expression value≥4, and p value < 0.05). The black arrowhead denotes ID2 in hAMSCs transfected with si-ANCR versus si-NC. b Enriched GO terms for ANCR-affected genes. The y-axis shows GO terms and the x-axis shows statistical significance (negative logarithm of p value). c qRT-PCR analysis of ID2 in hAMSCs transfected with si-ANCR versus si-NC (left) or in hAMSCs overexpressing ANCR (Lenti-ANCR) versus empty vectors (Lenti-NC) (right). d Western blot detected the expression of ID2 in hAMSCs with ANCR knockdown (left) and overexpression (right). e Fractionation of ANCR in hAMSCs followed by qRT-PCR. GAPDH served as cytoplasmic mRNA control. U1 served as a nuclear RNA control. f mRNA decay detected by qRT-PCR in ANCR-knockdown hAMSCs (top), overexpression hAMSCs (bottom), and their corresponding controls. Data are shown as the means ± S.D. (n = 3). *p < 0.05, **p < 0.01, and ***p < 0.001
Fig. 5
Fig. 5. ID2 negatively regulates the differentiation of hAMSCs to DE.
a ID2 was silenced in hAMSCs using two independent siRNAs (si-ID2-2 and si-ID2-3). The knockdown efficiency was verified by qRT-PCR compared with the negative control (NC). b qRT-PCR analysis detected DE marker genes (SOX17, FOXA2, and CXCR4) in ID2-knockdown hAMSCs and control hAMSCs on day 5 after DE induction. c Western blot detected the expression of ID2, SOX17, and FOXA2 in ID2-knockdown hAMSCs and control hAMSCs on day 5 after DE induction. d Flow cytometry analysis of the FOXA2+/SOX17+ subpopulation in si-ID2 hAMSC or si-NC hAMSCs on day 5 after DE induction. e hAMSCs were transduced with lentivirus overexpressing ID2 (Lenti-ID2) or empty vectors (Lenti-NC). The efficiency of ectopic expression was verified by qRT-PCR. f qRT-PCR analysis detected DE marker genes (SOX17, FOXA2, and CXCR4) in Lenti-ID2 hAMSCs or Lenti-NC hAMSCs on day 5 after DE induction. g Western blot detected the expression of ID2, SOX17, and FOXA2 in Lenti-ID2 hAMSCs or Lenti-NC hAMSCs on day 5 after DE induction. h Flow cytometry analysis of the FOXA2+/SOX17+ subpopulation in lenti-ID2 hAMSCs or Lenti-NC hAMSCs on day 5 after DE induction. Data are shown as the means ± S.D. (n = 3). *p < 0.05, **p < 0.01, and ***p < 0.001
Fig. 6
Fig. 6. ID2 was responsible for ANCR-mediated DE differentiation in hAMSCs.
a Lenti-ID2 hAMSCs and Lenti-NC hAMSCs were transfected with siRNAs targeting ANCR or NC. The levels of ANCR and ID2 were detected by qRT-PCR. b qRT-PCR analysis detected DE marker genes (SOX17, FOXA2, and CXCR4) in Lenti-ID2 hAMSCs and Lenti-NC hAMSCs transfected with siRNAs targeting ANCR or NC, respectively, on day 5 after DE induction. c Western blot detected the expression of SOX17 and FOXA2 in Lenti-ID2 hAMSCs and Lenti-NC hAMSCs that transfected with siRNAs targeting ANCR or NC, respectively, on day 5 after DE induction. Data are shown as the means ± S.D. (n = 3). *p < 0.05, **p < 0.01, and ***p < 0.001
Fig. 7
Fig. 7. ANCR regulates ID2 mRNA stability by binding to PTBP1.
a In vitro the RNA pull-down assay. hAMSCs lysates were incubated with biotin-labelled sense or antisense ANCR RNAs. After pull down, the proteins were subjected to SDS-PAGE and staining. The band indicated by the arrow was subjected to mass spectrometry. b Western blot analysis for PTBP1 or Vimentin following RNA pull down with biotin-labelled sense or antisense ID2 or ANCR. Antisense RNAs incubated with hAMSCs were used as nonspecific controls. c The RIP assay for PTBP1 enriched with ANCR (left) and ID2 (right) in hAMSCs. IgG was used as a negative control. All relative abundances were compared to 1% input. d PTBP1 was silenced in hAMSCs using two independent siRNAs (si-PTBP1-1 and si-PTBP1-2). The knockdown efficiency and expression of ANCR and ID2 were verified by qRT-PCR compared with si-NC. e hAMSCs transfected with si-PTBP1s or si-NC were treated with actinomycin D (5 μg/mL) and RNA was extracted at different time points (0, 2, and 4 h). The levels of ANCR and ID2 were analysed by qRT-PCR and normalized to GAPDH. mRNA at 0 h served as a reference. f The RNA pull down assay to determine the interaction between PTBP1 protein and ID2 mRNA in Lenti-Ctrl or Lenti-ANCR hAMSCs. Data are shown as the means ± S.D. (n = 3). *p < 0.05, **p < 0.01, and ***p < 0.001

References

    1. Yasunaga M, et al. Induction and monitoring of definitive and visceral endoderm differentiation of mouse ES cells. Nat. Biotechnol. 2005;23:1542–1550. doi: 10.1038/nbt1167. - DOI - PubMed
    1. Schiesser JV, Wells JM. Generation of beta cells from human pluripotent stem cells: are we there yet? Ann. N. Y. Acad. Sci. 2014;1311:124–137. doi: 10.1111/nyas.12369. - DOI - PMC - PubMed
    1. Zorn AM, Wells JM. Vertebrate endoderm development and organ formation. Annu. Rev. Cell Dev. Biol. 2009;25:221–251. doi: 10.1146/annurev.cellbio.042308.113344. - DOI - PMC - PubMed
    1. Hannan NR, Segeritz CP, Touboul T, Vallier L. Production of hepatocyte-like cells from human pluripotent stem cells. Nat. Protoc. 2013;8:430–437. doi: 10.1038/nprot.2012.153. - DOI - PMC - PubMed
    1. D’Amour KA, et al. Efficient differentiation of human embryonic stem cells to definitive endoderm. Nat. Biotechnol. 2005;23:1534–1541. doi: 10.1038/nbt1163. - DOI - PubMed

Publication types

MeSH terms

Substances