. 2019 Jun 24;10(1):2767.
doi: 10.1038/s41467-019-10712-0.

Skeletal muscle PGC-1α1 reroutes kynurenine metabolism to increase energy efficiency and fatigue-resistance

Affiliations

Skeletal muscle PGC-1α1 reroutes kynurenine metabolism to increase energy efficiency and fatigue-resistance

Leandro Z Agudelo et al. Nat Commun. .

Abstract

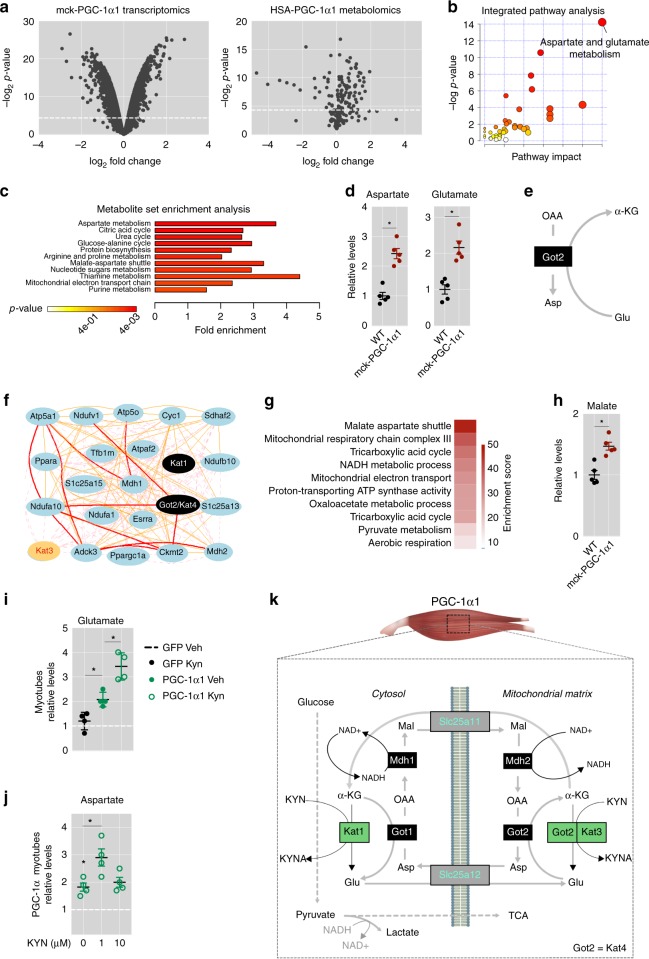
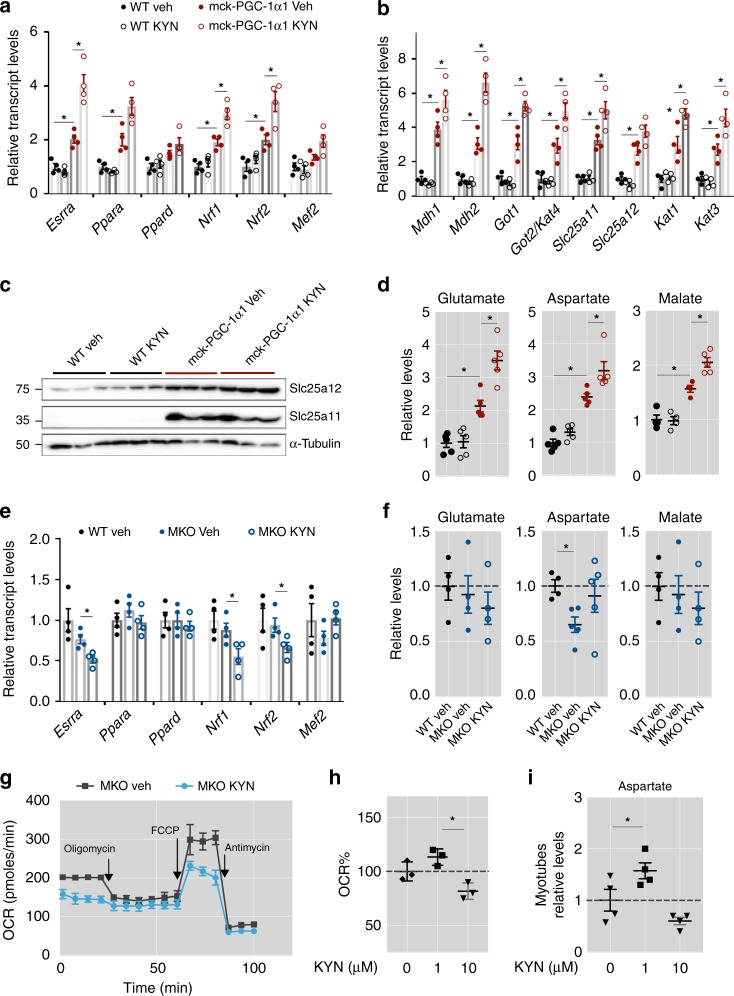
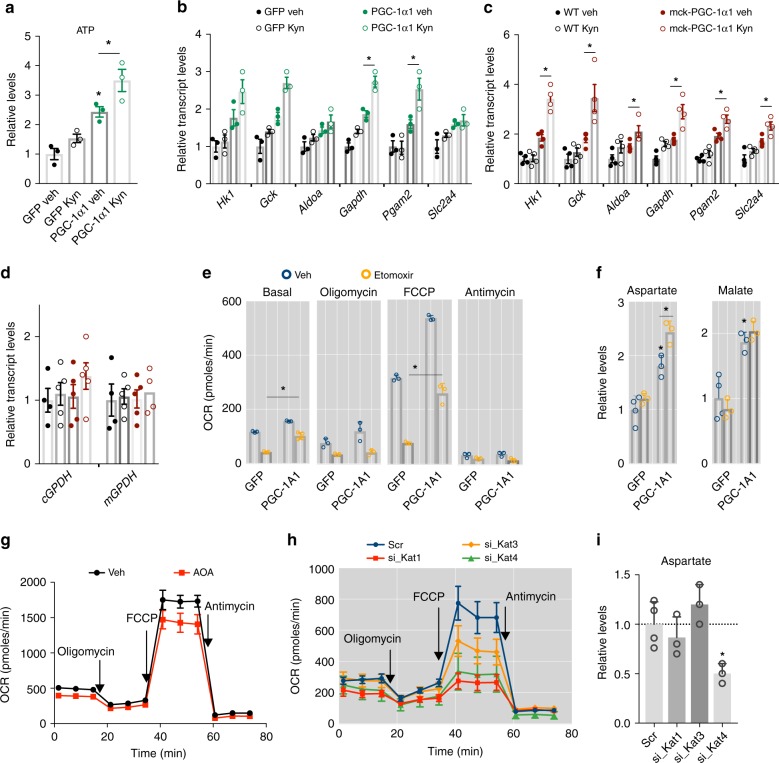
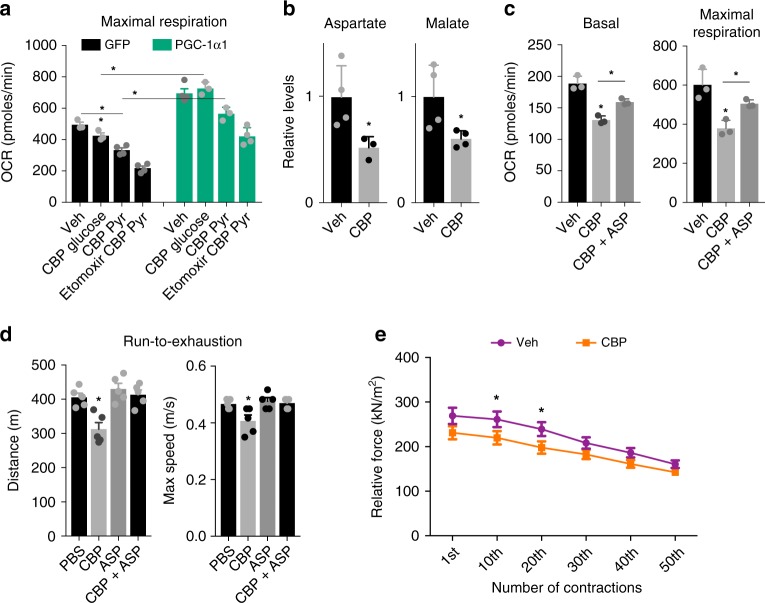
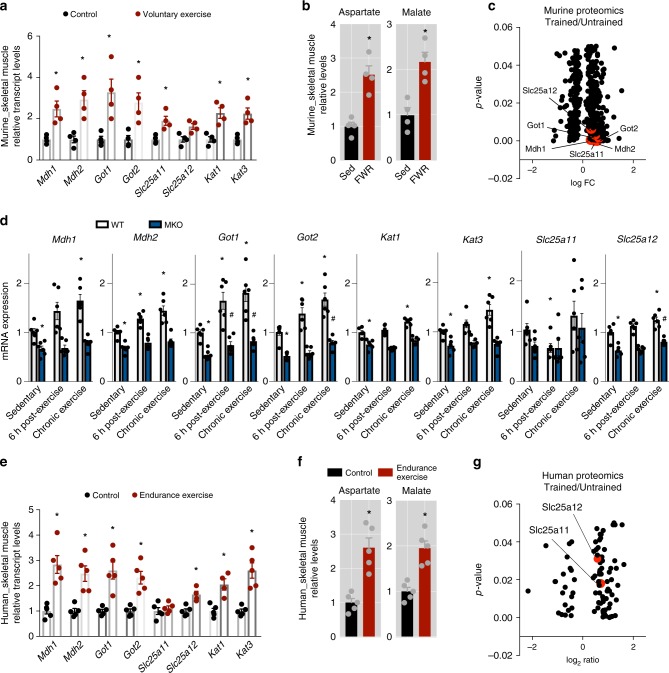
The coactivator PGC-1α1 is activated by exercise training in skeletal muscle and promotes fatigue-resistance. In exercised muscle, PGC-1α1 enhances the expression of kynurenine aminotransferases (Kats), which convert kynurenine into kynurenic acid. This reduces kynurenine-associated neurotoxicity and generates glutamate as a byproduct. Here, we show that PGC-1α1 elevates aspartate and glutamate levels and increases the expression of glycolysis and malate-aspartate shuttle (MAS) genes. These interconnected processes improve energy utilization and transfer fuel-derived electrons to mitochondrial respiration. This PGC-1α1-dependent mechanism allows trained muscle to use kynurenine metabolism to increase the bioenergetic efficiency of glucose oxidation. Kat inhibition with carbidopa impairs aspartate biosynthesis, mitochondrial respiration, and reduces exercise performance and muscle force in mice. Our findings show that PGC-1α1 activates the MAS in skeletal muscle, supported by kynurenine catabolism, as part of the adaptations to endurance exercise. This crosstalk between kynurenine metabolism and the MAS may have important physiological and clinical implications.


Conflict of interest statement

The authors declare no competing interests.

Figures

Fig. 1
Fig. 1
Regulatory hubs under PGC-1α1 control in skeletal muscle. a Transcriptomics and metabolomics analysis of mck-PGC-1α1 skeletal muscle. b Integrated pathway analysis of mck-PGC-1α1 transcriptomics and metabolomics. c Metabolite enrichment analysis of mck-PGC-1α1. d Relative levels of aspartate and glutamate in skeletal muscle of wt and mck-PGC-1α1 mice (n = 5). e Schematic representation of the role of GOT2 in aspartate synthesis. f Overlapping Kat-associated networks. g Functional annotation of the Kat-associated network. h Relative levels of malate in skeletal muscle of wt and mck-PGC-1α1 mice (n = 5). i Relative levels of glutamate in primary myotubes transduced with Gfp control or Pgc-1α1 adenovirus and supplemented with 1 μM kynurenine (Kyn) (n = 4) j Relative levels of aspartate in primary myotubes transduced with Pgc-1α1 adenovirus treated with 0, 1 or 10 μM Kyn (n = 4). k Schematic representation of how skeletal muscle PGC-1α1 integrates Kyn metabolism with aspartate biosynthesis and the malate-aspartate shuttle. Bars depict mean values and error bars indicate SEM. Unpaired, two-tailed student’s t-test was used when two groups were compared, and one-way analysis of variance (ANOVA) followed by Fisher’s least significance difference (LSD) test for post hoc comparisons were used to compare multiple groups, *p < 0.05
Fig. 2
Fig. 2
PGC-1α1 reroutes kynurenine catabolism to support aspartate biosynthesis. a Relative transcript levels of mitochondrial related genes in skeletal muscle of wt and mck-PGC-1α1 mice with a single intraperitoneal dose of kynurenine (Kyn, 2.5 mg/kg) (n = 4). b Relative transcript expression of genes involved in malate-aspartate metabolism in skeletal muscle of wt and mck-PGC-1α1 mice treated as in a. c Protein levels of the malate-aspartate shuttle constituents SLC25A11 and SLC25A12 in skeletal muscle of wt and mck-PGC-1α1 mice with a single intraperitoneal dose of Kyn. Uncropped western blots are found as Supplementary Fig. 7. d Relative levels of glutamate, aspartate and malate in skeletal muscle of mck-PGC-1α1 mice treated as in a. e Relative transcript levels of mitochondrial related genes in skeletal muscle of wt and MKO-PGC-1α mice with a single intraperitoneal dose of Kyn (n = 4). f Relative levels of glutamate, aspartate and malate in skeletal muscle of wt and MKO-PGC-1α mice with a single intraperitoneal dose of Kyn (n = 4). g Extracellular Flux Analysis (SeahorseTM) of cellular respiration in primary myotubes from MKO-PGC-1α supplemented with PBS (veh) or with 1 μM Kyn (n = 4). h Percentage of basal oxygen consumption rate in primary myotubes supplemented with 1 and 10 μM of kynurenine (Kyn) (n = 4). i Relative levels of aspartate in primary myotubes transduced with Pgc-1α1 adenovirus and treated as in h (n = 4). Bars depict mean values and error bars indicate SEM. Unpaired, two-tailed student’s t-test was used when two groups were compared, and one-way analysis of variance (ANOVA) followed by Fisher’s least significance difference (LSD) test for post hoc comparisons were used to compare multiple groups, *p < 0.05
Fig. 3
Fig. 3
The bioenergetic role of Kat/malate-aspartate shuttle integration in skeletal muscle. a Relative levels of ATP in primary myotubes transduced with Gfp control or Pgc-1α1 adenovirus supplemented with 1 μM kynurenine (Kyn) (n = 4). b Relative transcript levels of glycolytic genes in primary myotubes transduced with Gfp control or Pgc-1α1 adenovirus and supplemented with 1 μM Kyn (n = 4). c Relative transcript levels of glycolytic genes in skeletal muscle of wt and mck-PGC-1α1 mice with a single intraperitoneal dose of Kyn (2.5 mg/kg) (n = 4). d Relative transcript levels of glycerol-3-phosphate shuttle genes in skeletal muscle of wt and mck-PGC-1α1 mice treated as in c. e Cellular respiration measured by Extracellular Flux Analysis (SeahorseTM) in primary myotubes transduced with Gfp control or Pgc-1α1 adenovirus and supplemented with 50 μM Etomoxir for 1 h (n = 4). f Relative levels of aspartate and malate in primary myotubes transduced with Gfp control or Pgc-1α1 adenovirus and supplemented with 50 μM Etomoxir for 1 h (n = 4). g Cellular respiration measured as in e of primary myotubes supplemented with 100 μM aminooxyacetate (AOA) for 1 h (n = 4). h Cellular respiration measured as in e of primary myotubes transfected with scrambled siRNA, or siRNAs for Kat1, Kat3 or Got2/Kat4 (n = 4). i Relative levels of aspartate in primary myotubes transfected as in h. Bars depict mean values and error bars indicate SEM. Unpaired, two-tailed student’s t-test was used when two groups were compared, and one-way analysis of variance (ANOVA) followed by Fisher’s least significance difference (LSD) test for post hoc comparisons were used to compare multiple groups, *p < 0.05
Fig. 4
Fig. 4
Kat-inhibition by carbidopa impairs malate-aspartate metabolism in skeletal muscle. a Maximal respiration measured by Extracellular Flux Analysis (SeahorseTM), in the presence of Glucose or Pyruvate (Pyr), in primary myotubes transduced with Gfp control or Pgc-1α1 adenovirus and supplemented with 40 μM carbidopa (CBP) for 24 h and/or 50 μM Etomoxir for 1 h (n = 4). b Relative levels of aspartate and malate in primary myotubes supplemented with 40 μM carbidopa for 24 h. c Basal and maximal respiration of primary myotubes supplemented with 40 μM carbidopa for 24 h or 40 μM carbidopa for 24 h followed by 100 μM aspartate (ASP) for 1 h. d Mouse exercise performance test shown as distance and maximal speed after 4 days of intraperitoneal injection of PBS, carbidopa, aspartate or carbidopa + aspartate (n = 5). e Tetanic force was measured at 70 Hz force with 350 ms tetani at 2 s intervals for 50 contractions in skeletal muscle of mice after 4 days of intraperitoneal injection of PBS or carbidopa (n = 4). Bars depict mean values and error bars indicate SEM. Unpaired, two-tailed student’s t-test was used when two groups were compared, and one-way analysis of variance (ANOVA) followed by Fisher’s least significance difference (LSD) test for post hoc comparisons were used to compare multiple groups, *p < 0.05
Fig. 5
Fig. 5
Endurance exercise effects in both murine and human skeletal muscle. a Relative transcript levels of genes involved in malate-aspartate metabolism in skeletal muscle of sedentary wild-type mice and wild-type mice with access to free-wheel running (FWR) for 8 weeks. Mice were sacrificed 12 h after the last bout of exercise (n = 4). b Relative levels of aspartate and malate in skeletal muscle of sedentary and wild-type mice with access to FWR (n = 4). c Compared proteomics from skeletal muscle of trained and untrained mice. d Relative transcript levels of genes involved in malate-aspartate metabolism in skeletal muscle of sedentary, acutely and chronically exercised wt and MKO-PGC-1α mice (n = 5–6). e Expression of genes involved in malate-aspartate metabolism in skeletal muscle of human volunteers after endurance exercised (n = 5). f Relative levels of aspartate and malate in skeletal muscle of human volunteers after endurance exercise (n = 5). g Compared proteomics from skeletal muscle of human volunteers after endurance exercise,,. Bars depict mean values and error bars indicate SEM. Unpaired, two-tailed student’s t-test was used when two groups were compared, and one-way analysis of variance (ANOVA) followed by Fisher’s least significance difference (LSD) test for post hoc comparisons were used to compare multiple groups, *p < 0.05

References

    1. Correia JC, Ferreira DMS, Ruas JL. Intercellular: local and systemic actions of skeletal muscle PGC-1s. Trends Endocrinol. Metab. 2015;26:305–314. doi: 10.1016/j.tem.2015.03.010. - DOI - PubMed
    1. Puigserver P, et al. A cold-inducible coactivator of nuclear receptors linked to adaptive thermogenesis. Cell. 1998;92:829–839. doi: 10.1016/S0092-8674(00)81410-5. - DOI - PubMed
    1. Martínez-Redondo V, Pettersson AT, Ruas JL. The hitchhiker’s guide to PGC-1α isoform structure and biological functions. Diabetologia. 2015;58:1969–1977. doi: 10.1007/s00125-015-3671-z. - DOI - PubMed
    1. Ruas JL, et al. A PGC-1α isoform induced by resistance training regulates skeletal muscle hypertrophy. Cell. 2012;151:1319–1331. doi: 10.1016/j.cell.2012.10.050. - DOI - PMC - PubMed
    1. Lin J, et al. Transcriptional co-activator PGC-1α drives the formation of slow-twitch muscle fibres. Nature. 2002;418:797–801. doi: 10.1038/nature00904. - DOI - PubMed

Publication types

MeSH terms