. 2019 Jun 24;10(1):2762.
doi: 10.1038/s41467-019-10399-3.

Amplification of future energy demand growth due to climate change

Affiliations

Amplification of future energy demand growth due to climate change

Bas J van Ruijven et al. Nat Commun. .

Abstract

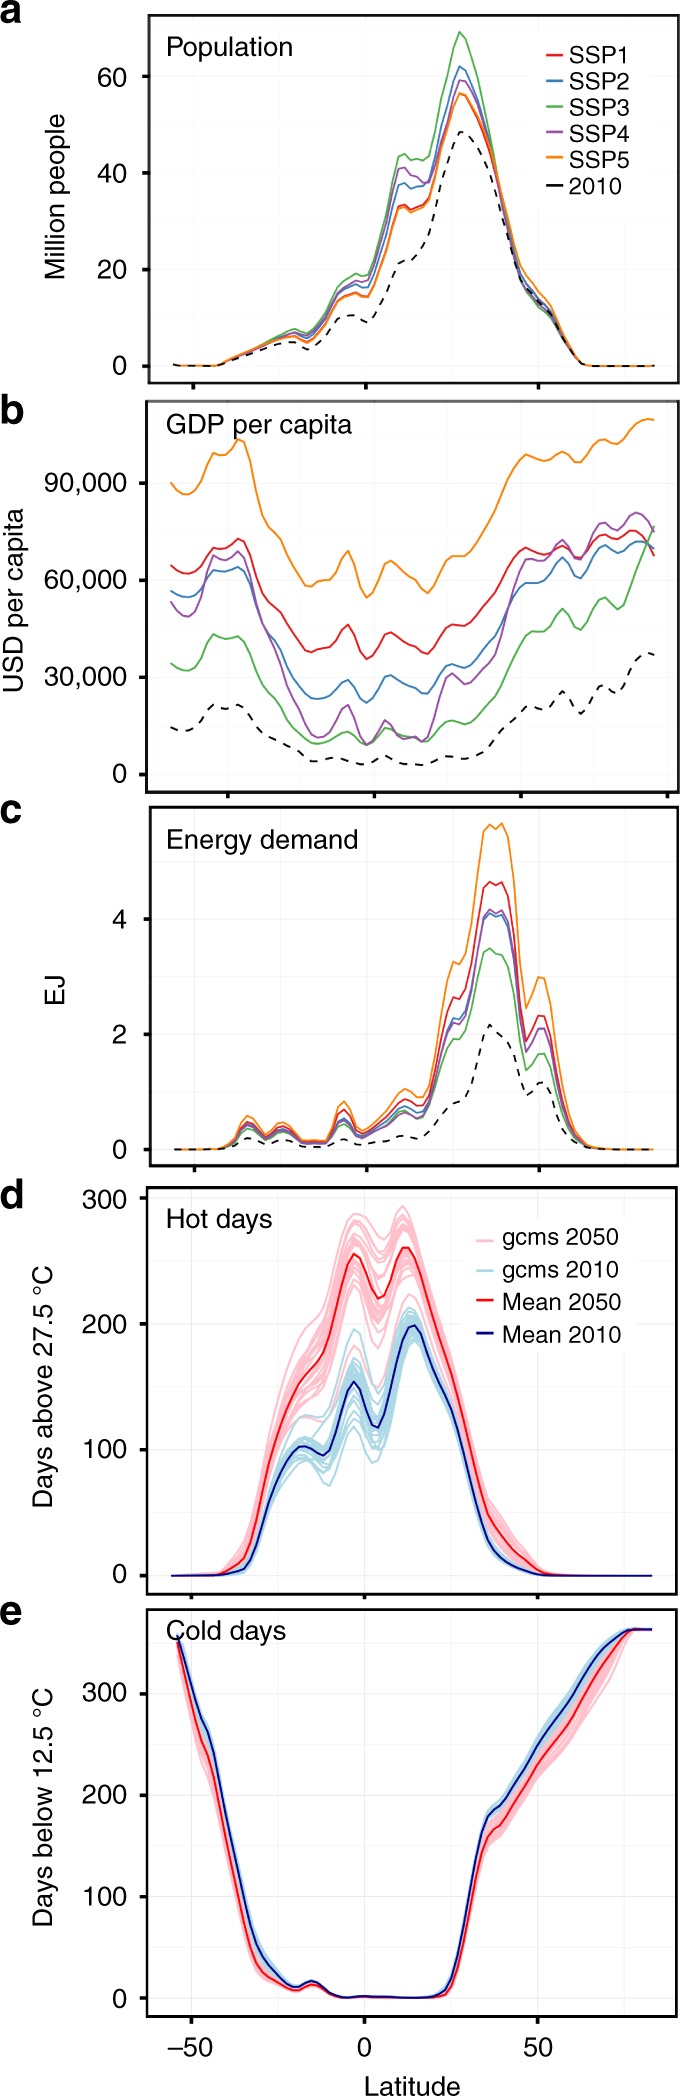
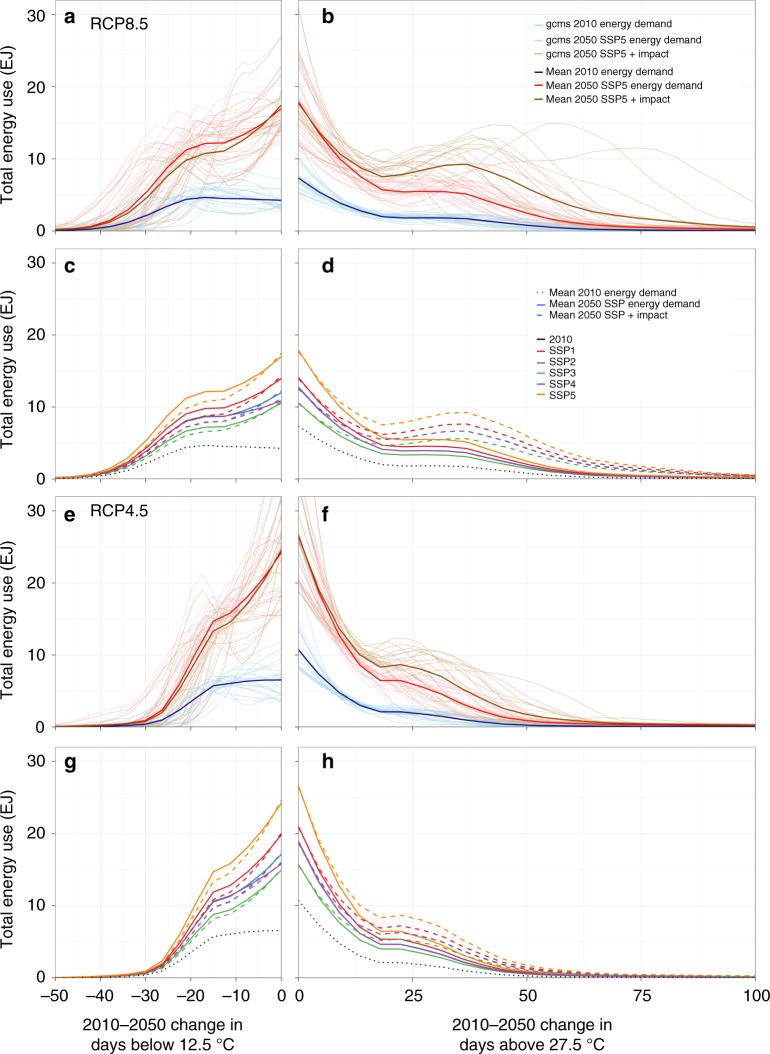
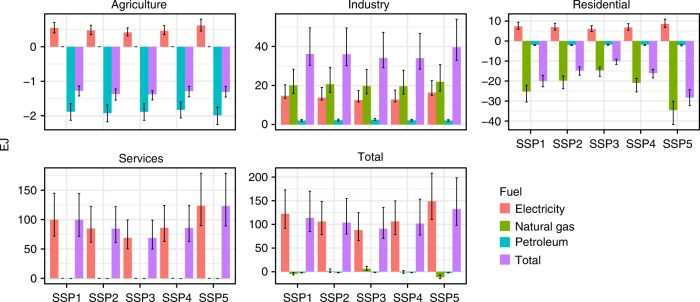
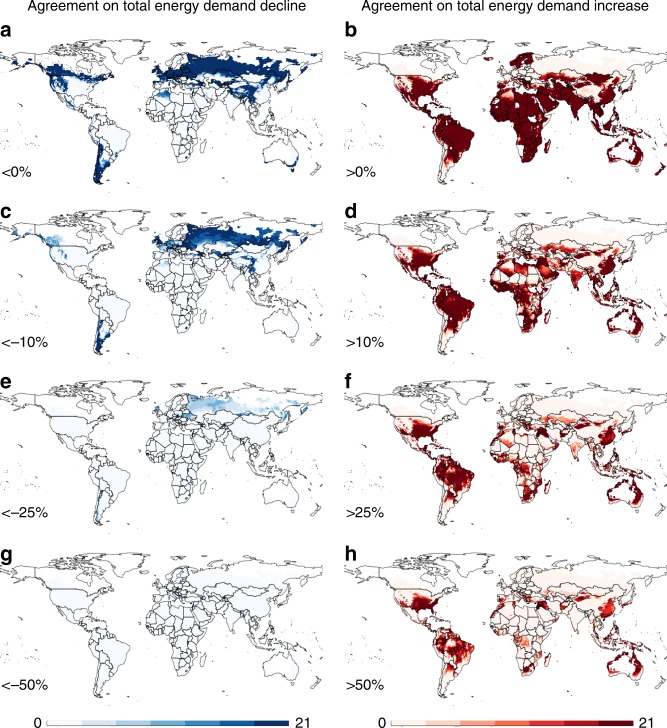
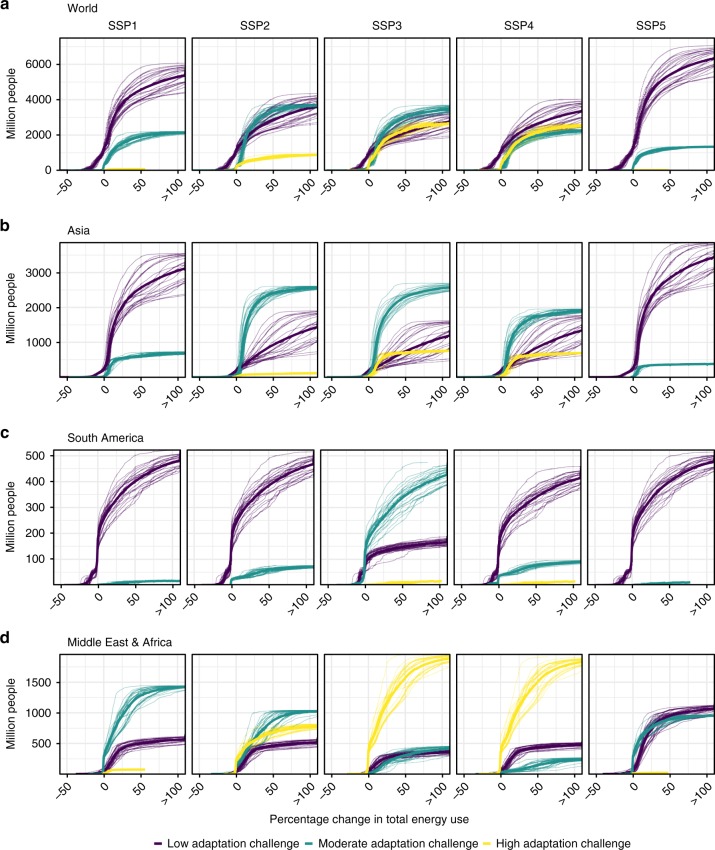
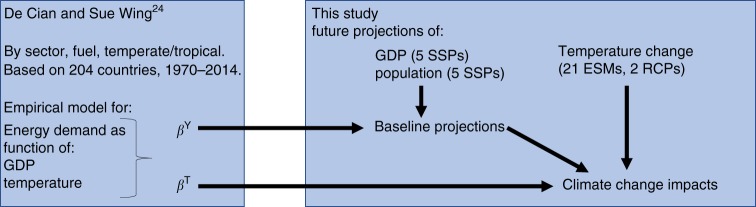
Future energy demand is likely to increase due to climate change, but the magnitude depends on many interacting sources of uncertainty. We combine econometrically estimated responses of energy use to income, hot and cold days with future projections of spatial population and national income under five socioeconomic scenarios and temperature increases around 2050 for two emission scenarios simulated by 21 Earth System Models (ESMs). Here we show that, across 210 realizations of socioeconomic and climate scenarios, vigorous (moderate) warming increases global climate-exposed energy demand before adaptation around 2050 by 25-58% (11-27%), on top of a factor 1.7-2.8 increase above present-day due to socioeconomic developments. We find broad agreement among ESMs that energy demand rises by more than 25% in the tropics and southern regions of the USA, Europe and China. Socioeconomic scenarios vary widely in the number of people in low-income countries exposed to increases in energy demand.


Conflict of interest statement

The authors declare no competing interests.

Figures

Fig. 1
Fig. 1
Changes in the main drivers of energy demand between 2010 and 2050. The data are smoothed and summarized by latitude: population (a), GDP per capita (b), baseline projections of the total climate-related final energy demand without climate-change impacts as a result of combining our elasticities with GDP and population projections (c) number of days with daily average temperature above 27.5 °C (d), number of days with daily average temperature below 12.5 °C (e) under RCP 8.5. Supplementary Fig. 6 provides a version of this figure for RCP 4.5
Fig. 2
Fig. 2
The total energy demand exposed to changes in cold and hot days. The upper half displays the results for RCP 8.5, the bottom half for RCP 4.5. In the detailed panels (a, b, e, f) the blue lines depict present-day energy demand, and the red lines depict SSP5 baseline energy demand for 2050; brown lines indicate energy use under SSP5 after impacts of climate change (mean and all 21 individual ESMs) exposed to changes in hot and cold days. Aggregate panels (c, d, g, h) show the multi-ESM mean for all five SSPs. Impacts from climate change are only shown for changes in hot (b, d, f, h) or cold (a, c, e, g) days; combined impacts are shown in Supplementary Fig. 7
Fig. 3
Fig. 3
Global total energy demand amplification from climate change around 2050 under RCP 8.5. Solid bars represent the median of 21 ESM model simulations, error bars represent the interquartile range of change in energy demand across 21 ESM simulations (see Supplementary Fig. 8 for RCP 4.5 results)
Fig. 4
Fig. 4
Agreement across ESMs on changes in final energy demand. Maps depict the number of climate models that agree on decreases and increases in total energy demand across sectors and energy carriers by more than 0% (a, b), 10% (c, d), 25% (e, f), or 50% (g, h) by 2050 under RCP 8.5 and SSP5, as a result of temperature projections and changes in both hot and cold days (see Supplementary Fig. 9 for RCP 4.5 results)
Fig. 5
Fig. 5
Exposure of people with different adaptation challenges to changes in energy demand. Cumulative distribution of the number of people exposed to percentage change in climate-related final energy demand by country GDP per capita. Panels represent global results (a) and three major developing world regions: Asia (b), South America (c), and Middle East and Africa (d). Lines indicate the multi-model mean and all individual 21 CMIP5 models by 2050 under RCP 8.5. Present-day World Bank definitions for GDP per capita were used to classify countries in income categories, which we used as a proxy for adaptation challenges (GDP per capita <6000 USD/yr for high-adaptation challenge, 6000–15,000 USD/yr for moderate-adaptation challenge, and >15,000 USD/yr for low-adaptation challenge, see Supplementary Note 2 for detailed discussion). Supplementary Fig. 3 presents a version of this figure for RCP 4.5 and Supplementary Figs 1, 2 present the results by sector and fuel
Fig. 6
Fig. 6
Brief overview of the methodology of this study and its relation to De Cian and Sue Wing (2018). De Cian and Sue Wing (2018) estimated elasticities of energy use with changes in temperature (βT) and GDP per capita (βY). This study combines these elasticities with GDP and population projections for the SSPs to establish baseline projection and with temperature projections from 21 climate models to analyze climate change impacts

References

    1. Arent, D. J. et al. in Climate Change 2014: Impacts, Adaptation, and Vulnerability. Part A: Global and Sectoral Aspects. Contribution of Working Group II to the Fifth Assessment Report of the Intergovernmental Panel of Climate Change (eds. Field, C. B. et al.) 659–708 (Cambridge University Press, 2014).
    1. Schaeffer R, et al. Energy sector vulnerability to climate change: a review. Energy. 2012;38:1–12. doi: 10.1016/j.energy.2011.11.056. - DOI
    1. IEA. The Future of Cooling - Opportunities for energy-efficient air conditioning. https://www.iea.org/futureofcooling/ (International Energy Agency, 2018).
    1. Considine TJ. The impacts of weather variations on energy demand and carbon emissions. Resour. Energy Econ. 2000;22:295–314. doi: 10.1016/S0928-7655(00)00027-0. - DOI
    1. Auffhammer M, Mansur ET. Measuring climatic impacts on energy consumption: A review of the empirical literature. Energy Econ. 2014;46:522–530. doi: 10.1016/j.eneco.2014.04.017. - DOI

Publication types