. 2019 Jun 24;9(1):9104.
doi: 10.1038/s41598-019-45540-1.

Caffeine exposure induces browning features in adipose tissue in vitro and in vivo

Affiliations

Caffeine exposure induces browning features in adipose tissue in vitro and in vivo

Ksenija Velickovic et al. Sci Rep. .

Abstract

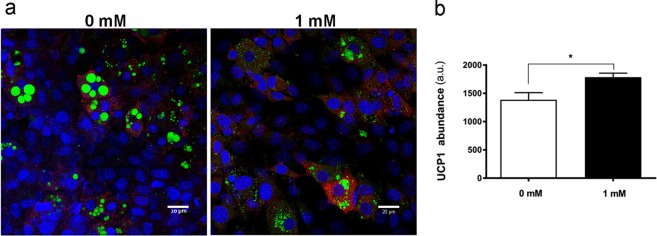
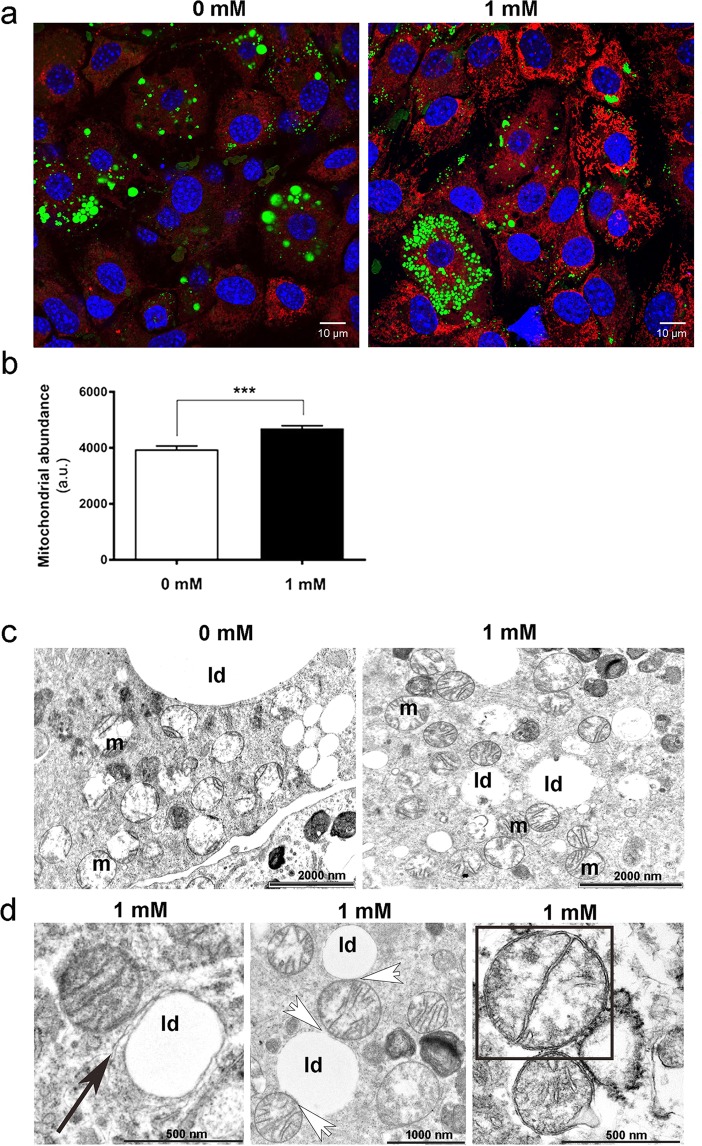
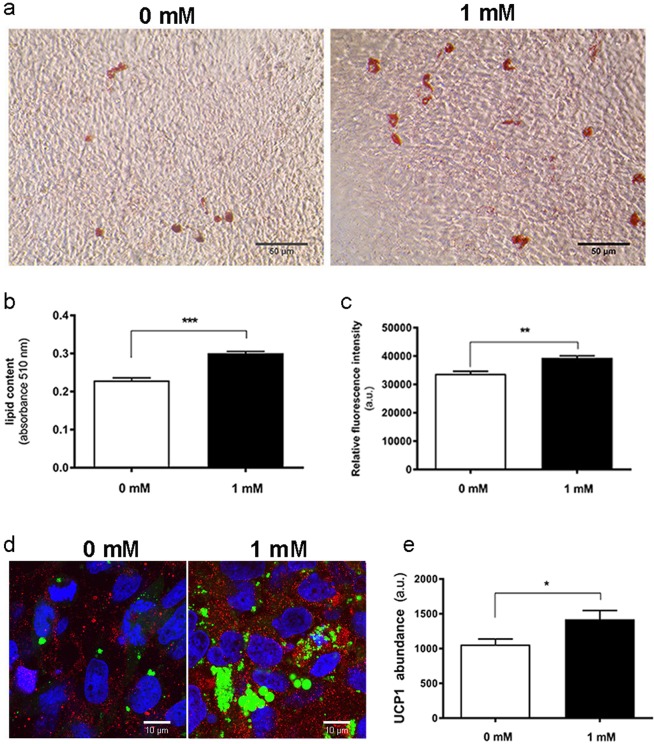
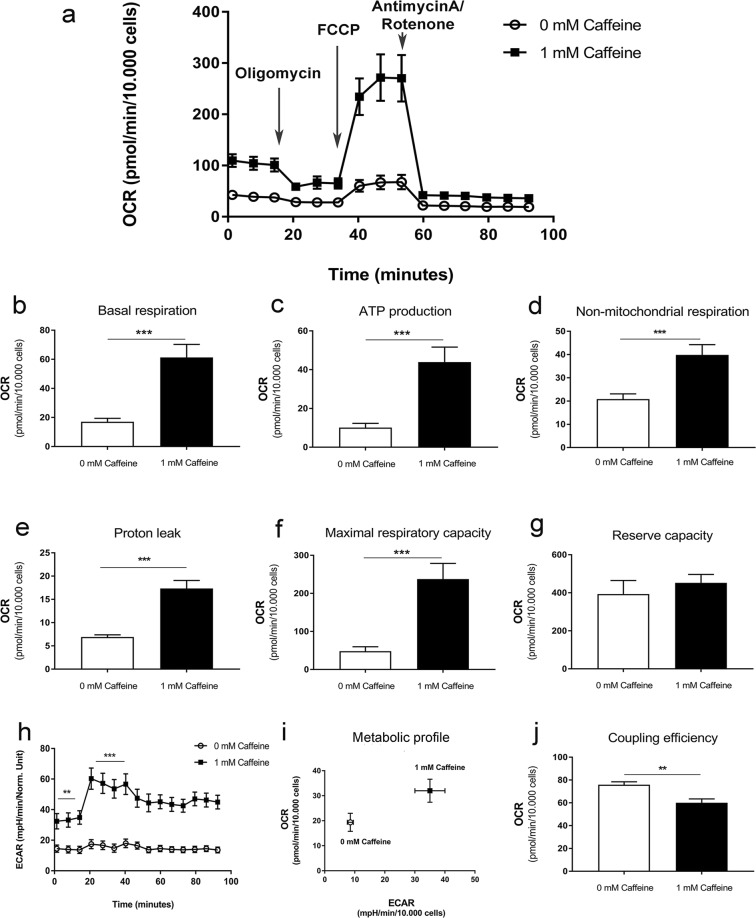
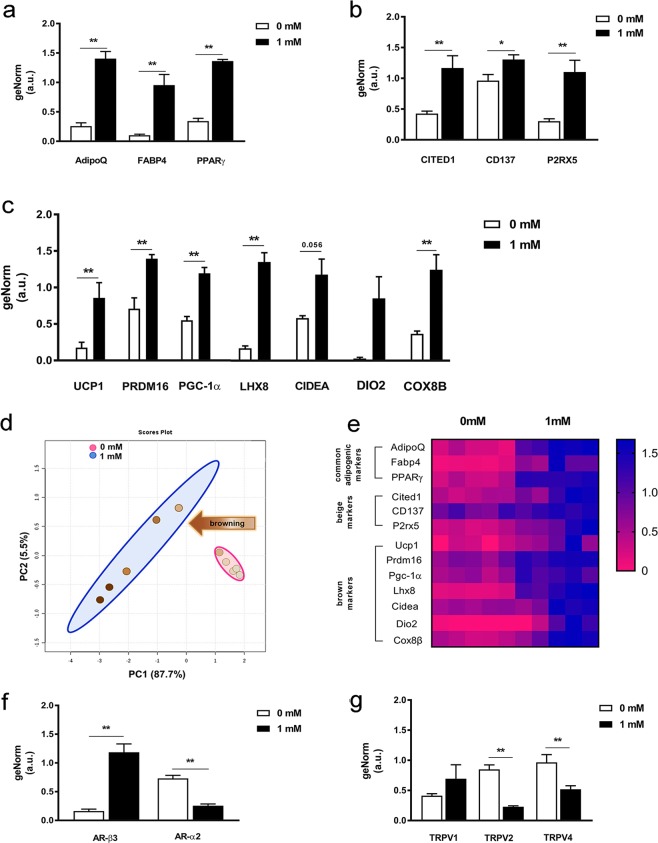
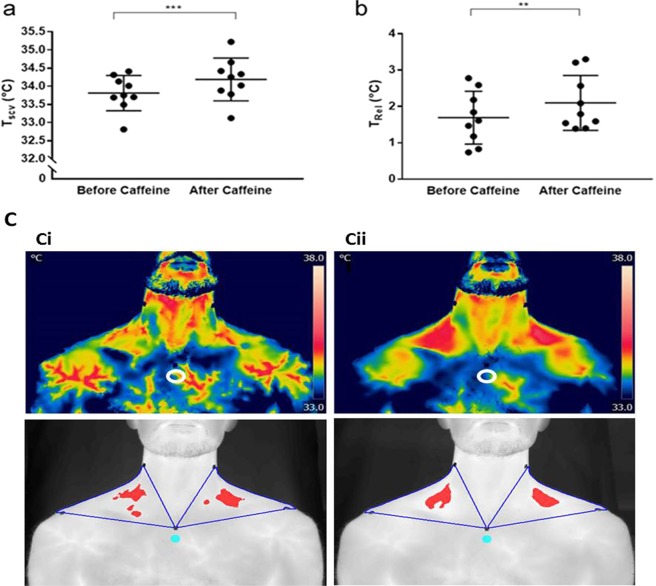
Brown adipose tissue (BAT) is able to rapidly generate heat and metabolise macronutrients, such as glucose and lipids, through activation of mitochondrial uncoupling protein 1 (UCP1). Diet can modulate UCP1 function but the capacity of individual nutrients to promote the abundance and activity of UCP1 is not well established. Caffeine consumption has been associated with loss of body weight and increased energy expenditure, but whether it can activate UCP1 is unknown. This study examined the effect of caffeine on BAT thermogenesis in vitro and in vivo. Stem cell-derived adipocytes exposed to caffeine (1 mM) showed increased UCP1 protein abundance and cell metabolism with enhanced oxygen consumption and proton leak. These functional responses were associated with browning-like structural changes in mitochondrial and lipid droplet content. Caffeine also increased peroxisome proliferator-activated receptor gamma coactivator 1-alpha expression and mitochondrial biogenesis, together with a number of BAT selective and beige gene markers. In vivo, drinking coffee (but not water) stimulated the temperature of the supraclavicular region, which co-locates to the main region of BAT in adult humans, and is indicative of thermogenesis. Taken together, these results demonstrate that caffeine can promote BAT function at thermoneutrality and may have the potential to be used therapeutically in adult humans.


Conflict of interest statement

The authors declare no competing interests.

Figures

Figure 1
Figure 1
Effect of caffeine on immunofluorescence analysis of UCP1 abundance in adipogenic cultures. (a) Representative images showing upregulation of UCP1 (red) in mMSCs. DAPI was used to identify cell nuclei (blue) and BODIPY was used to identify lipid droplets (green). (b) Mean relative UCP1 abundance (n = 20). Scale bars: 20 μm; *P < 0.05.
Figure 2
Figure 2
Adaptations in the mitochondrial compartment of adipocytes following 1 mM caffeine treatment. (a) Representative images showing mitochondrial staining (MitoTracker, red). DAPI was used to identify nuclei (blue) and BODIPY was used to identify lipid droplet (green). (b) Relative MitoTracker fluorescence intensity. (c,d) TEM analysis of mitochondria (m) and lipid droplets (ld), with (d) showing higher magnification views of caffeine-treated cells with contact sites between lipid droplets and endoplasmic reticulum (black arrow), contact sites between mitochondria and lipid droplets (white arrows), and mitochondria division (outlined square). Scale bar: 10 μm. ***P < 0.001.
Figure 3
Figure 3
hMSC response to caffeine exposure during a 21-day period of adipogenic differentiation. (a) Representative images of cells stained for lipid droplets with ORO (Scale bar: 50 μm) and mean (b) staining quantified spectrophotometrically. (c) Cell viability assay. (d) Representative images showing upregulation of UCP1 (red) in hMSCs. DAPI was used to identify cell nuclei (blue) and BODIPY was used to identify lipid droplets (green); scale bar: 10 μm and (e) mean relative UCP1 abundance (n = 20). Data presented as mean ± SEM; *P < 0.05; **P < 0.01; ***P < 0.001.
Figure 4
Figure 4
Seahorse XF cell mitochondrial stress test assay performed on mouse mesenchymal stem cell-derived adipocytes treated with or without caffeine for 7 days. (a) OCR profile plot. (b) Basal respiration. (c) ATP production. (d) Non-mitochondrial respiration. (e) Proton leak. (f) Maximal respiratory capacity. (g) Reserve capacity. (h) ECAR. (i) Summary metabolic profiles as determined by plotting ECAR against OCR. (j) Coupling efficiency. Histograms represent mean ± SEM. n = 3; **P < 0.01, ***P < 0.001.
Figure 5
Figure 5
Adipogenic gene expression analysis by qPCR during mMSCs differentiation treated with or without caffeine. Relative gene expression of (a) adipogenic markers AdipoQ, FABP4 and PPARγ, (b) beige lineage markers CITED1, CD137 and P2RX5, and (c) brown lineage markers UCP1, PRDM16, PGC-1α, LHX8, CIDEA, DIO2 and COX8b. (d) Scatter plot of the first two principal components, comprising 93.2% of total variance, highlighting two clusters corresponding to cells differentiated in adipogenic medium with 0 mM (pink) and 1 mM (blue) caffeine. (e) Unsupervised hierarchical clustering of expression values for the same genes and samples as those in panel D. Each row represents a gene while each column corresponds to a different sample. Gene expression of (f) AR-ß3 and AR-α2 and (g) TRPV1, TRPV2 and TRPV4. Data represent the mean ± SEM of five replicates; *P < 0.05; ***P < 0.001.
Figure 6
Figure 6
In vivo effect of drinking caffeine on heat production from brown fat in adult humans. (a) Caffeine resulted in a significant rise in temperature of the supraclavicular region (TSCV) which co-locates with brown fat and this reflects (b) increase in supraclavicular temperature relative to reference body surface temperature (Trel) (n = 9); (c) Representative thermal image (i) pre and (ii) post-caffeine, as either the original FLIR image, or the transformed image high-lighting the hottest 10% of pixels. ***P < 0.001; **P < 0.01. White open and blue closed circles indicate the reference temperature point.

Similar articles

Cited by

References

    1. Symonds Michael E., Aldiss Peter, Pope Mark, Budge Helen. Recent advances in our understanding of brown and beige adipose tissue: the good fat that keeps you healthy. F1000Research. 2018;7:1129. doi: 10.12688/f1000research.14585.1. - DOI - PMC - PubMed
    1. U Din Mueez, Saari Teemu, Raiko Juho, Kudomi Nobu, Maurer Stefanie F., Lahesmaa Minna, Fromme Tobias, Amri Ez-Zoubir, Klingenspor Martin, Solin Olof, Nuutila Pirjo, Virtanen Kirsi A. Postprandial Oxidative Metabolism of Human Brown Fat Indicates Thermogenesis. Cell Metabolism. 2018;28(2):207-216.e3. doi: 10.1016/j.cmet.2018.05.020. - DOI - PubMed
    1. Ouellet V, et al. Brown adipose tissue oxidative metabolism contributes to energy expenditure during acute cold exposure in humans. J Clin Invest. 2012;122:545–552. doi: 10.1172/JCI60433. - DOI - PMC - PubMed
    1. Cannon B, Nedergaard J. Brown adipose tissue: function and physiological significance. Physiol Rev. 2004;84:277–359. doi: 10.1152/physrev.00015.2003. - DOI - PubMed
    1. Nedergaard J, Bengtsson T, Cannon B. Unexpected evidence for active brown adipose tissue in adult humans. Am J Physiol Endocrinol Metab. 2007;293:E444–452. doi: 10.1152/ajpendo.00691.2006. - DOI - PubMed

Publication types

MeSH terms