. 2019 Jun 24;9(1):9096.
doi: 10.1038/s41598-019-43958-1.

Controlling for Artifacts in Widefield Optical Coherence Tomography Angiography Measurements of Non-Perfusion Area

Affiliations

Controlling for Artifacts in Widefield Optical Coherence Tomography Angiography Measurements of Non-Perfusion Area

Lucas R De Pretto et al. Sci Rep. .

Abstract

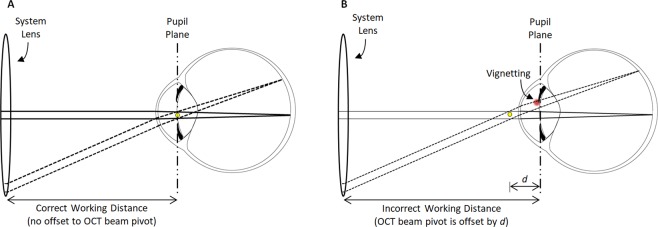
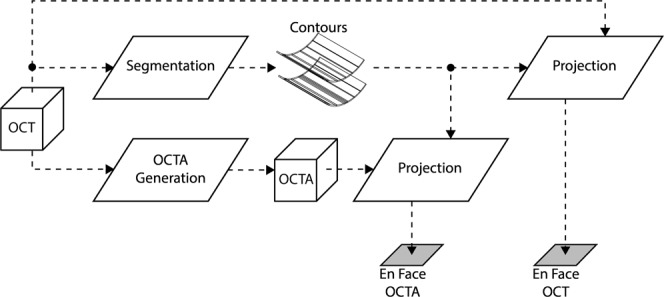
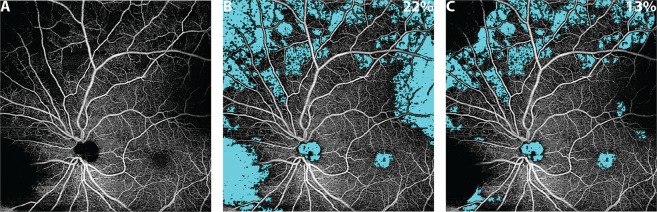
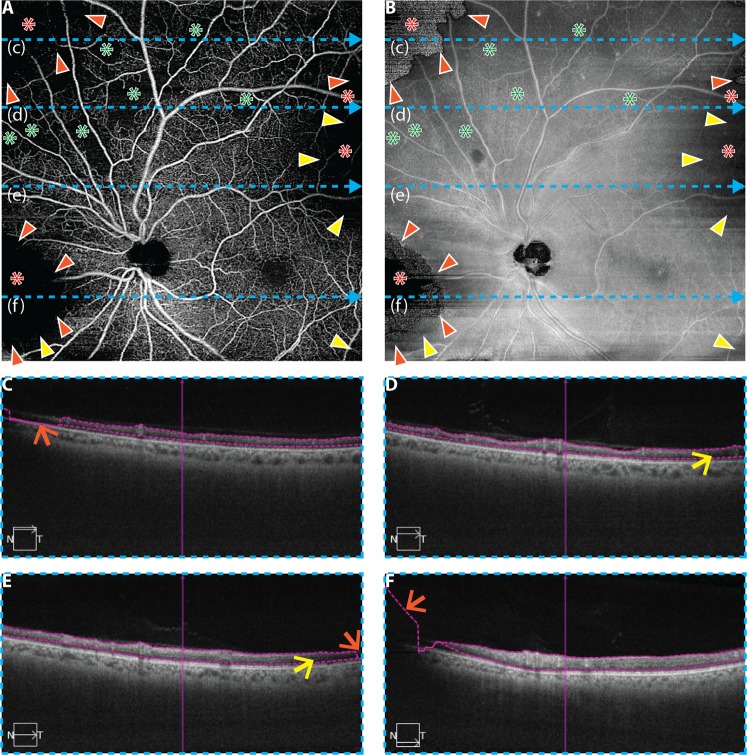
The recent clinical adoption of optical coherence tomography (OCT) angiography (OCTA) has enabled non-invasive, volumetric visualization of ocular vasculature at micron-scale resolutions. Initially limited to 3 mm × 3 mm and 6 mm × 6 mm fields-of-view (FOV), commercial OCTA systems now offer 12 mm × 12 mm, or larger, imaging fields. While larger FOVs promise a more complete visualization of retinal disease, they also introduce new challenges to the accurate and reliable interpretation of OCTA data. In particular, because of vignetting, wide-field imaging increases occurrence of low-OCT-signal artifacts, which leads to thresholding and/or segmentation artifacts, complicating OCTA analysis. This study presents theoretical and case-based descriptions of the causes and effects of low-OCT-signal artifacts. Through these descriptions, we demonstrate that OCTA data interpretation can be ambiguous if performed without consulting corresponding OCT data. Furthermore, using wide-field non-perfusion analysis in diabetic retinopathy as a model widefield OCTA usage-case, we show how qualitative and quantitative analysis can be confounded by low-OCT-signal artifacts. Based on these results, we suggest methods and best-practices for preventing and managing low-OCT-signal artifacts, thereby reducing errors in OCTA quantitative analysis of non-perfusion and improving reproducibility. These methods promise to be especially important for longitudinal studies detecting progression and response to therapy.


Conflict of interest statement

J.S. Duker: Carl Zeiss Meditec Inc (Consultant and Financial Support), Optovue Inc (Consultand and Financial Support); and Topcon Medical Systems Inc (Consultant and Financial Support); J.G. Fujimoto: Optovue Inc (Patent holder and Personal Financial Interest); Carl Zeiss Meditec Inc (Patent holder); and Topcon Medical Systems Inc (Grant Recipient); N.K. Waheed: Macula Vision Research Foundation (Financial Support); Topcon Medical Systems, Inc (Financial Support); Nidek Medical Products Inc (Financial Support); Optovue Inc (Consultant); and Carl Zeiss Meditec Inc (Financial Support). The remaining authors have no conflicting interests to disclose.

Figures

Figure 1
Figure 1
Illustration of how widefield OCT(A) increases susceptibility to axial alignment error and thereby exacerbates vignetting. (A) With the correct working distance, the OCT beam pivot (yellow dot) is coincident with the pupil plane. (B) With an incorrect working distance, the OCT beam pivot is offset (here by a distance d) from the pupil plane. When the OCT beam is parallel (solid rays) to the optic axis of the eye, there is no vignetting in either situation. Moreover, with the correct working distance, there is no vignetting even when OCT beam scanned to a different position on the retina (dashed rays); this is because although the scanning changes the beam angle, it does not translate the beam at the pupil plane. However, with an incorrect working distance, when the OCT beam is scanned, the beam changes both its angle and transverse position at the pupil plane, the latter of which results in vignetting (red area). Since the amount of translation increases with increasing scan angles, larger OCTA fields-of-view increase the likelihood of vignetting, and make correct instrument alignment increasingly important. Methods for correct instrument alignment are discussed in Part IV.
Figure 2
Figure 2
Schematic of processing steps used to generate en face OCT(A) images. The OCT volume is segmented, typically automatically, to form a set of contours. Usually the OCT signal, and not the OCTA signal, is used for segmentation (as shown here). The OCT and OCTA volumes are then projected (using averaging or histogram methods) between the segmented contours. This transforms volumetric (3-D) OCT(A) data into en face (2-D) OCT(A) data. Because the en face OCTA depends on the OCTA generation and segmentation steps, which in turn depend on the underlying OCT data, artifacts in the OCT data ultimately cause artifacts in the en face OCT(A) data.
Figure 3
Figure 3
Effect of artifacts on the percentage non-perfusion area (PNPA) metric of a 12 mm × 12 mm OCTA image of the retinal vasculature of an eye with mild NPDR from a 68 year-old. (A) En face OCTA image showing many regions of low OCTA signal; from this en face OCTA image alone, it is unclear if all regions of low OCTA signal correspond to regions of actual low/no blood flow, or whether some are false positives caused by low-OCT-signal artifacts. (B) The uncorrected identification of non-perfusion areas (teal). (C) The corrected identification of non-perfusion areas, where regions of low-OCT-signal artifacts have been manually excluded (see Fig. 4). The PNPAs, given in the top right corner of panels (B,C), change from 22% (uncorrected) to 13% (corrected).
Figure 4
Figure 4
Illustration of cross-sectional, en face, and orthoplane approaches for artifact detection in an eye from a 68 year-old with mild NPDR; same eye as in Fig. 3. (A) 12 mm × 12 mm en face OCTA of retinal vasculature. (B) Corresponding en face OCT. (CF) OCT B-scans extracted from the dashed blue lines labelled (c–f), respectively. In panels (A,B), the orange arrowheads point to the boundaries of segmentation artifacts (i.e., transitions from valid to invalid segmentation); note the abrupt change in the en face OCT at these locations (panel B). Yellow arrowheads point to the boundaries of thresholding artifacts; note the characteristic low signal in the en face OCT (panel B); red asterisks indicate regions of low OCTA signal caused by low-OCT-signal artifacts (either thresholding or segmentation artifacts), and green asterisks correspond to regions of low OCTA signal that correspond to true regions of low/no blood flow (i.e., areas of non-perfusion). In panels (C–F), orange arrows point to segmentation errors, and yellow arrows point to regions that generate thresholding artifacts as a result of low OCT signal. In the cross-sectional approach for artifact detection, only panels C–F are used; in the en face approach, only panels A and B are used; and, in the orthoplane approach, suspect regions are flagged using panels A and B, and cross-sectional OCT B-scans are taken through these locations (panels C–F).
Figure 5
Figure 5
Workflow for automatic detection of low-OCT-signal artifacts. (A) Input en face OCT image. (B) Spatial variance mask to detect segmentation errors, formed by computing the spatial variance of the OCT image (9 pixel × 9 pixel kernel), and then binarizing the resulting variance image using an empirical threshold determined from the qualitative observations of a single grader. Additional morphological steps (closing and erosion) are used to remove spurious regions. (C) Low OCT signal mask, formed by an adaptive binarization of the input OCT image. In particular, a dynamic threshold (3 pixel × 3 pixel kernel) is computed relative to the mean intensity of the input en face OCT image. (D) Output artifact mask, formed by combing the masks of panels (B,C); again, morphological processing (erosion) is used to remove spurious regions. (E) Overlay of the output artifact mask on the input en face OCT image.
Figure 6
Figure 6
Examples of automatic artifact detection. All images are full retinal projections of 12 mm × 12 mm fields. Column (A) 68 year-old with mild NPDR; same as eye as in Fig. 3. Column (B) 74 year-old with severe NPDR. Column (C) 54 year-old with severe NPDR. Column (D) Right eye from same patient as column (C) PDR. Row 1: En face OCTA image of retinal vasculature. Row 2: Corresponding en face OCT image. Row 3: Automatically detected artifacts shown in red. Row 4: Uncorrected non-perfusion areas. Row 5, corrected non-perfusion areas. PNPAs are listed in the top-right corner of each panel in Row 4 and Row 5. The white arrowhead in column (D) points to a region that was incorrectly classified by the algorithm as being artifact-free (i.e., false negative).
Figure 7
Figure 7
Workflows for the en face and orthoplane approaches to low-OCT-signal artifact detection. (A) Workflow for en face artifact detection; workflow begins at the top of the diagram, with the double arrow. In the en face approach, segmentation artifacts cannot be distinguished from thresholding artifacts; as such, detected artifacts are excluded from the analysis (dashed box of panel A). (B) In the orthoplane approach, the dashed box of panel (A) is substituted for a cross-sectional analysis of the region-of-interest. Cross-sectional analysis can be used to differentiate segmentation artifacts from thresholding artifacts, and possibly correct the former by adjusting the segmentation.
Figure 8
Figure 8
General approach to rapid identification of artifacts using orthoplane viewing. Artifact X represents an artifact that appears in the en face data.

References

    1. Kashani AH, et al. Optical coherence tomography angiography: A comprehensive review of current methods and clinical applications. Progress in Retinal and Eye Research. 2017;60:66–100. doi: 10.1016/j.preteyeres.2017.07.002. - DOI - PMC - PubMed
    1. Spaide RF, Fujimoto JG, Waheed NK, Sadda SR, Staurenghi G. Optical coherence tomography angiography. Progress in Retinal and Eye Research. 2018;64:1–55. doi: 10.1016/j.preteyeres.2017.11.003. - DOI - PMC - PubMed
    1. Shimizu K, Kobayashi Y, Muraoka K. Midperipheral Fundus Involvement In Diabetic-Retinopathy. Ophthalmology. 1981;88:601–612. doi: 10.1016/S0161-6420(81)34983-5. - DOI - PubMed
    1. Niki T, Muraoka K, Shimizu K. Distribution Of Capillary Nonperfusion In Early-Stage Diabetic-Retinopathy. Ophthalmology. 1984;91:1431–1439. doi: 10.1016/S0161-6420(84)34126-4. - DOI - PubMed
    1. Silva PS, et al. Diabetic Retinopathy Severity and Peripheral Lesions Are Associated with Nonperfusion on Ultrawide Field Angiography. Ophthalmology. 2015;122:2465–2472. doi: 10.1016/j.ophtha.2015.07.034. - DOI - PubMed

Publication types