

Genome-wide identification of glutathione S-transferase gene family in pepper, its classification, and expression profiling under different anatomical and environmental conditions
- PMID: 31235811
- PMCID: PMC6591324
- DOI: 10.1038/s41598-019-45320-x
Genome-wide identification of glutathione S-transferase gene family in pepper, its classification, and expression profiling under different anatomical and environmental conditions
Abstract
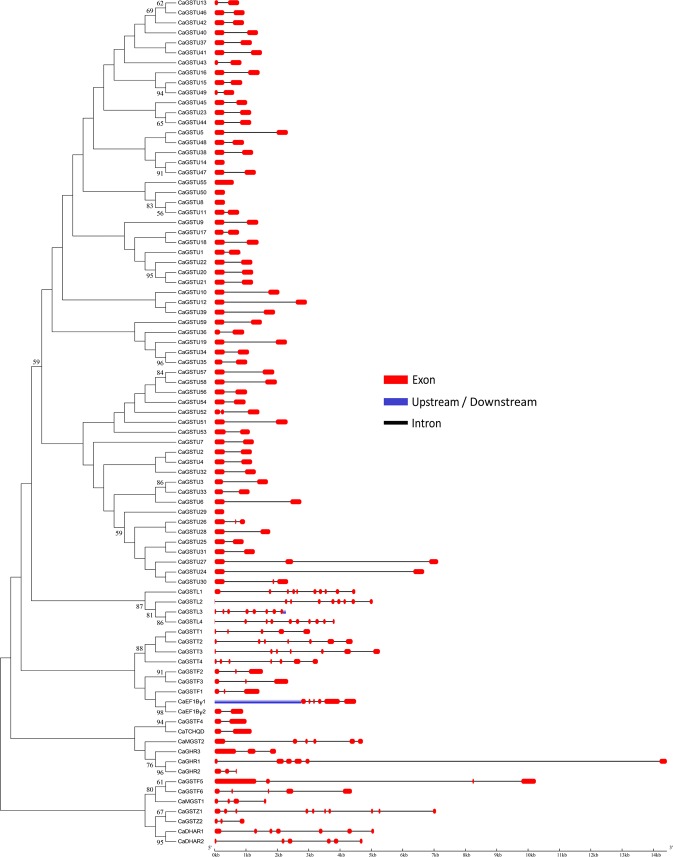
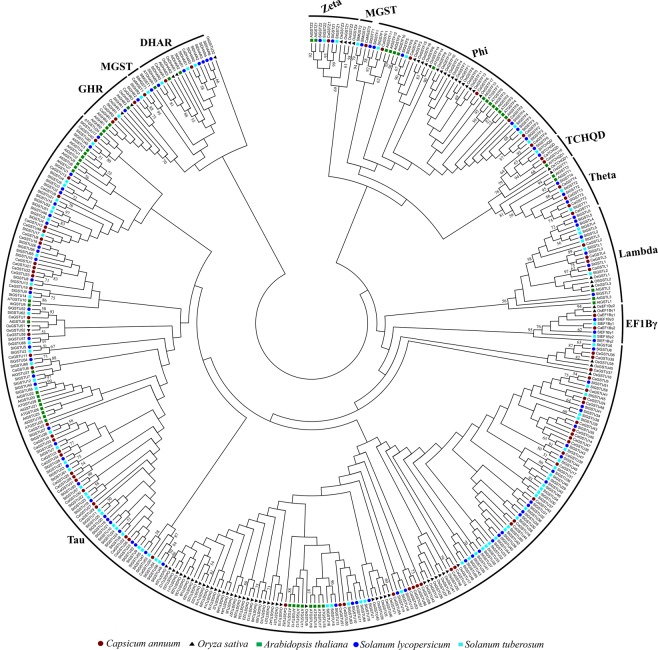
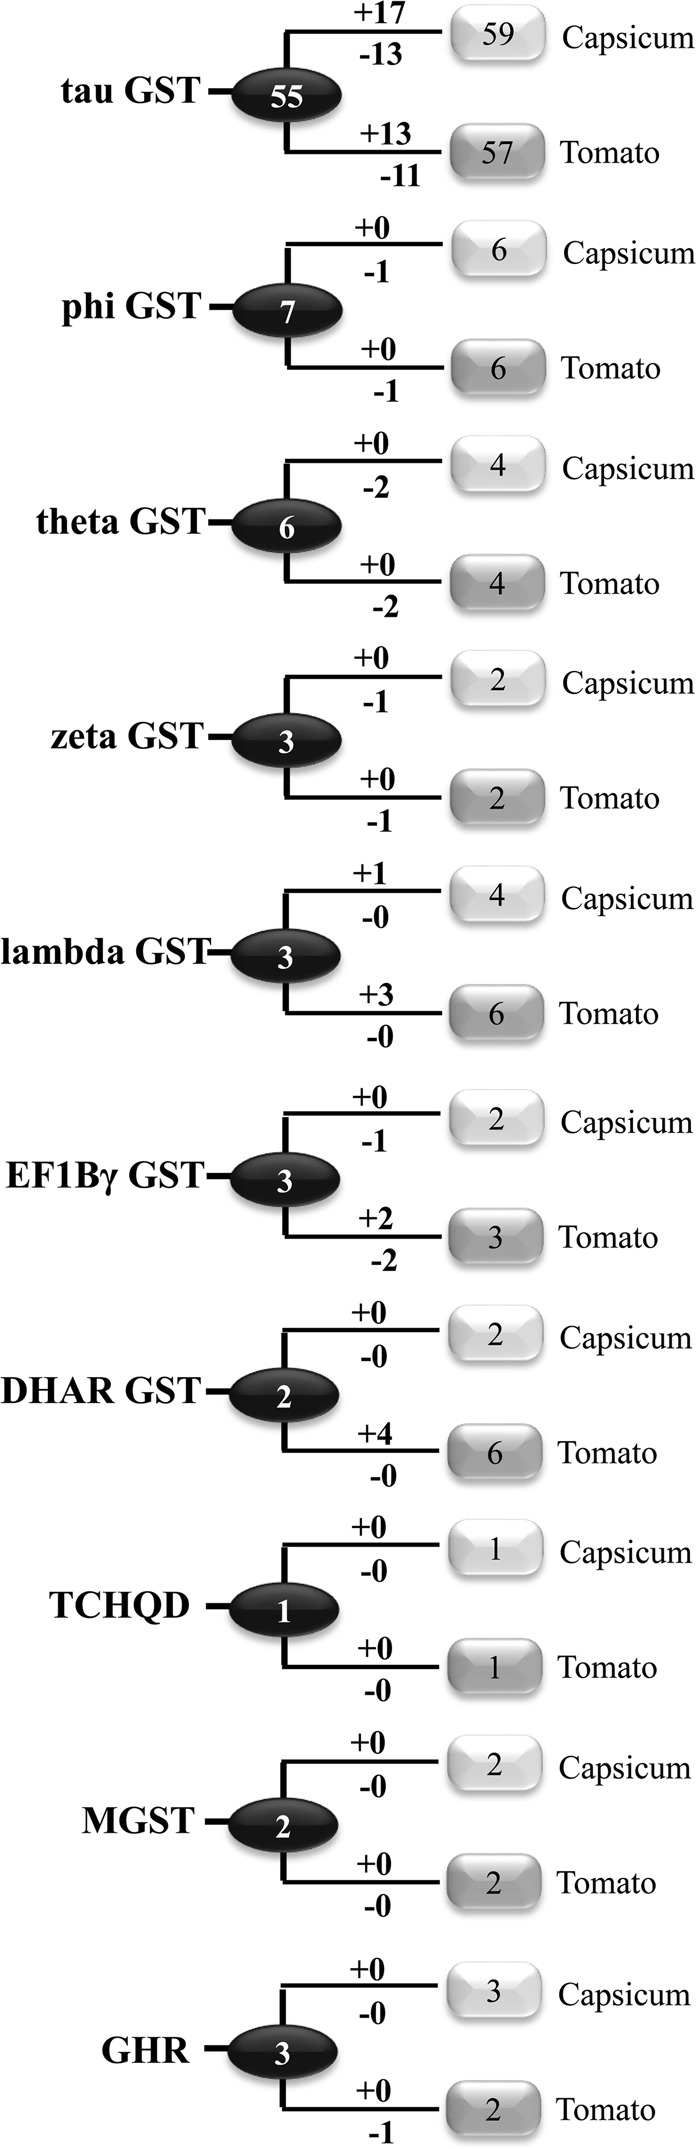
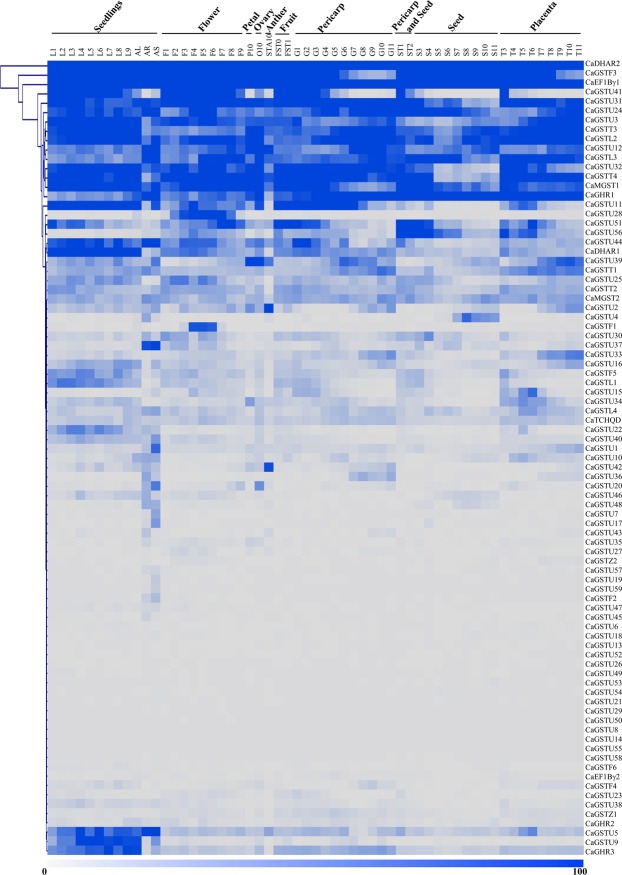
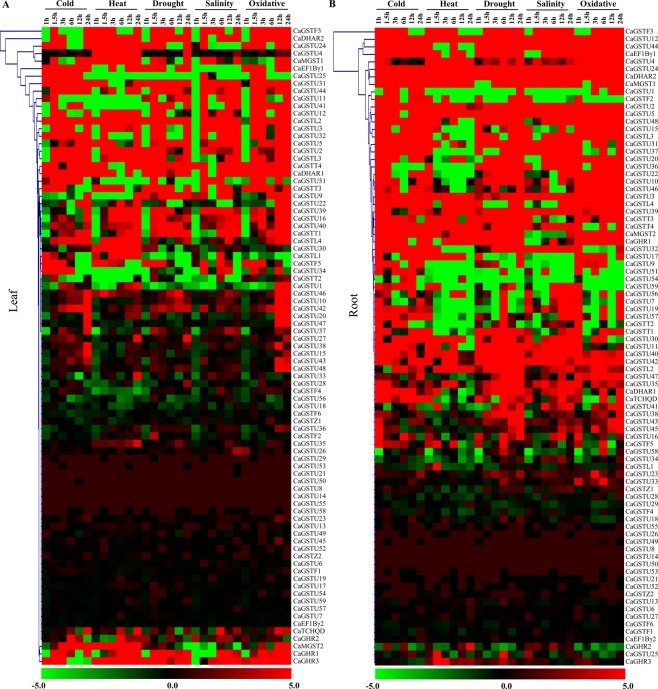
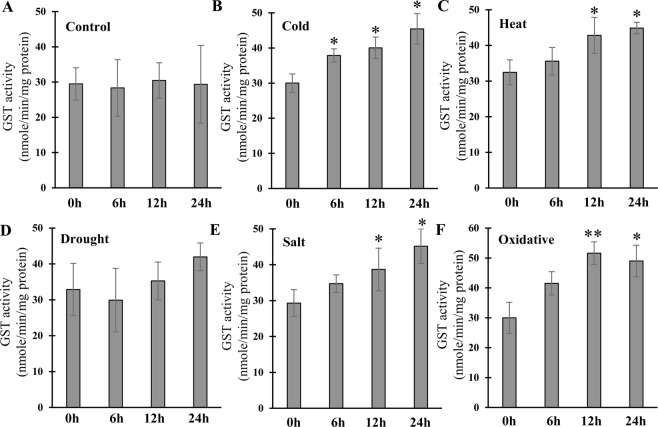
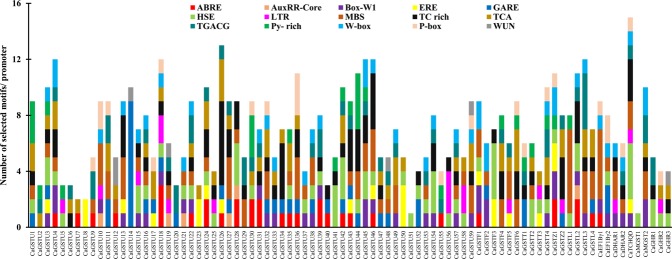
Glutathione S-transferases (GSTs) compose a family of multifunctional enzymes involved in the numerous aspects of regulating plant growth, development, and stress response. An in silico genome-wide analysis of pepper (Capsicum annuum L.) was performed to identify eighty-five GST genes that were annotated according to their chromosomal location. Segmental duplication contributed more than tandem duplication for the expansion of GST gene family in pepper. All the identified members belong to ten different classes which are highly conserved among Arabidopsis, rice, tomato and potato counterparts indicating the pre-dicot-monocot split diversification of GST classes. Gene structure, protein domain, and motif organization were found to be notably conserved over the distinct phylogenetic groups, which demonstrated the evolutionary significant role of each class. Expression of most of the CaGST transcripts as well as the total pepper GST activity was found to be significantly up-regulated in response to cold, heat, drought, salinity and osmotic stress conditions. Presence of various hormone and stress-responsive cis-elements on most of the putative CaGST promoter regions could be directly correlated with the alteration of their transcripts. All these findings might provide opportunities for future functional validation of this important gene family in pepper.
Conflict of interest statement
The authors declare no competing interests.
Figures
Similar articles
-
Comprehensive genome-wide analysis of Glutathione S-transferase gene family in potato (Solanum tuberosum L.) and their expression profiling in various anatomical tissues and perturbation conditions.Gene. 2018 Jan 10;639:149-162. doi: 10.1016/j.gene.2017.10.007. Epub 2017 Oct 6. Gene. 2018. PMID: 28988961
-
Genome-wide identification and expression profiling of glutathione transferase gene family under multiple stresses and hormone treatments in wheat (Triticum aestivum L.).BMC Genomics. 2019 Dec 16;20(1):986. doi: 10.1186/s12864-019-6374-x. BMC Genomics. 2019. PMID: 31842737 Free PMC article.
-
Genome-wide analysis of glutathione S-transferase gene family in chickpea suggests its role during seed development and abiotic stress.Mol Biol Rep. 2020 Apr;47(4):2749-2761. doi: 10.1007/s11033-020-05377-8. Epub 2020 Mar 17. Mol Biol Rep. 2020. PMID: 32185688
-
The SnRK2 family in pepper (Capsicum annuum L.): genome-wide identification and expression analyses during fruit development and under abiotic stress.Genes Genomics. 2020 Oct;42(10):1117-1130. doi: 10.1007/s13258-020-00968-y. Epub 2020 Jul 31. Genes Genomics. 2020. PMID: 32737808 Review.
-
Genome-wide in silico identification of glutathione S-transferase (GST) gene family members in fig (Ficus carica L.) and expression characteristics during fruit color development.PeerJ. 2023 Jan 25;11:e14406. doi: 10.7717/peerj.14406. eCollection 2023. PeerJ. 2023. PMID: 36718451 Free PMC article. Review.
Cited by
-
Genome-Wide Identification, Evolution and Expression Analysis of the Glutathione S-Transferase Supergene Family in Euphorbiaceae.Front Plant Sci. 2022 Mar 10;13:808279. doi: 10.3389/fpls.2022.808279. eCollection 2022. Front Plant Sci. 2022. PMID: 35360301 Free PMC article.
-
Transcriptome profiling of pepper leaves by RNA-Seq during an incompatible and a compatible pepper-tobamovirus interaction.Sci Rep. 2021 Oct 19;11(1):20680. doi: 10.1038/s41598-021-00002-5. Sci Rep. 2021. PMID: 34667194 Free PMC article.
-
Genome-Wide Identification and Expression Analysis of the BTB Gene Superfamily Provides Insight into Sex Determination and Early Gonadal Development of Alligator sinensis.Int J Mol Sci. 2024 Oct 7;25(19):10771. doi: 10.3390/ijms251910771. Int J Mol Sci. 2024. PMID: 39409099 Free PMC article.
-
High-quality Momordica balsamina genome elucidates its potential use in improving stress resilience and therapeutic properties of bitter gourd.Front Plant Sci. 2024 Jan 24;14:1258042. doi: 10.3389/fpls.2023.1258042. eCollection 2023. Front Plant Sci. 2024. PMID: 38333042 Free PMC article.
-
Glutathione S-transferase in mediating adaptive responses of oats (Avena sativa) to osmotic and cadmium stress: genome-wide analysis.BMC Plant Biol. 2025 Apr 25;25(1):538. doi: 10.1186/s12870-025-06559-x. BMC Plant Biol. 2025. PMID: 40281415 Free PMC article.
References
-
- Edwards, R., Dixon, D. P., Cummins, I., Brazier-Hicks, M. & Skipsey, M. In Organic xenobiotics and plants 125–148 (Springer, 2011).
-
- Frova C. The plant glutathione transferase gene family: genomic structure, functions, expression and evolution. Physiologia plantarum. 2003;119:469–479. doi: 10.1046/j.1399-3054.2003.00183.x. - DOI
Publication types
MeSH terms
Substances
LinkOut - more resources
Full Text Sources
Research Materials
