

Inactivation of TSC1 promotes epithelial-mesenchymal transition of renal tubular epithelial cells in mouse diabetic nephropathy
- PMID: 31235817
- PMCID: PMC7468253
- DOI: 10.1038/s41401-019-0244-6
Inactivation of TSC1 promotes epithelial-mesenchymal transition of renal tubular epithelial cells in mouse diabetic nephropathy
Erratum in
-
Author Correction: Inactivation of TSC1 promotes epithelial-mesenchymal transition of renal tubular epithelial cells in mouse diabetic nephropathy.Acta Pharmacol Sin. 2022 Jun;43(6):1619-1620. doi: 10.1038/s41401-021-00785-3. Acta Pharmacol Sin. 2022. PMID: 34645973 Free PMC article. No abstract available.
Abstract
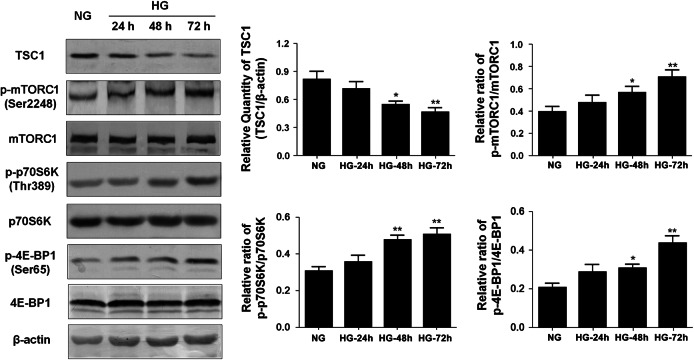
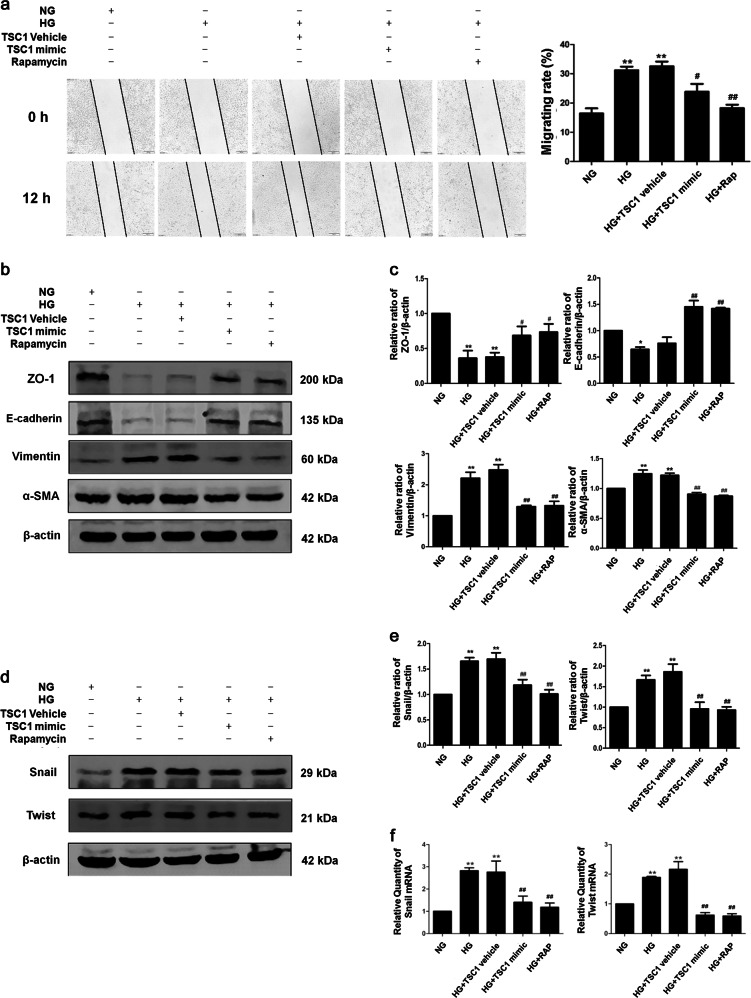
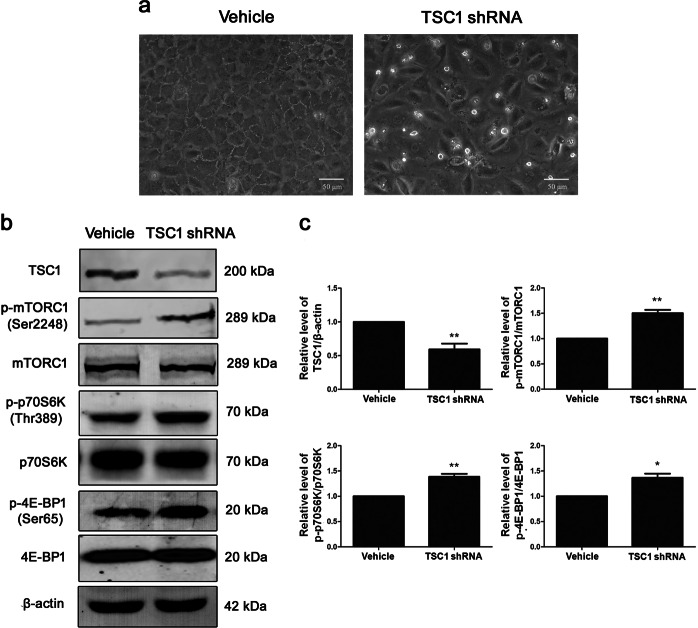
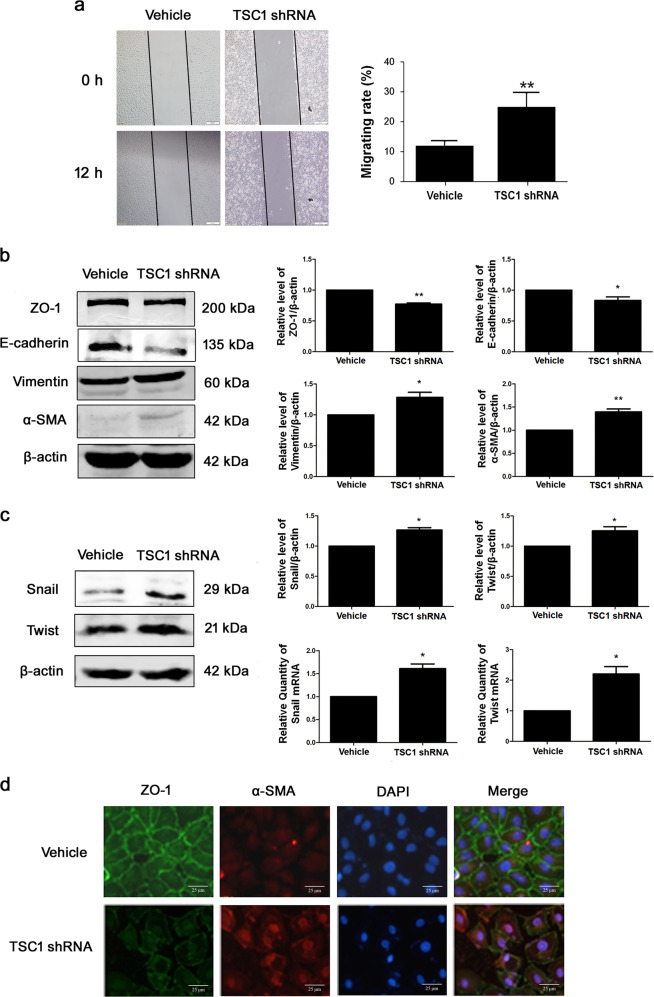
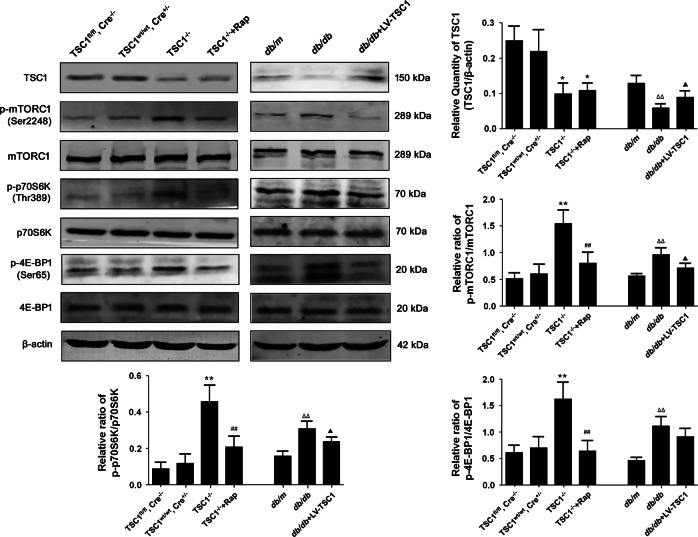
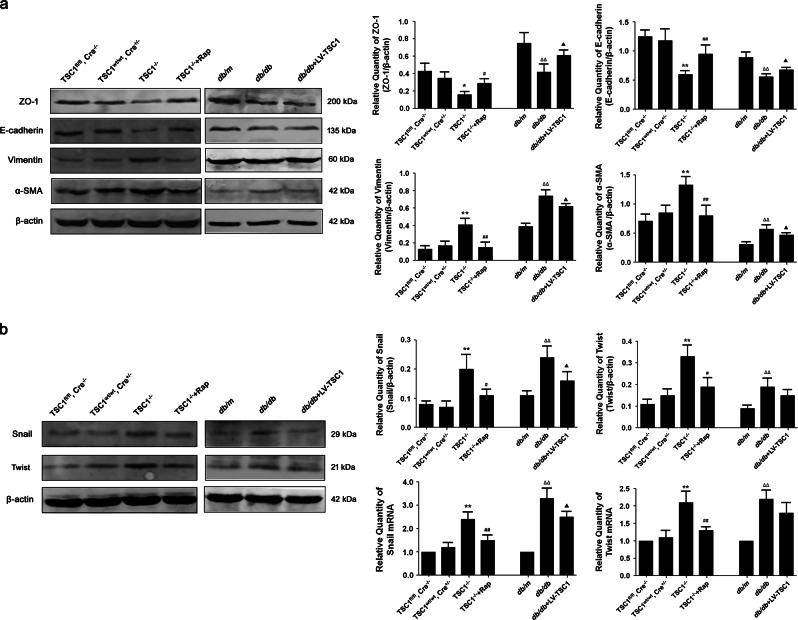
Epithelial-mesenchymal transition (EMT) of renal tubular epithelial cells is one of the potential mechanisms of renal fibrosis, which promotes the development of diabetic nephropathy (DN). However, the molecular mechanisms of EMT remain largely unknown. Tuberous sclerosis proteins TSC1 and TSC2 are key integrators of growth factor signaling, and the loss of TSC1 or TSC2 function leads to a spectrum of diseases that underlie abnormalities in cell growth, proliferation, differentiation, and migration. In this study, we investigated the effects of TSC1 on high glucose (HG)-induced EMT of human proximal tubular epithelial HK-2 cells in vitro and renal fibrosis in TSC1-/- and db/db mice. We found that the exposure of HK-2 cells to HG (30 mM) time-dependently decreased TSC1 expression, increased the phosphorylation of mTORC1, P70S6K, and 4E-BP-1, and promoted cell migration, resulting in EMT. Transfection of the cells with TSC1 mimic significantly ameliorated HG-induced EMT of HK-2 cells. The tubules-specific TSC1 knockout mice (TSC1-/-) displayed a significant decline in renal function. TSC1-/- mice, similar to db/db mice, showed greatly activated mTORC1 signaling and EMT process in the renal cortex and exacerbated renal fibrosis. Overexpression of TSC1 through LV-TSC1 transfection significantly alleviated the progression of EMT and renal fibrosis in the renal cortex of db/db mice. Taken together, our results suggest that TSC1 plays a key role in mediating HG-induced EMT, and inhibition of TSC1-regulated mTORC1 signaling may be a potential approach to prevent renal fibrosis in DN.
Keywords: TSC1−/− mice; db/db mice; diabetic nephropathy; epithelial–mesenchymal transition; human proximal tubular epithelial cell line HK-2; rapamycin; renal fibrosis; tuberous sclerosis complex 1.
Conflict of interest statement
The authors declare no competing interests.
Figures


Similar articles
-
Quercetin inhibits the mTORC1/p70S6K signaling-mediated renal tubular epithelial-mesenchymal transition and renal fibrosis in diabetic nephropathy.Pharmacol Res. 2015 Sep;99:237-47. doi: 10.1016/j.phrs.2015.06.006. Epub 2015 Jul 4. Pharmacol Res. 2015. PMID: 26151815
-
Chrysin inhibits diabetic renal tubulointerstitial fibrosis through blocking epithelial to mesenchymal transition.J Mol Med (Berl). 2015 Jul;93(7):759-72. doi: 10.1007/s00109-015-1301-3. Epub 2015 Jun 11. J Mol Med (Berl). 2015. PMID: 26062793
-
YY1: A novel therapeutic target for diabetic nephropathy orchestrated renal fibrosis.Metabolism. 2019 Jul;96:33-45. doi: 10.1016/j.metabol.2019.04.013. Epub 2019 Apr 25. Metabolism. 2019. PMID: 31028762
-
The role of renal proximal tubular cells in diabetic nephropathy.Curr Diab Rep. 2003 Dec;3(6):491-6. doi: 10.1007/s11892-003-0013-1. Curr Diab Rep. 2003. PMID: 14611746 Review.
-
MicroRNAs in kidney fibrosis and diabetic nephropathy: roles on EMT and EndMT.Biomed Res Int. 2013;2013:125469. doi: 10.1155/2013/125469. Epub 2013 Sep 8. Biomed Res Int. 2013. PMID: 24089659 Free PMC article. Review.
Cited by
-
High glucose induces an activated state of partial epithelial-mesenchymal transition in human primary tubular cell cultures.PLoS One. 2023 Feb 24;18(2):e0279655. doi: 10.1371/journal.pone.0279655. eCollection 2023. PLoS One. 2023. PMID: 36827456 Free PMC article.
-
Expression and possible role of Smad3 in postnecrotizing enterocolitis stricture.World J Pediatr Surg. 2022 Jan 5;5(1):e000289. doi: 10.1136/wjps-2021-000289. eCollection 2022. World J Pediatr Surg. 2022. PMID: 36474625 Free PMC article.
-
YY1 inactivated transcription co-regulator PGC-1α to promote mitochondrial dysfunction of early diabetic nephropathy-associated tubulointerstitial fibrosis.Cell Biol Toxicol. 2023 Apr;39(2):391-413. doi: 10.1007/s10565-022-09711-7. Epub 2022 Apr 21. Cell Biol Toxicol. 2023. PMID: 35445903
-
Protective Role of Vitamin D in Renal Tubulopathies.Metabolites. 2020 Mar 19;10(3):115. doi: 10.3390/metabo10030115. Metabolites. 2020. PMID: 32204545 Free PMC article. Review.
-
FOXO3a Protects against Kidney Injury in Type II Diabetic Nephropathy by Promoting Sirt6 Expression and Inhibiting Smad3 Acetylation.Oxid Med Cell Longev. 2021 May 26;2021:5565761. doi: 10.1155/2021/5565761. eCollection 2021. Oxid Med Cell Longev. 2021. PMID: 34122724 Free PMC article.
References
MeSH terms
Substances
LinkOut - more resources
Full Text Sources
Medical
Miscellaneous
