. 2019 Jul;22(7):1089-1098.
doi: 10.1038/s41593-019-0434-z. Epub 2019 Jun 24.

Pericyte loss leads to circulatory failure and pleiotrophin depletion causing neuron loss

Affiliations

Pericyte loss leads to circulatory failure and pleiotrophin depletion causing neuron loss

Angeliki M Nikolakopoulou et al. Nat Neurosci. 2019 Jul.

Abstract

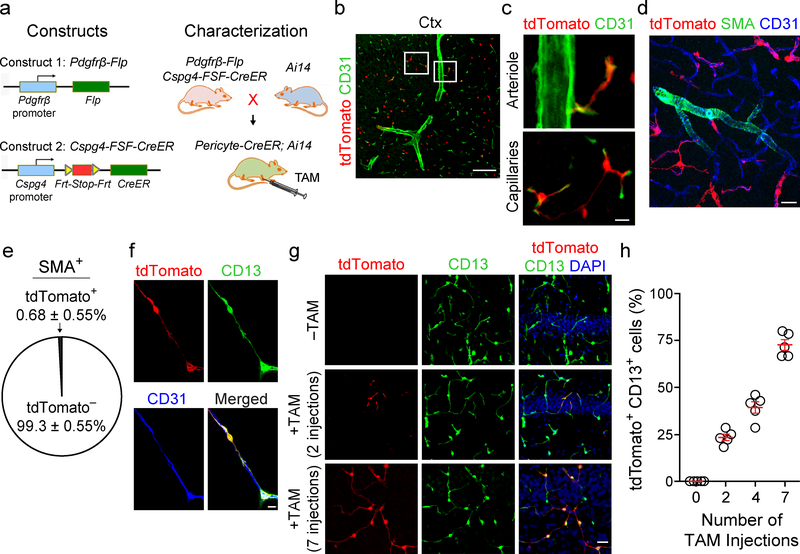
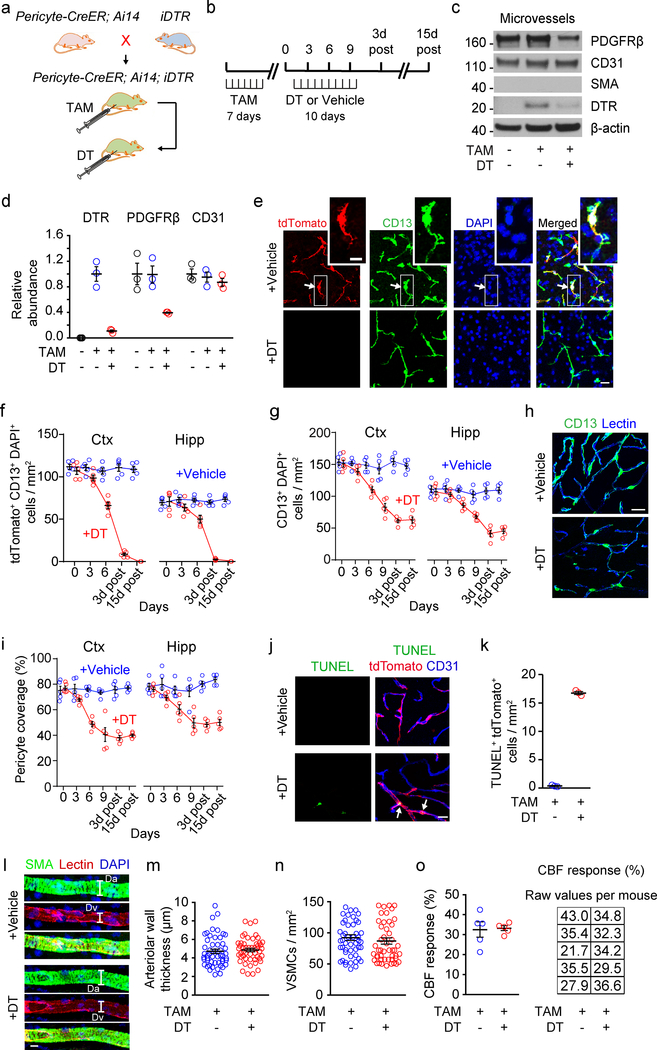
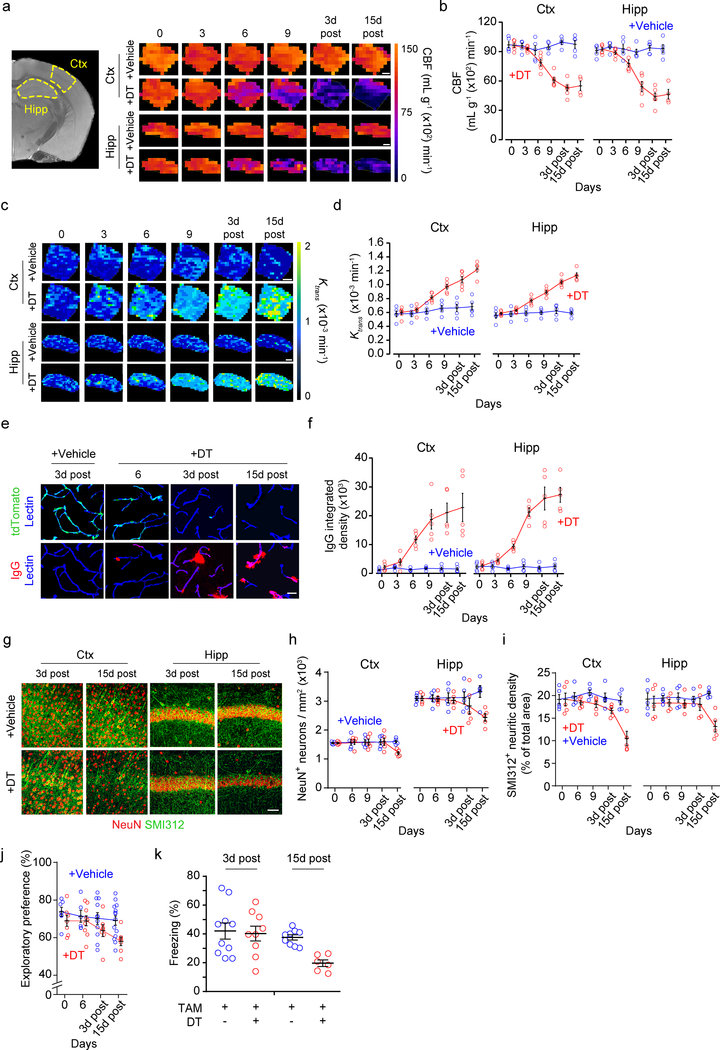
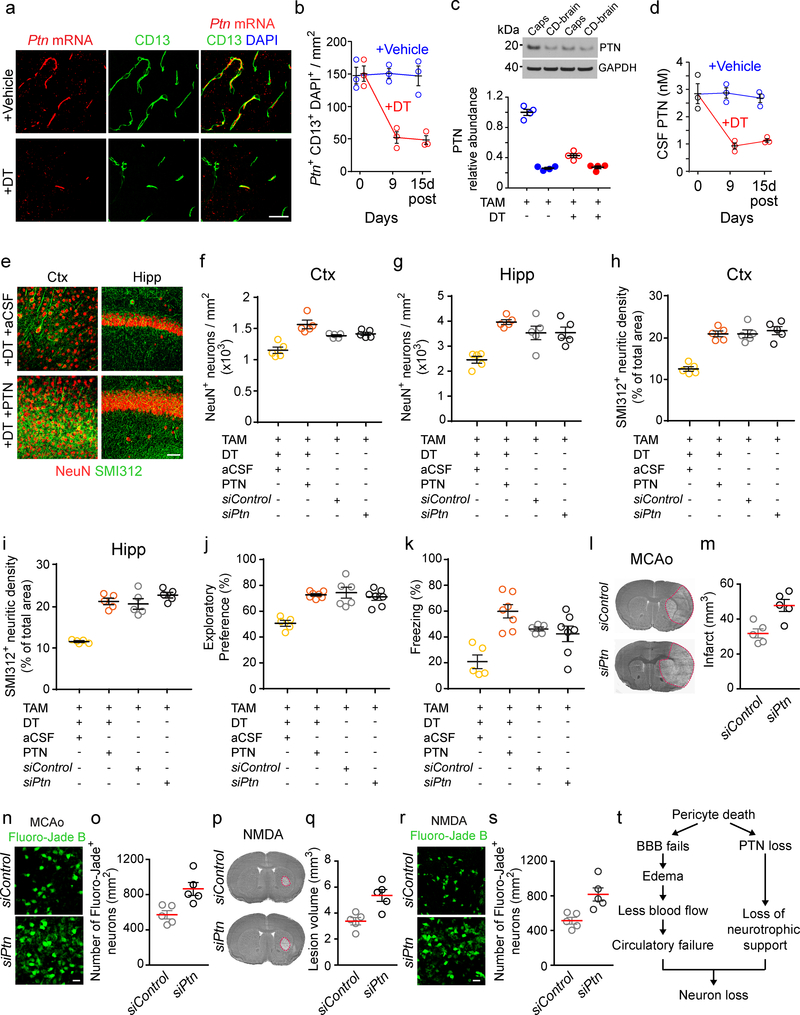
Pericytes are positioned between brain capillary endothelial cells, astrocytes and neurons. They degenerate in multiple neurological disorders. However, their role in the pathogenesis of these disorders remains debatable. Here we generate an inducible pericyte-specific Cre line and cross pericyte-specific Cre mice with iDTR mice carrying Cre-dependent human diphtheria toxin receptor. After pericyte ablation with diphtheria toxin, mice showed acute blood-brain barrier breakdown, severe loss of blood flow, and a rapid neuron loss that was associated with loss of pericyte-derived pleiotrophin (PTN), a neurotrophic growth factor. Intracerebroventricular PTN infusions prevented neuron loss in pericyte-ablated mice despite persistent circulatory changes. Silencing of pericyte-derived Ptn rendered neurons vulnerable to ischemic and excitotoxic injury. Our data demonstrate a rapid neurodegeneration cascade that links pericyte loss to acute circulatory collapse and loss of PTN neurotrophic support. These findings may have implications for the pathogenesis and treatment of neurological disorders that are associated with pericyte loss and/or neurovascular dysfunction.


Conflict of interest statement

Competing Interest Statement

The authors declare no competing interests.

Figures

Figure 1.
Figure 1.. Generation of a pericyte-specific Cre line.
(a) Constructs: Pdgfrb promoter expressing Flippase (Flp) and Cspg4 promoter driving the Frt-Stop-Frt-CreER cassette. Crossing: Pdgfrβ-Flp; Cspg4-FSF-CreER mice X Ai14 tdTomato line. (b-f) Characterization of pericyte-specific Cre line with the Ai14 reporter mice. b, Expression of tdTomato in perivascular cells in the cortex 1 week after tamoxifen (TAM) (4 injections 40 mg/kg daily). Bar = 50 μm. c, Representative images from the boxed regions in b, showing restricted expression of tdTomato in perivascular cells of brain capillaries. d, tdTomato expression on brain capillaries, but not on arteriolar vascular smooth muscle cells. SMA, α-smooth muscle actin. e, SMA+ tdTomato+ and SMA+ tdTomato- cells in the cortex; Mean ± S.E.M., n = 55 mice. f, Colocalization of tdTomato with pericyte marker CD13 (green). CD31, endothelial marker. Bar = 10 μm. (g,h) Representative images (g) and quantification (h) of pericytes expressing tdTomato (%) plotted against the number of TAM injections (40 mg/kg daily). DAPI, nuclear staining. In h, significant increase in tdTomato+ CD13+ cells (%) at 2 vs. 0 TAM injections (P = 9.5E−6), at 4 vs. 2 TAM injections (P = 7.6E−4), and at 7 vs. 4 TAM injections (P = 8.5E−8); Mean ± S.E.M., n = 5 mice/group. Significance by one-way ANOVA followed by Bonferroni posthoc test. Bars = 20 μm, panels c, d and g. Experiments illustrated in panels b-d, f, and g were repeated independently with similar results in 5 mice.
Figure 2.
Figure 2.. Pericyte ablation with diphtheria toxin.
(a) Breeding: Pericyte-CreER; Ai14 X iDTR mice. (b) A diagram of the injection protocol with TAM (40 mg/kg daily for 7 consecutive days), DT (0.1 μg per day for 10 consecutive days beginning two weeks after TAM) or vehicle, and time points when analyses were performed. (c,d) Immunoblotting (c) and quantification (d) of DTR, PDGFRβ, and CD31 in brain microvessels from TAM-treated pericyte-CreER; iDTR mice at 3 days post-DT or vehicle. In TAM + DT-treated mice compared to TAM + vehicle-treated control mice, relative microvascular abundance of DTR and PDGFRβ was significantly decreased (P = 2.6E−4 and P = 4E−2, respectively), whereas relative abundance of CD31 was unchanged (P = 0.49). Mean ± S.E.M., n = 3 mice/group. PDGFRβ, pericyte marker; CD31, endothelial marker; SMA, α-smooth muscle cell actin; DTR, DT receptor. (e-g) tdTomato, CD13 and DAPI staining in the cortex 3 days post-DT or vehicle (e) and quantification of tdTomato+ CD13+ DAPI+ pericytes (f) and CD13+ DAPI+ pericytes (g) in the cortex (Ctx) and hippocampus (Hipp) of TAM-treated pericyte-CreER; Ai14; iDTR mice at 0, 3, 6 and 9 days of DT, and 3 and 15 days post-DT or vehicle. Mean ± S.E.M., n = 5 mice/group. In e, white in merged image indicates colocalization of tdTomato, CD13 and DAPI (white arrows), and is representative of staining repeated independently with similar results in 5 mice. Bar = 20 μm. Inset bar = 10 μm. In f, DT-treated mice compared to vehicle-treated mice had significantly less tdTomato+ CD13+ DAPI+ cells in Ctx at day 6 of treatment (P = 7E−9), 3 days post-treatment (P = 1E−15), and 15 days post-treatment (P = 1E−15); and, significantly less tdTomato+ CD13+ DAPI+ cells in Hipp at day 6 of treatment (P = 5.6E−4), 3 days post-treatment (P = 1E−15), and 15 days post-treatment (P = 1E−15). In g, DT-treated mice compared to vehicle-treated mice had significantly less CD13+ DAPI+ cells in Ctx at day 6 of treatment (P = 1E−4), day 9 of treatment (P = 3E−9), 3 days post-treatment (P = 1E−15), and 15 days post-treatment (P = 3E−14); and, significantly less CD13+ DAPI+ cells in Hipp at day 6 of treatment (P = 2E−2), day 9 of treatment (P = 2E−5), 3 days post-treatment (P = 3E−13), and 15 days post-treatment (P = 9E−13). (h,i) CD13+ pericyte coverage of lectin+ endothelial profiles in the cortex 3 days post-DT or vehicle (h; Bar = 20 μm), and quantification of pericyte coverage on capillaries (<6 μm in diameter) in Ctx and Hipp (i) in TAM-treated pericyte-CreER; iDTR mice at 0, 3, 6 and 9 days of DT, and 3 and 15 days post-DT or vehicle. Mean ± S.E.M., n = 5 mice/group. In i, DT-treated mice compared to vehicle-treated mice had significantly less capillary pericyte coverage in Ctx at day 6 of treatment (P = 8E−8), day 9 of treatment (P = 3E−10), 3 days post-treatment (P = 3E−12), and 15 days post-treatment (P = 5E−12); and, significantly less capillary pericyte coverage in Hipp at day 6 of treatment (P = 4.7E−2), day 9 of treatment (P = 1.8E−5), 3 days post-treatment (P = 5.7E−8), and 15 days post-treatment (P = 1.5E−8). (j,k) Representative images (j) and quantification (k) of TUNEL+ tdTomato+ pericytes on CD31+ endothelial profiles in the cortex of TAM-treated pericyte CreER; iDTR; Ai14 mice at 6 days of treatment with DT compared to vehicle (P = 5E−7). Arrows, TUNEL+ tdTomato+ cells. Bar = 20 μm. Mean ± S.E.M., n = 3 mice/group. (l) SMA+ vascular smooth muscle cells (VSMCs) (green, top), lectin+ endothelial profiles (red, middle), and merged (bottom) in penetrating arterioles in the cortex of TAM-treated pericyte-CreER; iDTR mice 3 days post-DT or vehicle, representative of 50 independent arterioles with similar results from 5 mice per condition. Da, SMA+ arteriolar diameter; Dv, lectin+ endothelial diameter. Bar = 20 μm. (m-o) Arteriolar wall thickness (m, P = 0.37), VSMCs number (n, P = 0.46) and cerebral blood flow (CBF) response to adenosine by laser Doppler flowmetry (o, P = 0.84) in TAM-treated pericyte-CreER; iDTR mice 3 days post-DT compared to vehicle treatment. Mean ± S.E.M.; n = 5 mice/group; ns, non-significant. In m and n, individual points are 10 vessels/mouse from n = 5 mice/group. Mean ± S.E.M. from 50 arterioles/group. ns, non-significant. Significance by one-way ANOVA followed by Bonferroni posthoc test in d, f, g, and i, and two-tail Student’s t-test in k, m, n and o. See Supplementary Figure 11 for full scans of Western blots used for quantification in c.
Figure 3.
Figure 3.. Acute circulatory failure and rapid neuron loss after pericyte ablation.
(a,b) Cerebral blood flow (CBF) maps (a) and regional CBF values in the primary somatosensory cortex (Ctx) and hippocampus (Hipp) (b) of TAM-treated pericyte-CreER; iDTR mice at 0, 3, 6, and 9 days of DT, and 3 and 15 days post-DT (red) or vehicle (blue) generated by dynamic susceptibility-contrast MRI with gadolinium. Images are representative (a), and quantified (b) from n = 5 vehicle-treated and 6 DT-treated independent mice/group at 0, 3, 6, and 9 days of DT and 3 days post-DT, and n = 5 vehicle-treated and 4 DT-treated independent mice/group at 15 days post-DT. In a, bar = 0.5 mm. In b, DT-treated mice compared to vehicle-treated mice had significantly reduced CBF in Ctx at day 9 of treatment (P = 1E−8), 3 days post-treatment (P = 2E−13), and 15 days post-treatment (P = 2E−10); and, had significantly reduced CBF in Hipp at day 9 of treatment (P = 8.5E−8), 3 days post-treatment (P = 2.2E−12), and 15 days post-treatment (P = 7E−10). (c,d) Unidirectional transfer constant (Ktrans) blood-brain barrier maps to intravenous gadolinium in Ctx and Hipp (c) and regional Ktrans values in Ctx and Hipp (d) of TAM-treated pericyte-CreER; iDTR mice at 0, 3, 6, and 9 days of DT, and 3 and 15 days post-DT (red) or vehicle (blue) generated by longitudinal dynamic contrast-enhanced MRI. Images are representative (c) and quantified (d) from n = 5 vehicle-treated and 6 DT-treated independent mice/group at 0, 3, 6, and 9 days of DT and 3 days post-DT, and n = 5 vehicle-treated and 5 DT-treated independent mice/group at 15 days post-DT. In c, bar = 0.5 mm. In d, DT-treated mice compared to vehicle-treated mice had significantly increased Ktrans values in Ctx at day 6 of treatment (P = 5.5E−2), day 9 of treatment (P = 6.6E−5), 3 days post-treatment (P = 1E−7), and 15 days post-treatment (P = 6.2E−11); and, had significantly increased Ktrans values in Hipp at day 6 of treatment (P = 1.8E−3), day 9 of treatment (P = 5E−8), 3 days post-treatment (P = 6.7E−13), and 15 days post-treatment (P = 1E−15). In b and d, data is Mean ± S.E.M. (e,f) Immunoglobulin G perivascular deposits (red) in cortex (e) and quantification of IgG deposits in Ctx and Hipp (f) of TAM-treated pericyte-CreER; Ai14; iDTR mice at 0, 3, 6 and 9 days of DT, and 3 and 15 days post-DT or vehicle. Blue, lectin+ endothelial profiles; green, tdTomato+ pericytes. Bar = 20 μm. Mean ± S.E.M., n = 5 mice/group. In f, DT-treated mice compared to vehicle-treated mice had significantly increased IgG perivascular deposits in Ctx at day 6 of treatment (P = 4.7E−2), day 9 of treatment (P = 2.6E−5), 3 days post-treatment (P = 1.4E−6), and 15 days post-treatment (P = 1.4E−7); and, had significantly increased IgG perivascular deposits in Hipp at day 6 of treatment (P = 4.9E−2), day 9 of treatment (P = 1.2E−9), 3 days post-treatment (P = 4.7E−13), and 15 days post-treatment (P = 1.5E−13). (g-i) NeuN+ neurons (red, g) and SMI312+ neurofilaments (green, g) in Ctx and Hipp of TAM-treated pericyte-CreER; iDTR mice 3 and 15 days post-DT or vehicle, and quantification of NeuN+ neurons (h) and SMI312+ neuritic density (i) during and post-DT or vehicle treatment. Bar = 20 μm. Mean ± S.E.M., n = 5 mice/group. In h, DT-treated mice compared to vehicle-treated mice had significantly reduced numbers of NeuN+ neurons in Ctx (P = 4.4E−2) and Hipp (P = 1.1E−2) at 15 days post-treatment. In i, DT-treated mice compared to vehicle-treated mice had significantly reduced SMI312+ neuritic density in Ctx (P = 2.1E−5) and Hipp (P = 5.6E−4) at 15 days post-treatment. (j,k) Novel object location (j) and fear conditioning (k) in TAM-treated pericyte-CreER; iDTR mice at 0 and 6 days of DT (j), and 3 and 15 days post-DT or vehicle (j,k). DT-treated mice compared to vehicle-treated mice had significantly reduced exploratory preference (j, P = 2.4E−2) and performance on fear conditioning (k, P = 2.9E−2) at 15 days post-treatment. Mean ± S.E.M. In j, n = 7 vehicle-treated and 7 DT-treated mice/group at 0 days DT; n = 6 vehicle-treated, 9 DT-treated mice/group at 6 days DT; n = 11 vehicle-treated, 7 DT-treated mice/group at 3 days post-DT; n = 14 vehicle-treated, 7 DT-treated mice/group at 15 days post-DT. In k, n = 10 vehicle-treated, 9 DT-treated mice/group at 3 days post-DT; n = 9 vehicle-treated, 6 DT-treated mice/group at 15 days post-DT. In b, d, f, h, i, j and k, significance by one-way ANOVA followed by Bonferroni posthoc test.
Figure 4.
Figure 4.. Loss of pericyte-derived pleiotrophin (PTN)-mediated neuroprotection.
(a,b) Dual fluorescent in situ hybridization for Ptn mRNA and immunostaining for CD13+ pericytes in cortex of TAM-treated pericyte-CreER; iDTR mice at 15 days post-DT or vehicle (a, representative of 3 independent mice/group with similar results), and quantification (b) of Ptn+ CD13+ DAPI+ pericytes at 0 and 9 days of DT, and 15 days post-DT or vehicle. Bar = 40 μm. In b, DT-treated mice compared to vehicle-treated mice had significantly less Ptn+ CD13+ DAPI+ pericytes at day 9 of treatment (P = 5E−4) and 15 days post-treatment (P = 5E−4). (c,d) PTN expression in capillaries (Caps) and capillary-depleted brain (CD-brain) (c) and cerebrospinal fluid (CSF) PTN levels in TAM-treated pericyte-CreER; iDTR mice (d) at 0 and 9 days of DT, and 15 days post-DT or vehicle. In c, PTN relative capillary abundance was significantly decreased in TAM + DT-treated mice compared to TAM + vehicle-treated mice (P = 2E−8). In d, TAM + DT-treated mice compared to TAM + vehicle-treated mice had significantly reduced CSF PTN levels at day 9 of treatment (P = 5.4E−4) and 15 days post-treatment (P = 3.3E−3). In b-d, Mean ± S.E.M., n = 3 mice/group. (e-i) NeuN+ neurons (red, e) and SMI312+ neurofilaments (green, e) in Ctx and Hipp of TAM-treated pericyte-CreER; iDTR mice receiving DT for 10 days and PTN or artificial CSF (aCSF) by intracerebroventricular (ICV) bilateral infusion (from day 6 of DT to 15 days post-DT), and quantification of NeuN+ neurons (f,g) and SMI312+ neuritic density (h,i) in Ctx and Hipp after PTN and aCSF infusion compared to 2 weeks post-siPtn or siControl (scrambled siRNA) ICV treatment of TAM-treated pericyte-CreER; iDTR mice receiving vehicle. Mean ± S.E.M., n = 5 mice/group. In e, Bar = 20 μm. In f, TAM + DT + PTN-treated mice compared to TAM + DT + aCSF-treated mice had significantly increased number of NeuN+ neurons in Ctx (P = 1.7E−5), whereas TAM + siPtn-treated mice compared to TAM + siControl-treated mice showed no difference (P = 0.99). In g, TAM + DT + PTN-treated mice compared to TAM + DT + aCSF-treated mice had significantly increased number of NeuN+ neurons in Hipp (P = 3E−4), whereas TAM + siPtn-treated mice compared to TAM + siControl-treated mice showed no difference (P = 0.99). In h, TAM + DT + PTN-treated mice compared to TAM + DT + aCSF-treated mice had significantly increased SMI312+ neuritic density in Ctx (P = 9E−6), whereas TAM + siPtn-treated mice compared to TAM + siControl-treated mice showed no difference (P = 0.99). In i, TAM + DT + PTN-treated mice compared to TAM + DT + aCSF-treated mice had significantly increased SMI312+ neuritic density in Hipp (P= 2.1E−6), whereas TAM + siPtn-treated mice compared to TAM + siControl-treated mice showed no difference (P = 0.53). (j,k) Novel object location (j) and fear conditioning (k) in TAM-treated pericyte-CreER; iDTR mice receiving DT for 10 days and PTN or aCSF ICV infusions at 15 days post-DT, or 2 weeks after siPtn or siControl ICV treatment of TAM-treated pericyte-CreER; iDTR mice. Mean ± S.E.M., n = 5 DT + aCSF, 7 DT + PTN, 7 siPtn and 6 siControl (j) or 5 siControl (k) mice/group. In j, TAM + DT + PTN-treated mice compared to TAM + DT + aCSF-treated mice had significantly increased exploratory preference (P = 3.9E−5), whereas TAM + siPtn-treated mice compared to TAM + siControl-treated mice showed no difference (P = 0.99). In k, TAM + DT + PTN-treated mice compared to TAM + DT + aCSF-treated mice had significantly increased performance on fear conditioning (P = 2.5E−4), whereas TAM + siPtn-treated mice compared to TAM + siControl-treated mice showed no difference (P = 0.99). (l-s) Injury volume and fluoro-jade+ degenerating neurons in mice treated with siPtn or siControl challenged by a transient middle cerebral artery occlusion (MCAo) stroke (l-o) or N-methyl-D-aspartate (NMDA) excitotoxic lesions (p-s). Mean ± S.E.M., n = 5 mice/group. Bar = 20 μm in n and r. In m and o, siPtn-treated mice compared to siControl-treated mice had larger infarcts (m, P = 5.9E−3) and increased number of Fluoro-Jade+ neurons (o, P = 9.7E−3). In q and s, siPtn-treated mice compared to siControl-treated mice had larger lesion volume (q, P = 6.1E−3) and increased number of Fluoro-Jade+ neurons (s, P = 7.8E−3). (t) Neurodegeneration cascade linking pericyte loss to neuron loss. Significance by one-way ANOVA followed by Bonferroni posthoc test in b-d, f-k, and two-tail Student’s t-test in m, o, q, s. See Supplementary Figure 11 for full scans of Western blots used for quantification in c.

Comment in

Similar articles

Cited by

References

    1. Sweeney MD, Zhao Z, Montagne A, Nelson AR & Zlokovic BV Blood-Brain Barrier: From Physiology to Disease and Back. Physiol. Rev 99, 21–78 (2019). - PMC - PubMed
    1. Sweeney MD, Ayyadurai S & Zlokovic BV Pericytes of the neurovascular unit: key functions and signaling pathways. Nat. Neurosci 19, 771–783 (2016). - PMC - PubMed
    1. Gaengel K, Genové G, Armulik A & Betsholtz C Endothelial-mural cell signaling in vascular development and angiogenesis. Arterioscler. Thromb. Vasc. Biol 29, 630–638 (2009). - PubMed
    1. Bell RD et al. Pericytes control key neurovascular functions and neuronal phenotype in the adult brain and during brain aging. Neuron 68, 409–427 (2010). - PMC - PubMed
    1. Armulik A et al. Pericytes regulate the blood-brain barrier. Nature 468, 557–561 (2010). - PubMed

Publication types

MeSH terms