. 2019 Jul;25(7):1164-1174.
doi: 10.1038/s41591-019-0461-z. Epub 2019 Jun 24.

Microbiota therapy acts via a regulatory T cell MyD88/RORγt pathway to suppress food allergy

Affiliations

Microbiota therapy acts via a regulatory T cell MyD88/RORγt pathway to suppress food allergy

Azza Abdel-Gadir et al. Nat Med. 2019 Jul.

Erratum in

Abstract

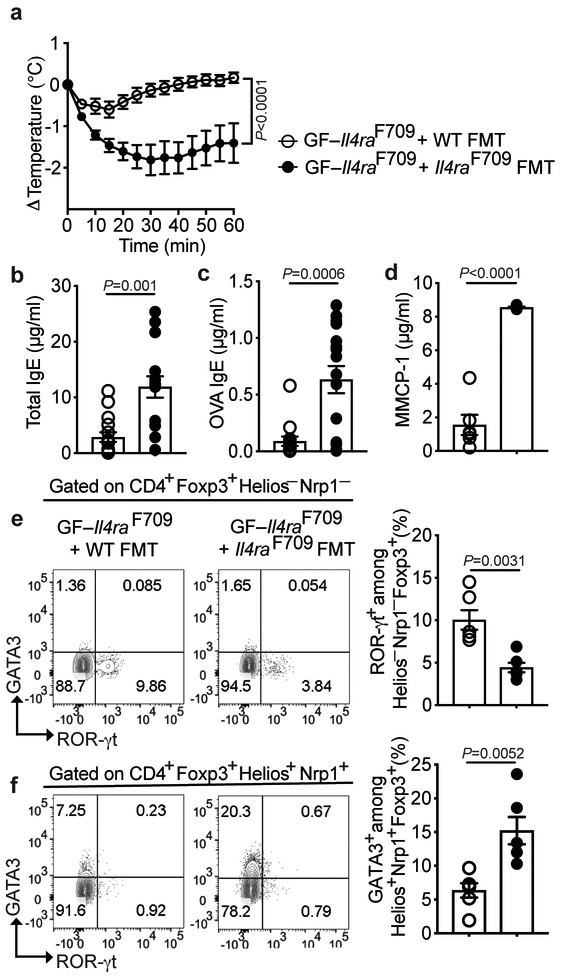
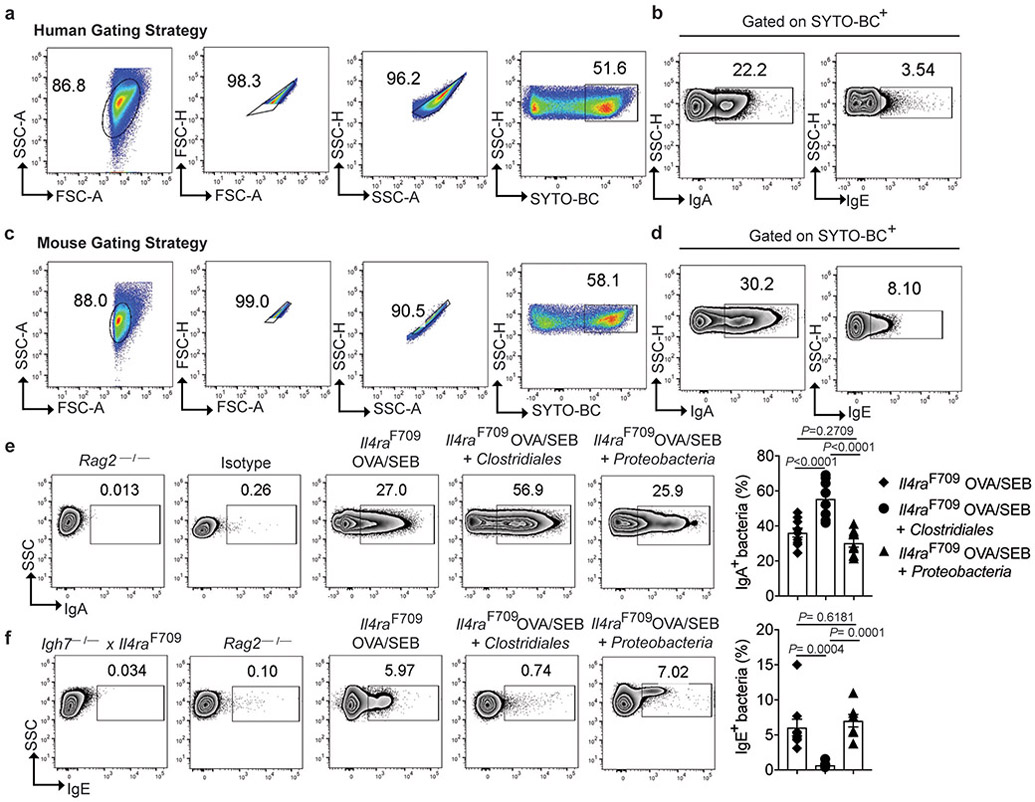
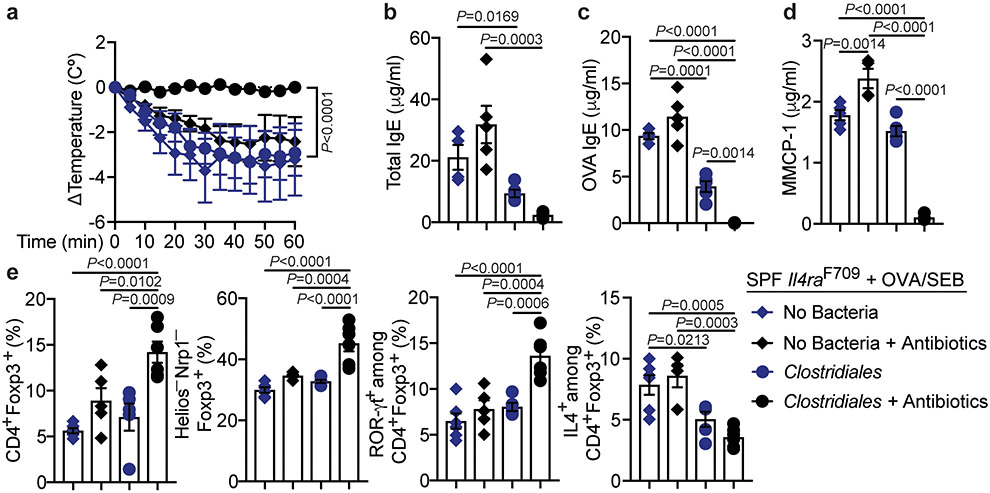
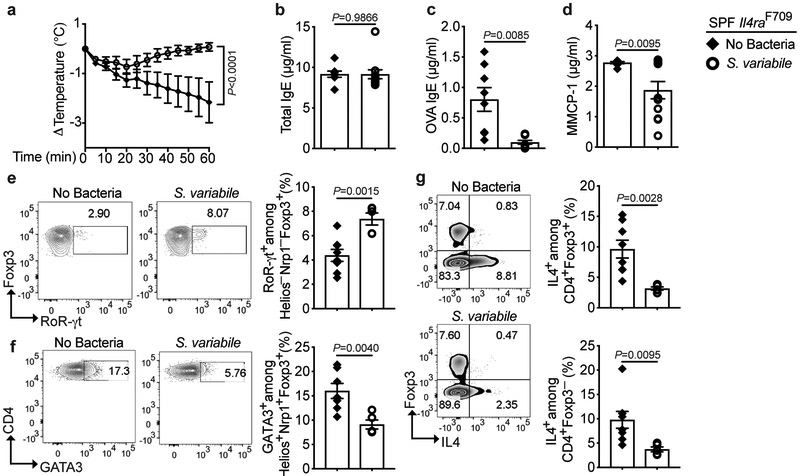
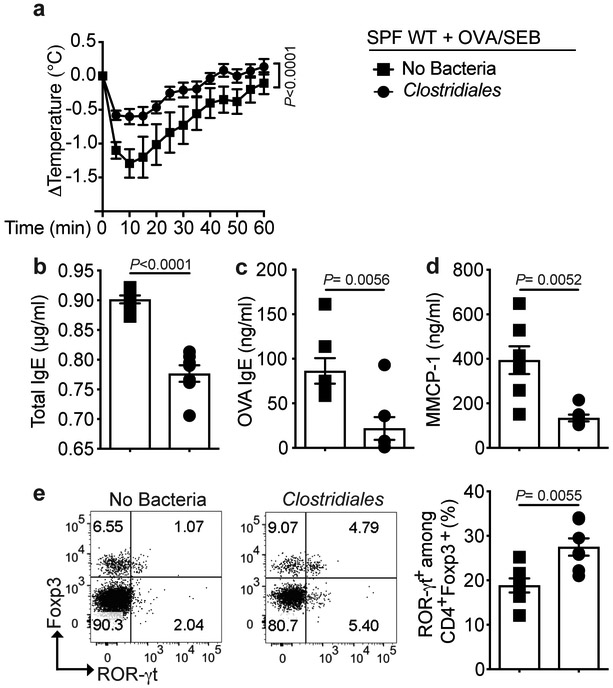
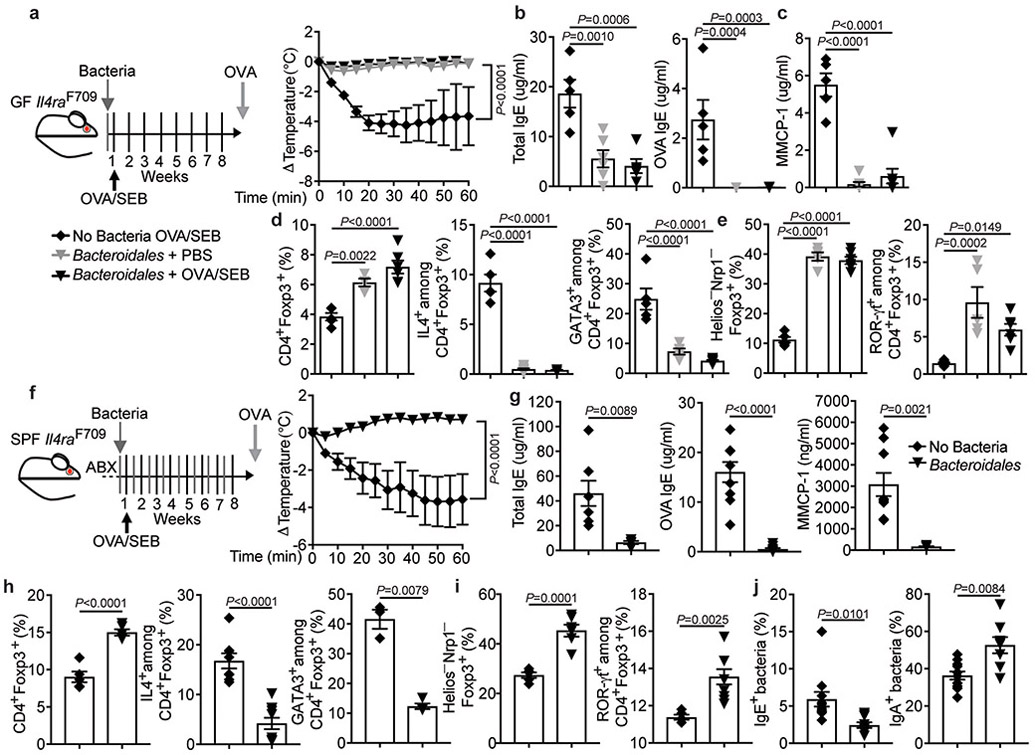
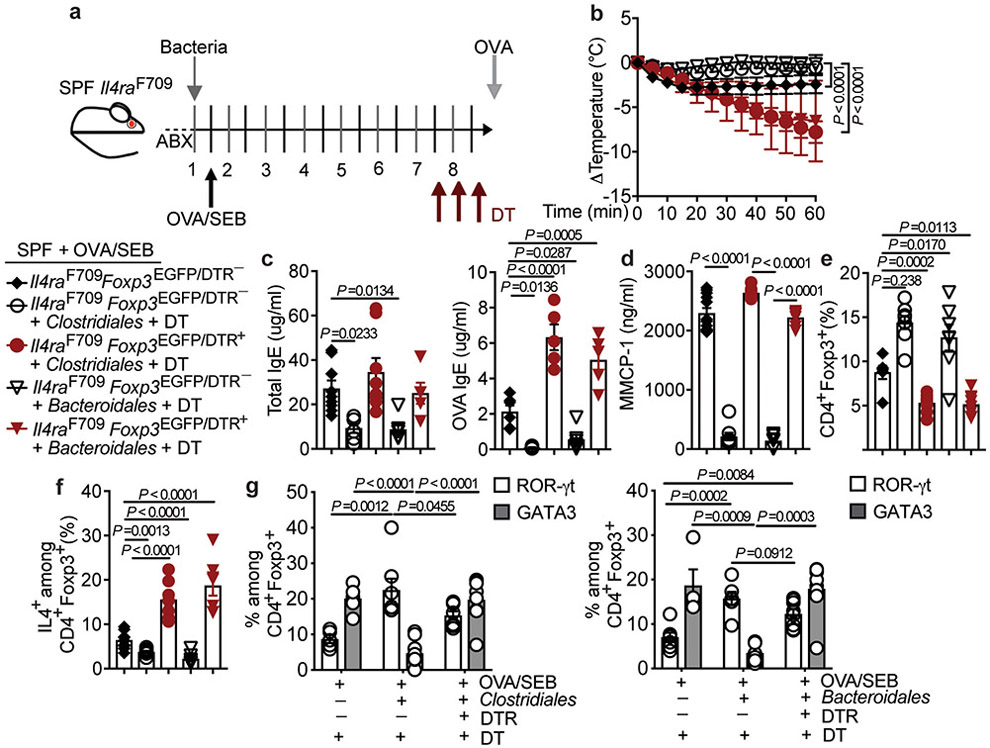
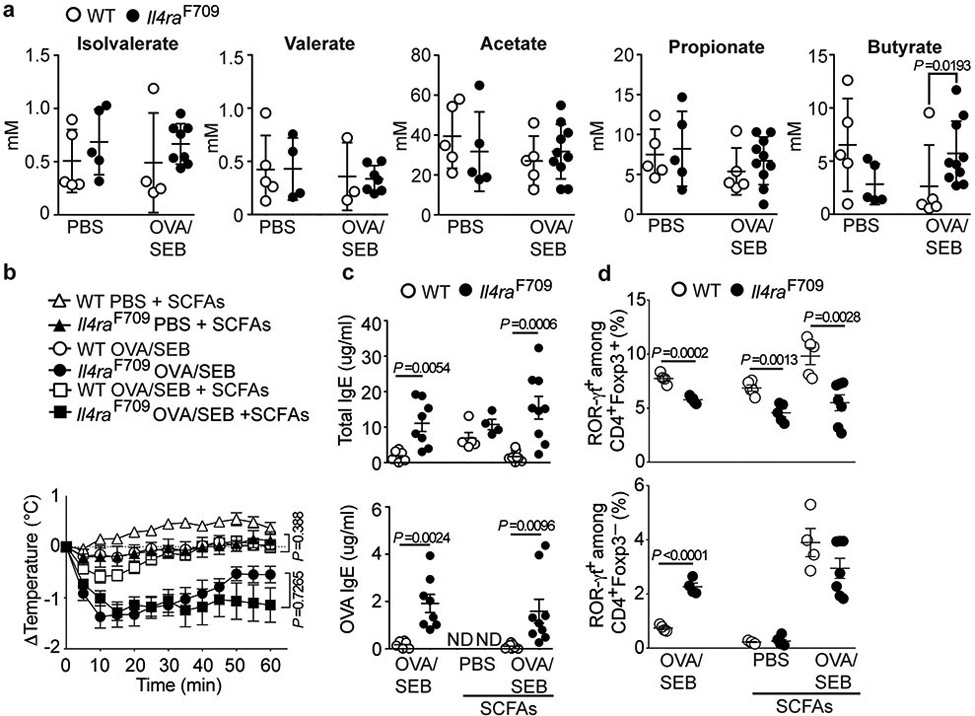
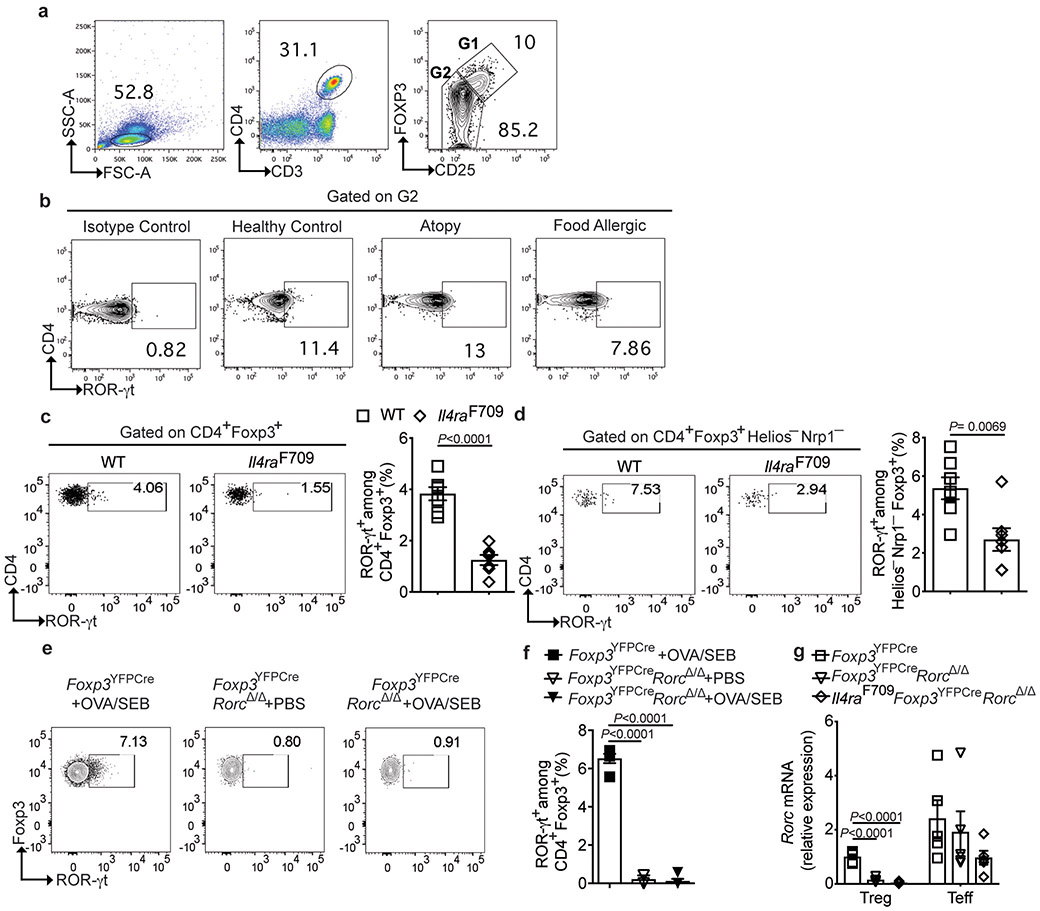
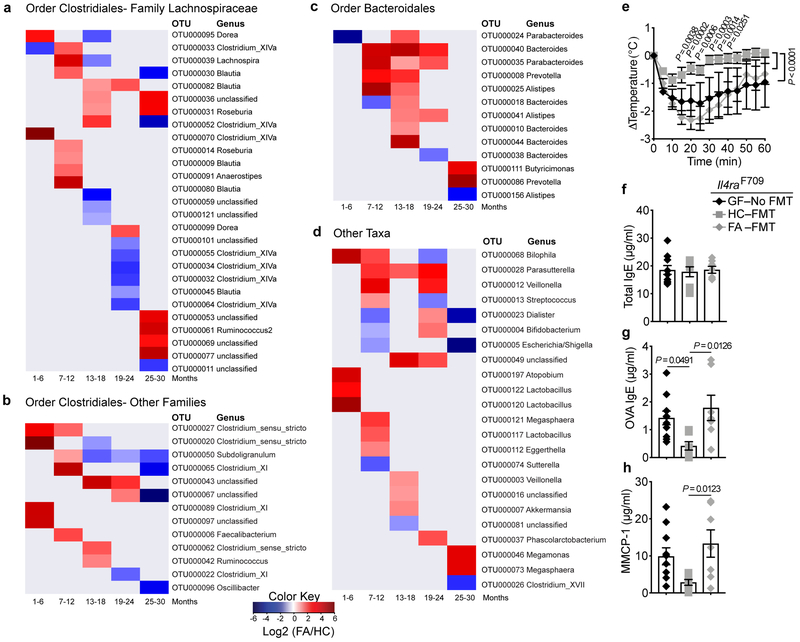
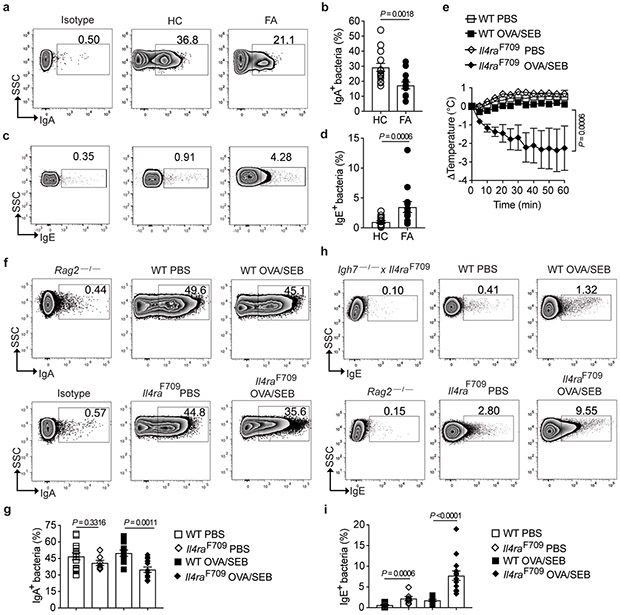
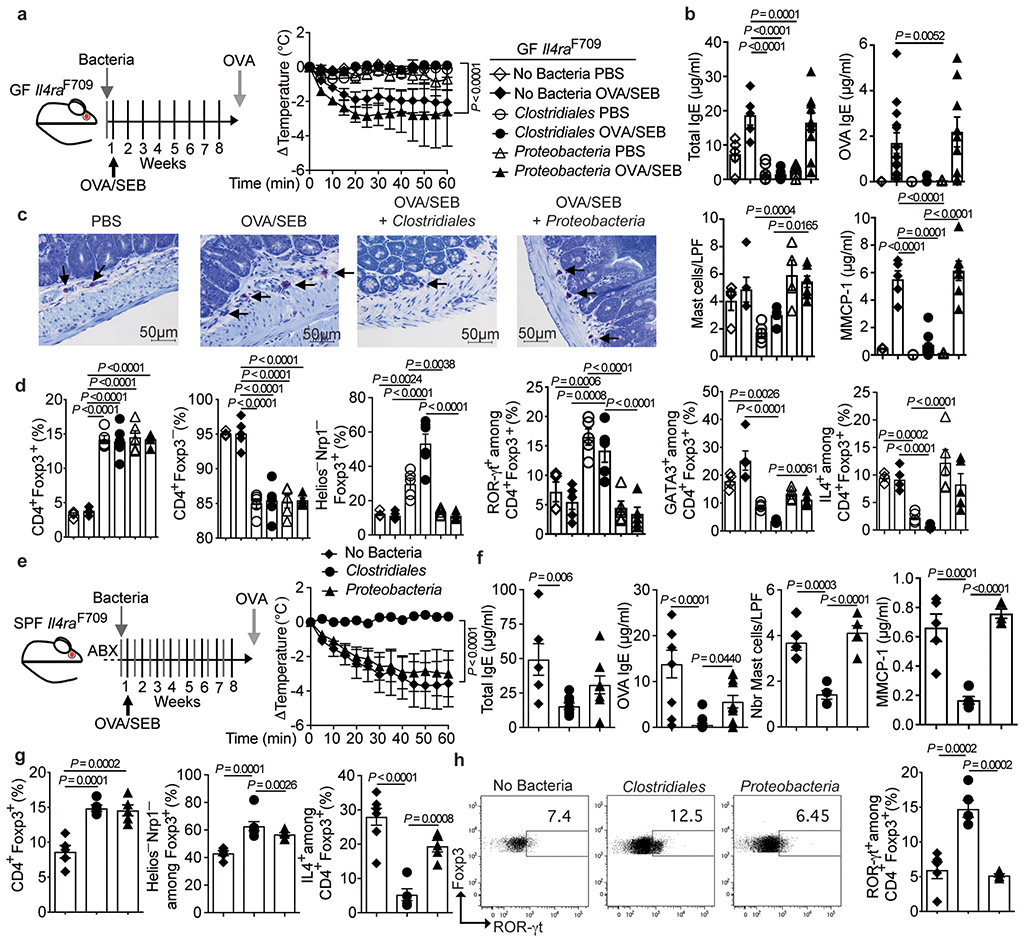
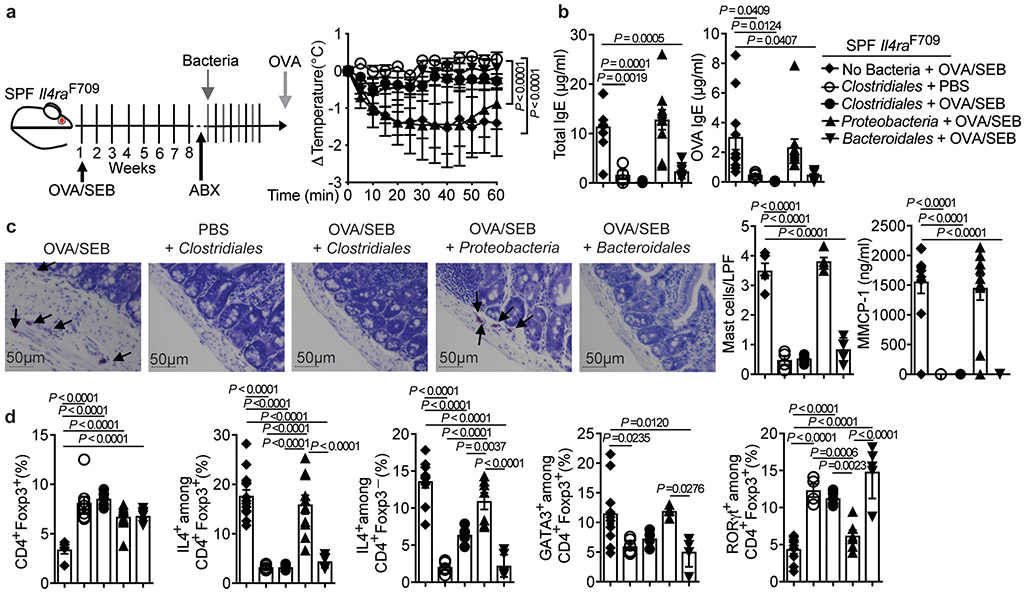
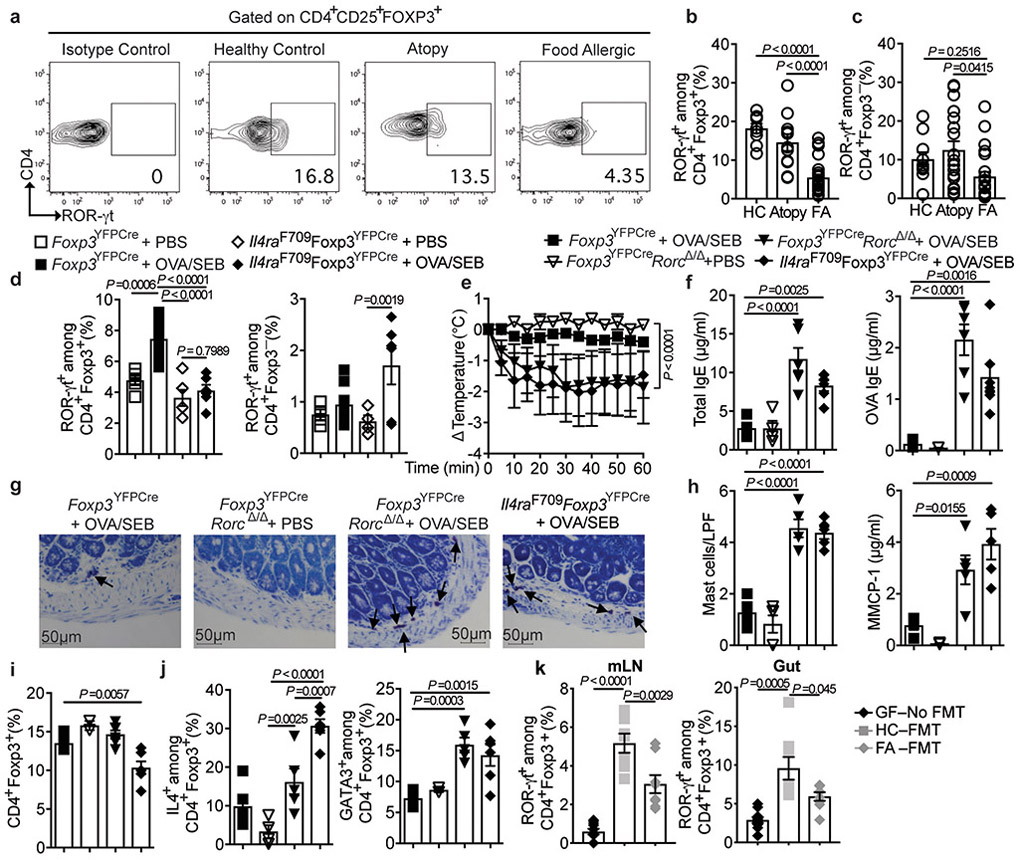
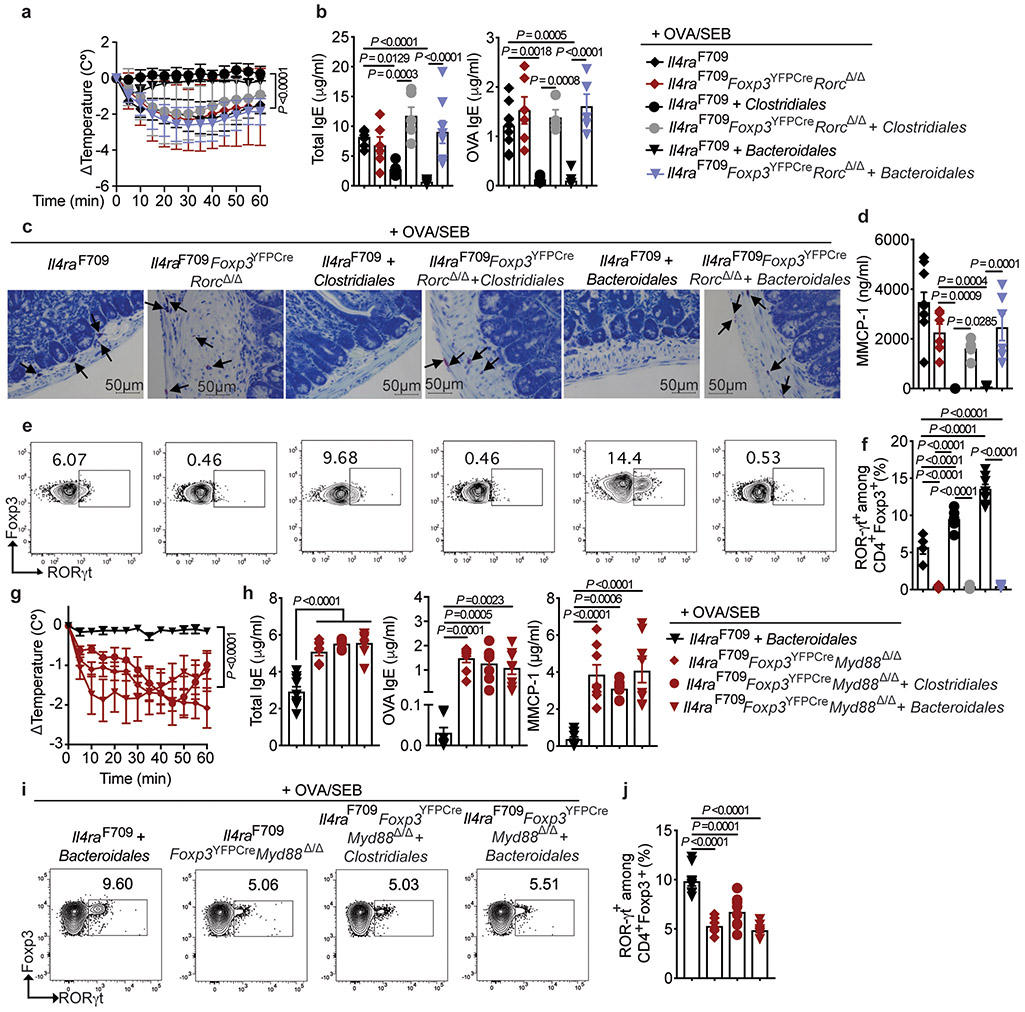
The role of dysbiosis in food allergy (FA) remains unclear. We found that dysbiotic fecal microbiota in FA infants evolved compositionally over time and failed to protect against FA in mice. Infants and mice with FA had decreased IgA and increased IgE binding to fecal bacteria, indicative of a broader breakdown of oral tolerance than hitherto appreciated. Therapy with Clostridiales species impacted by dysbiosis, either as a consortium or as monotherapy with Subdoligranulum variabile, suppressed FA in mice as did a separate immunomodulatory Bacteroidales consortium. Bacteriotherapy induced expression by regulatory T (Treg) cells of the transcription factor ROR-γt in a MyD88-dependent manner, which was deficient in FA infants and mice and ineffectively induced by their microbiota. Deletion of Myd88 or Rorc in Treg cells abrogated protection by bacteriotherapy. Thus, commensals activate a MyD88/ROR-γt pathway in nascent Treg cells to protect against FA, while dysbiosis impairs this regulatory response to promote disease.


Figures

Extended Data Fig. 1.
Extended Data Fig. 1.. FMT from WT mice protects against FA in GF Il4raF709 mice
(a) Temperature changes in GF Il4raF709 mice that were left uncolonized or reconstituted with FMT from WT or Il4raF709 mice, then sensitized with OVA/SEB and challenged with OVA (n=15 WT and 14 Il4raF709 mice). (b,c) Total and OVA-specific serum IgE (n=15 WT and 14 Il4raF709 mice). (d) MMCP-1 concentrations post OVA challenge (n=6 per group). (e,f) Analysis of ROR-γt and GATA3 expression in MLN HeliosNRP1 and Helios+NRP1+ Treg cells (n=6 per group). Each dot represents one mouse. Data represent mean ± s.e.m. from two or three independent experiments. P values were derived by repeat measures two-way ANOVA (a), or by student’s unpaired two tailed t test with Welch correction (b-f).
Extended Data Fig. 2.
Extended Data Fig. 2.. Analysis of IgA- and IgE-bound bacteria in fecal samples.
(a,c) Representative FACS plots showing the gating strategy for human (a) and mouse (c) fecal bacteria. Bacteria present in the feces was identified by gating on SYTO-BC+ events (right side panels). (b,d) frequencies of IgA− and IgE-bound bacteria as assessed by gating on bacteria-bound with the respective PE-labelled anti-IgA and anti-IgE antibodies, as shown in panels a and c. (e,f) Analysis of sIgA+ (e) and IgE+ (f) fecal bacteria of Il4raF709 mice sensitized with OVA/SEB without or with bacterial therapy. Fecal pellets of Rag2−/− and Igh7−/−Il4raF709 mice were used as negative controls. Each symbol in the scatter plots represents one mouse (no treatment: n=11 per group; Clostridiales: n=8 per group; Proteobacteria: n=9 and 7). Data represent mean ± s.e.m. from two independent experiments. Flow panels in (c,d) are representative of two two independent experiments. P values were derived by one-way ANOVA with Dunnett post hoc analysis.
Extended Data Fig. 3.
Extended Data Fig. 3.. Antibiotic therapy potentiates the therapeutic efficacy of the Clostridiales consortium in Il4raF709 mice.
(a) Temperature changes in the respective OVA/SEB-sensitized and OVA-challenged SPF Il4raF709 mouse groups treated as follows: no antibiotics (n=6), Clostridiales (n=5) and antibiotics without or with Clostridiales (n=5 per group). P values were derived by two-way ANOVA. (b,c) Total and OVA-specific IgE [no antibiotics (n=4 per group), Clostridiales (n=5 per group) and antibiotics without (n=5 per group) or with Clostridiales (n=4 per group)]. (d) MMCP-1 concentrations [no antibiotics (n=5), Clostridiales (n=5) and antibiotics without (n=4) or with Clostridiales (n=4)]. (e) Frequencies of total CD4+Foxp3+, HeliosNRP1Foxp3+, ROR-γt+CD4+Foxp3+ and IL-4+ CD4+Foxp3+ Treg cells in the MLN of the respective mouse group [no antibiotics (n=6), Clostridiales (n=5) and antibiotics without (n=5) or with Clostridiales (n=5)]. Each dot represents one mouse. Throughout, data represent mean ± s.e.m. from two independent experiments. Unless otherwise indicated, P values were derived by one-way ANOVA with Dunnett post hoc analysis.
Extended Data Fig. 4.
Extended Data Fig. 4.. Bacteriotherapy with Subdoligranulum variabile protects against FA.
(a) Temperature changes in SPF Il4raF709 mice that were antibiotic-treated then sensitized with OVA/SEB while receiving no treatment (n=8) or treatment with the Subdoligranulum variabile (n=11), and thereafter challenged with OVA. P values were derived by two-way ANOVA. (b,c) Total and OVA-specific IgE (no bacteria: n=8; Subdoligranulum variabile: n=11). (d) MMCP-1 concentrations (no bacteria: n=8; Subdoligranulum variabile: n=11). (e,f) Analysis of MLN ROR-γt+ and GATA3+ cells among HeliosNRP1 and Helios+NRP1+ Foxp3+ Treg cells, respectively (no bacteria: n=8; Subdoligranulum variabile: n=5). (g) Analysis of MLN IL-4+ CD4+Foxp3+ Treg cells and IL-4+ CD4+Foxp3 Teff cells (no bacteria: n=8; Subdoligranulum variabile: n=5). Each dot represents one mouse. Throughout, data represent mean ± s.e.m. from two independent experiments. For panels b-g, P values were derived by Student’s unpaired two tailed t test with Welch correction.
Extended Data Fig. 5.
Extended Data Fig. 5.. Clostridiales protects against percutaneous sensitization-induced FA.
(a) Temperature changes in SPF WT BALB/c mice that were antibiotic-treated then percutaneously sensitized with OVA/SEB while receiving either no treatment (n=14) or treatment with Clostridales (n=11), and thereafter challenged with OVA. P values were derived by two-way ANOVA. (b,c) Total and OVA-specific IgE concentrations (n=7 per group). (d) MMCP-1 concentrations (n=7 per group). (e) Analysis of small intestinal LPL ROR-γt+ CD4+Foxp3+ Treg cells (n=7 per group). Each dot represents one mouse. Data represent mean ± s.e.m. from two independent experiments. For panels b-e, P values were derived by Student’s unpaired two tailed t test with Welch correction.
Extended Data Fig. 6.
Extended Data Fig. 6.. A Bacteroidales consortium prevents FA. A Bacteroidales consortium prevents FA.
(a) Left: Experimental schema. Right: temperature changes in GF Il4raF709 mice that were colonized and sensitized as indicated then challenged with OVA (n=5 per group). (b,c) Total and OVA-specific IgE (b) and MMCP-1 concentrations (c). GF, OVA/SEB (n=5 per group), Bacteroidales, PBS (n=6, 7 and 7), Bacteroidales, OVA/SEB (n=6, 6 and 7). (d) Frequencies of MLN CD4+Foxp3+, IL-4+Foxp3+ and GATA3+Foxp3+ T cells. GF, OVA/SEB (n=5 per group), Bacteroidales, PBS (n=4, 8 and 5), Bacteroidales, OVA/SEB (n=6, 5 and 6). (e) Frequencies of HeliosNrp1Foxp3+ and ROR-γt+Foxp3+ T cells. GF, OVA/SEB (n=5 and 7), Bacteroidales, PBS (n=5 per group), Bacteroidales, OVA/SEB (n=6 per group). (f) Left: Experimental Schema. Right: temperature changes in Il4raF709 mice sensitized and treated as indicated. OVA/SEB (n=6), OVA/SEB, Bacteroidales, (n=5). (g) Total and OVA-specific IgE and MMCP-1 concentrations. OVA/SEB (n=7, 9 and 9), OVA/SEB, Bacteroidales, (n=5, 10 and 5). (h,i) Frequencies of MLN CD4+Foxp3+, IL-4+Foxp3+ and GATA3+Foxp3+ (h) and HeliosNrp1Foxp3+ and ROR-γt+Foxp3+ T cells (i). OVA/SEB (n=5, 8 and 3, 5 and 5), OVA/SEB, Bacteroidales (n=5, 10, 4, 6 and 9). (j) IgE and IgA staining of fecal bacteria. OVA/SEB (n=11 per group), OVA/SEB, Bacteroidales (n=8 per group). Each dot represents one mouse. Data represent mean ± s.e.m. from two independent experiments. P values were derived by repeat measures two-way ANOVA (a,f), by one-way ANOVA with Dunnett post hoc analysis (b-e) or by Student’s unpaired two tailed t test (h-j).
Extended Data Fig. 7.
Extended Data Fig. 7.. Depletion of Treg cells abrogates protection by the microbiota.
(a) Experimental schema. (b) Temperature changes in the respective OVA/SEB-sensitized and OVA-challenged mouse groups: Il4raF709Foxp3EGFP/DTR− (n=6), Il4raF709Foxp3EGFP/DTR−+Clostridiales+DT (n=7), Il4raF709Foxp3EGFP/DTR++Clostridiales+DT (n=8), Il4raF709Foxp3EGFP/DTR−+Bacteroidales+DT (n=9), Il4raF709Foxp3EGFP/DTR++Bacteroidales+DT (n=7). (c) Total and OVA-specific IgE in the groups listed in (b) (Total IgE: n=9, 6, 8, 7 and 5; OVA-specific IgE:6, 5, 5, 5, and 5 ). (d) MMCP-1 concentrations (n=12 for Il4raF709Foxp3EGFP/DTR−, and n=8 per group for all other groups). (e,f) Frequencies of MLN CD4+Foxp3+ and IL-4+Foxp3+ T cells [Il4raF709Foxp3EGFP/DTR− (n=6 and 10), Il4raF709Foxp3EGFP/DTR−+Clostridiales+DT (n=8 and 7), Il4raF709Foxp3EGFP/DTR++Clostridiales+DT (n=8 and 7), Il4raF709Foxp3EGFP/DTR−+Bacteroidales+DT (n=8 and 7), Il4raF709Foxp3EGFP/DTR++Bacteroidales+DT (n=8 and 7)]. (g) Frequencies of ROR-γt+Foxp3+ and GATA3+Foxp3+ T cells [Il4raF709Foxp3EGFP/DTR− (n=5 per group), Il4raF709Foxp3EGFP/DTR−+Clostridiales+DT (n=7 and 9), Il4raF709Foxp3EGFP/DTR++Clostridiales+DT (n=8 per group), Il4raF709Foxp3EGFP/DTR−+Bacteroidales+DT (n=6 per group), Il4raF709Foxp3EGFP/DTR++Bacteroidales+DT (n=8 pre group)]. Each dot represents one mouse. Data represent mean ± s.e.m. from two independent experiments. P values were derived by repeat measures two-way ANOVA (b), or by one-way ANOVA with Dunnett post hoc analysis or Student’s unpaired two tailed t test (c-f).
Extended Data Fig. 8.
Extended Data Fig. 8.. Oral SCFA supplementation does not protect against FA.
SCFA in fecal samples of PBS or OVA/SEB-sensitized WT and Il4raF709 mice. Acetate, propionate and butyrate: WT, PBS or OVA/SEB (n=5 per group); Il4raF709, PBS (n=5 per group) or OVA/SEB (n=10 per group). Isovalerate, WT, PBS or OVA/SEB (n=5 and 4); Il4raF709, PBS or OVA/SEB (n=5 and 8). Valerate, WT, PBS or OVA/SEB (n=5 and 3); Il4raF709, PBS or OVA/SEB (n=4 and 7). (b) Temperature changes in OVA-challenged WT and Il4raF709 mice sensitized with PBS or OVA/SEB without or with SCFA supplementation. WT, PBS+SCFA (n=10), WT, OVA/SEB (n=11), WT, OVA/SEB+SCFA (n=24); Il4raF709, PBS+SCFA (n=12), Il4raF709, OVA/SEB (n=7), Il4raF709, OVA/SEB+SCFA (n=17). (c) Total and OVA-specific IgE. WT, PBS+SCFA (n=5 per group), WT, OVA/SEB (n=6 per group), WT, OVA/SEB+SCFA (n=9 per group); Il4raF709, PBS+SCFA (n=4 per group), Il4raF709, OVA/SEB (n=8 per group), Il4raF709, OVA/SEB+SCFA (n=9 per group). (d) Frequencies of MLN CD4+Foxp3+ROR-γt+ and CD4+Foxp3−ROR-γt+ T cells. WT, PBS+SCFA (n=5 per group), WT, OVA/SEB (n=4 per group), WT, OVA/SEB+SCFA (n=4 per group); Il4raF709, PBS+SCFA (n=5 per group), Il4raF709, OVA/SEB (n=5 per group), Il4raF709, OVA/SEB+SCFA (n=7 per group). Each dot represents one mouse. Data represent mean ± s.e.m. from two independent experiments. P values were derived by the Kolmogorov–Smirnov test (a), by the Student’s unpaired two tailed t test (c,d) or by two-way ANOVA (b).
Extended Data Fig. 9.
Extended Data Fig. 9.. Analysis of ROR-γt+ expression in human subjects and mutant mice.
(a) Gating strategy for CD4+Foxp3+ (G1) and CD4+Foxp3 T (G2) cells ex vivo. (b) Gating strategy for the expression of ROR-γt in Teff cells (G2) from FA patients, healthy controls (HC) and atopic subjects (atopy), as compared to an isotype control. (c) Flow plots and frequencies of peripheral blood CD4+Foxp3+ROR-γt+ T cells in WT and Il4raF709 mice (n=7 mice per group). (d) Flow plots and frequencies of peripheral blood CD4+Foxp3+HeliosNRP1ROR-γt+ T cells in WT and Il4raF709 mice (n=7 mice per group). (e,f) Flow plots and frequencies of MLN CD4+Foxp3+ROR-γt+ T cells from Foxp3YFPCre mice sensitized with OVA/SEB, and Foxp3YFPCreRorcΔ/Δ either sham sensitized (PBS) or sensitized with OVA/SEB, as indicated (n= 5 mice per group). (g) Quantitative RT-PCR of Rorc gene expression in MLN CD4+Foxp3+ Treg and CD4+Foxp3 Teff cells from Foxp3YFPCre, Foxp3YFPCreRorcΔ/Δ, and Il4raF709Foxp3YFPCreRorcΔ/Δ mice. Data were normalized to the endogenous Hprt transcripts (n= 5 mice per group). Each dot represents one mouse. Results represent Means ± S.E.M. collated from 2 independent experiments. P values were derived by the Student’s unpaired two tailed t test with Welch correction (c,d), or by one-way ANOVA with Dunnett post hoc analysis (f,g).
Extended Data Fig. 10.
Extended Data Fig. 10.. Treg cell-specific deletion of Rorc and Myd88 impairs mucosal tolerance.
(a-d) Analysis of sIgA+ (a,b) and IgE+ (c.d) fecal bacteria in OVA/SEB-sensitized Foxp3YFPCre, Il4raF709Foxp3YFPCre and Foxp3YFPCreRorcΔ/Δ mice. Fecal pellets of Rag2−/− and Igh7−/−Il4raF709 mice were used as negative controls [Foxp3YFPCre (n=6 per group), Il4raF709Foxp3YFPCre (n=11 and 7), and Foxp3YFPCreRorcΔ/Δ mice (n=10 and 8)]. (e-f) Analysis of GATA3+Foxp3+ Treg cells in the following OVA/SEB-sensitized mice that were either untreated or treated with Clostridiales or Bacteroidales consortia: Il4raF709Foxp3YFPCre (n=9, 5 and 5), and Il4raF709Foxp3YFPCreRorcΔ/Δ (n= 4, 5 and 8). (g,h) Analysis of GATA3+Foxp3+ Treg cells in OVA/SEB-sensitized Il4raF709Foxp3YFPCre mice treated with the Bacteroidales consortium (n=9), and in OVA/SEB-sensitized Il4raF709Foxp3YFPCreMyd88Δ/Δ mice otherwise untreated or treated with the Clostridiales or Bacteroidales consortia (n= 8, 9 and 8). Each symbol represents one mouse. Results represent Means ± S.E.M. collated from 2 independent experiments. P values were derived by one-way ANOVA with Dunnett post hoc analysis (b,d,f,h).
Fig. 1.
Fig. 1.. FA infants exhibit an evolving gut dysbiosis.
(a-d) Heat map representations of log2 fold relative abundances of fecal bacterial taxa between FA and health control (HC) infants displayed across the different age groups: 1-6, 7-12, 3-18, 19-24, and 25-30 months. For detailed group description and subject characteristics, see Supplementary Figure 1 and Supplementary Table 1 and. Taxa represented included those from the order Clostridiales, family Lachnospiraceae (a), order Clostridiales, other Families (b), order Bacteroidales (c) and miscellaneous taxa (d). Blue represents higher abundance in control subjects, and red represents higher abundance in FA subjects. Taxonomic information is on the right side of the respective panel. (e) Core body temperature changes in GF Il4raF709 mice that were left uncolonized or reconstituted with FMT from HC or FA subjects, then sensitized with OVA/SEB and challenged with OVA (n=7 per group; each recipient mouse received FMT from one HC or FA subject). P values were derived by two-way ANOVA with Sidak post hoc analysis. (f,g) Total and OVA-specific serum IgE concentrations (n=7 per group, as in (e)). (h) MMCP-1 concentrations (n=7 per group, as in (e)). Results represent mean ± s.e.m. from two or three independent experiments. Each symbol represents one subject or mouse. For f-h, P values were derived by One-way ANOVA with Dunnett’s post hoc analysis.
Fig. 2.
Fig. 2.. Altered mucosal antibody responses to the gut microbiota in FA.
(a-d) Flow cytometric analysis and frequencies of human fecal bacteria of FA and HC subjects stained with a PE-conjugated isotype control mAb or mouse anti-human IgA (a and b) or IgE mAb (c and d). n= 15 HC and n=13 FA subjects for panel (b), and n=14 HC and n=13 FA subjects for panel (d). (e) Temperature changes in WT (n=10 mice per group) and Il4raF709 mice (n=7 per group) that have been either PBS or OVA/SEB-sensitized then challenged with OVA. (f-i) Flow cytometric analysis and frequencies of IgA (f and g) and IgE (h and i) staining of fecal bacteria of WT and Il4raF709 mice that were sensitized with PBS (n= 14 and 7 per group, respectively) or OVA/SEB (n=10 and 14 per group). Fecal pellets of Rag2−/− and Il4raF709Igh7−/− mice were used as negative controls for sIgA and IgE staining, respectively. Results represent mean ± s.e.m. from two or three independent experiments. Each symbol represents one subject or mouse. P values were derived by Student’s unpaired two tailed t test. (b,d,i), by repeat measures two-way ANOVA (e),. or by one-way analysis of variance (ANOVA) with Dunnett post hoc analysis (g).
Fig. 3.
Fig. 3.. A consortium of Clostridiales species prevents FA.
(a) Left: Experimental schema. Right: temperature changes in GF Il4raF709 mice that were colonized and sensitized as indicated then challenged with OVA. GF, PBS (n=5 mice), GF, OVA/SEB (n=10), Clostridiales, PBS (n=5), Clostridiales, OVA/SEB (n=6), Proteobacteria, PBS (n=8), Proteobacteria, OVA/SEB (n=5). (b) Total and OVA-specific IgE concentrations. GF, PBS (n=5 and 3), GF, OVA/SEB (n=5 and 13), Clostridiales, PBS (n=5 each), Clostridiales, OVA/SEB (n=6 and 7), Proteobacteria, PBS (n=5 and 4), Proteobacteria, OVA/SEB (n=10 and 9). (c) Jejunal mast cells (arrows) and counts per low powered field (LPF) and MMCP-1 concentrations. GF, PBS (n=5 per group), GF, OVA/SEB (n=5 per group), Clostridiales, PBS (n=5 per group), Clostridiales, OVA/SEB (n=5 and 7), Proteobacteria, PBS (n=4 and 5), Proteobacteria, OVA/SEB (n=7 per group). (d) Frequencies of MLN Treg and Teff cell populations (n=5 per group). (e) Left: Experimental schema; Abx: antibiotics. Right: temperature changes in OVA/SEB-sensitized and OVA-challenged Il4raF709 mice treated as indicated. No bacteria (n=6), Clostridiales (n=7), Proteobacteria, (n=6). (f) Total and OVA-specific IgE. No bacteria (n=6 and 9), Clostridiales (n=8 and 17), Proteobacteria, (n=8 and 11); mast cell counts (n=5 per group) and MMCP-1 concentrations (n=5 per group). (g) Frequencies of MLN Treg cell populations in the respectively treated mice: CD4+Foxp3+ (n=5 per group), HeliosNRP1Foxp3+ (n=, 5, 7 and 6) and IL-4+Foxp3+ (n=6, 5 and 5). (h) Analysis of ROR-γt+Foxp3+ Treg cells (n=5 per group). Results represent mean ± s.e.m. from three independent experiments. Each symbol represents one mouse. P values were derived by repeat measures two-way ANOVA (a,e), or by one-way ANOVA with Dunnett post hoc analysis (c-d,f-h).
Fig. 4.
Fig. 4.. Clostridiales and Bacteroidales consortia suppresses established FA.
(a) Left: experimental scheme. Right: temperature changes following OVA challenge in Il4raF709 mice sensitized and treated as follows: OVA/SEB, no bacteria (n=8 mice); PBS, Clostridiales (n=6) and OVA/SEB, Clostridiales (n=10), Bacteroidales (n=5) or Proteobacteria (n=5). (b) Total and OVA-specific IgE concentrations [OVA/SEB, no bacteria (n=10 per group); PBS, Clostridiales (n=4 and 5 per group, respectively) and OVA/SEB, Clostridiales (n=5 per group), Bacteroidales (n=7 and 5 per group) or Proteobacteria (n=10 and 11 per group). (c) Jejunal mast cells (arrows), mast cell counts per LPF [OVA/SEB, no bacteria (n=5); PBS, Clostridiales (n=4) and OVA/SEB, Clostridiales, Bacteroidales or Proteobacteria (n=5 per group)], MMCP-1 concentrations [OVA/SEB, no bacteria (n=10); PBS, Clostridiales (n=5) and OVA/SEB, Clostridiales (n=5), Bacteroidales (n=6) or Proteobacteria (n=11)]. (d) Frequencies of MLN CD4+Foxp3+ and IL-4+CD4+Foxp3+ Treg cells [OVA/SEB-, no bacteria (n=5 and 14); PBS, Clostridiales (n=8 and 5) and OVA/SEB, Clostridiales (n=5 per group), Bacteroidales (n=6 and 5) or Proteobacteria (n=12 and 10)], IL-4+CD4+Foxp3 T cells [OVA/SEB, no bacteria (n=10); PBS, Clostridiales (n=5) and OVA/SEB, Clostridiales (n=6), Bacteroidales (n=6) or Proteobacteria (n=7)], GATA3+Foxp3+ T cells [OVA/SEB, no bacteria (n=10 mice); PBS, Clostridiales (n=6) and OVA/SEB, Clostridiales (n=4), Bacteroidales (n=5) or Proteobacteria (n=4)], and ROR-γt+Foxp3+ T cells [OVA/SEB, no bacteria (n=9); PBS, Clostridiales (n=4) and OVA/SEB, Clostridiales (n=5), Bacteroidales (n=5) or Proteobacteria (n=6)]. Results represent mean ± s.e.m. from three independent experiments. Each symbol represents one mouse. P values were derived by repeat measures two-way ANOVA (a), or by one-way ANOVA with Dunnett post hoc analysis (b-d).
Fig. 5.
Fig. 5.. ROR-γt+ Treg cell deficiency promotes FA.
(a-c) Flow cytometric analysis and frequencies of circulating ROR-γt+Foxp3+ Treg cells and ROR-γt+Foxp3 T cells in HC (n=10), atopy (n=11) and FA (n=22) subjects. (d) Frequencies of MLN ROR-γt+Foxp3+ and ROR-γt+Foxp3 T cells in the following PBS- or OVA/SEB-sensitized mouse groups: Foxp3YFPCre, PBS (n=5), Foxp3YFPCre, OVA/SEB (n=9) and Il4raF709Foxp3YFPCre, PBS or OVA/SEB (n=6 per group). (e) Temperature changes in the respective OVA-challenged mouse groups sensitized as follows: Foxp3YFPCre, OVA/SEB (n=6), Foxp3YFPCreRorcΔ/Δ PBS or OVA/SEB (n=5 per group) and Il4raF709Foxp3YFPCre OVA/SEB (n=5). (f) Total and OVA-specific IgE responses [Foxp3YFPCre OVA/SEB (n=5 per group), Foxp3YFPCreRorcΔ/Δ PBS (n=5 per group) or OVA/SEB (n=6 per group) and Il4raF709Foxp3YFPCre OVA/SEB (n=6 per group). (g) Jejunal mast cell staining (arrows), representative of two experiments. (h), mast cell numbers/LPF (n=5 mice per group) and MMCP1 concentrations [Foxp3YFPCre OVA/SEB (n=4), Foxp3YFPCreRorcΔ/Δ PBS (n=4), Foxp3YFPCreRorcΔ/Δ OVA/SEB (n=5) and Il4raF709Foxp3YFPCre OVA/SEB (n=5)]. (i) Frequencies of MLN CD4+Foxp3+ T cells [Foxp3YFPCre OVA/SEB (n=5), Foxp3YFPCreRorcΔ/Δ PBS (n=5), Foxp3YFPCreRorcΔ/Δ OVA/SEB (n=6) and Il4raF709Foxp3YFPCre OVA/SEB (n=6)]. (j), Frequencies of MLN IL-4+Foxp3+ and GATA3+Foxp3+ T cells [Foxp3YFPCre OVA/SEB (n=5), Foxp3YFPCreRorcΔ/Δ PBS (n=5), Foxp3YFPCreRorcΔ/Δ OVA/SEB (n=5) and Il4raF709Foxp3YFPCre OVA/SEB (n=6)]. (k) Frequencies of ROR-γt+Foxp3+ T cells in the MLN and small intestinal LPL of OVA/SEB-sensitized and OVA challenged GF Il4raF709 mice without (n=10) or with FMT from HC or FA subjects (n=7 per group). Results represent mean ± s.e.m. from two independent experiments. Each symbol represents one mouse or subject. P values were derived by one-way ANOVA with Dunnett post hoc analysis (b-d,f,h-k), or by repeat measures two-way ANOVA (e).
Fig. 6.
Fig. 6.. Protection against FA by commensals requires ROR-γt+ Treg cells.
(a) Temperature changes in the respective OVA-challenged mouse groups sensitized as follows: Il4raF709 OVA/SEB (n=9), OVA/SEB, Clostridiales (n=5), and OVA/SEB, Bacteroidales (n=7); Il4raF709 Foxp3YFPCreRorcΔ/Δ OVA/SEB (n=8), OVA/SEB, Clostridiales (n=6) and OVA/SEB, Bacteroidales (n=10). (b) total and OVA-specific IgE [Il4raF709 OVA/SEB (n=9 and 5), OVA/SEB, Clostridiales (n=5 per group), and OVA/SEB, Bacteroidales (n=9 and 8); Il4raF709 Foxp3YFPCreRorcΔ/Δ OVA/SEB (n=6 per group), OVA/SEB, Clostridiales (n=6 and 4) and OVA/SEB, Bacteroidales (n=8 and 5)]. (c,d) Jejunal mast cells (arrows), representative of two experiments (c), and MMCP-1 concentrations (d) [Il4raF709 OVA/SEB (n=10), OVA/SEB, Clostridiales (n=5), and OVA/SEB, Bacteroidales (n=8); Il4raF709 Foxp3YFPCreRorcΔ/Δ OVA/SEB (n=6), OVA/SEB, Clostridiales (n=6) and OVA/SEB, Bacteroidales (n=6). (e,f) Analysis of MLN ROR-γt+Foxp3+ Treg cells, representative of two experiments [Il4raF709 OVA/SEB (n=8), OVA/SEB, Clostridiales (n=5), and OVA/SEB, Bacteroidales (n=9); Il4raF709 Foxp3YFPCreRorcΔ/Δ OVA/SEB (n=5), OVA/SEB, Clostridiales (n=6) and OVA/SEB, Bacteroidales (n=6). (g) Temperature changes in the following OVA/SEB-sensitized and OVA-challenged mouse groups: Il4raF709Foxp3YFPCre, Bacteroidales (n=14), and Il4raF709Foxp3YFPCreMyd88Δ/Δ mice untreated (n=8) or treated with Clostridiales (n=7) or Bacteroidales (n=8). (h) Total and OVA-specific IgE and MMCP1 concentrations [Il4raF709Foxp3YFPCre, Bacteroidales (n=9 per group), Il4raF709Foxp3YFPCreMyd88Δ/Δ mice untreated (n=8 per group) or treated with Clostridiales (n=7 per group) or Bacteroidales (n=8 per group). (I,j) Analysis of MLN ROR-γt+Foxp3+ Treg cells in the same groups in (h). Results represent mean ± s.e.m. from two independent experiments. Each symbol represents one mouse. P values were derived by one-way ANOVA with Dunnett post hoc analysis (b,d,f,h,j), or by repeat measures two-way ANOVA (a,g).

References

    1. Branum AM & Lukacs SL Food allergy among children in the United States. Pediatrics 124, 1549–1555 (2009). - PubMed
    1. Wills-Karp M, Santeliz J & Karp CL The germless theory of allergic disease: revisiting the hygiene hypothesis. Nat Rev Immunol 1, 69–75 (2001). - PubMed
    1. Ly NP, Litonjua A, Gold DR & Celedon JC Gut microbiota, probiotics, and vitamin D: interrelated exposures influencing allergy, asthma, and obesity? J Allergy Clin Immunol 127, 1087–1094; quiz 1095–1086 (2011). - PMC - PubMed
    1. Koplin J, et al. Is caesarean delivery associated with sensitization to food allergens and IgE-mediated food allergy: a systematic review. Pediatric allergy and immunology : official publication of the European Society of Pediatric Allergy and Immunology 19, 682–687 (2008). - PubMed
    1. Bjorksten B Disease outcomes as a consequence of environmental influences on the development of the immune system. Curr Opin Allergy Clin Immunol 9, 185–189 (2009). - PubMed

Publication types

Substances