. 2019 Jul;25(7):1104-1109.
doi: 10.1038/s41591-019-0485-4. Epub 2019 Jun 24.

Meta-omics analysis of elite athletes identifies a performance-enhancing microbe that functions via lactate metabolism

Affiliations

Meta-omics analysis of elite athletes identifies a performance-enhancing microbe that functions via lactate metabolism

Jonathan Scheiman et al. Nat Med. 2019 Jul.

Abstract

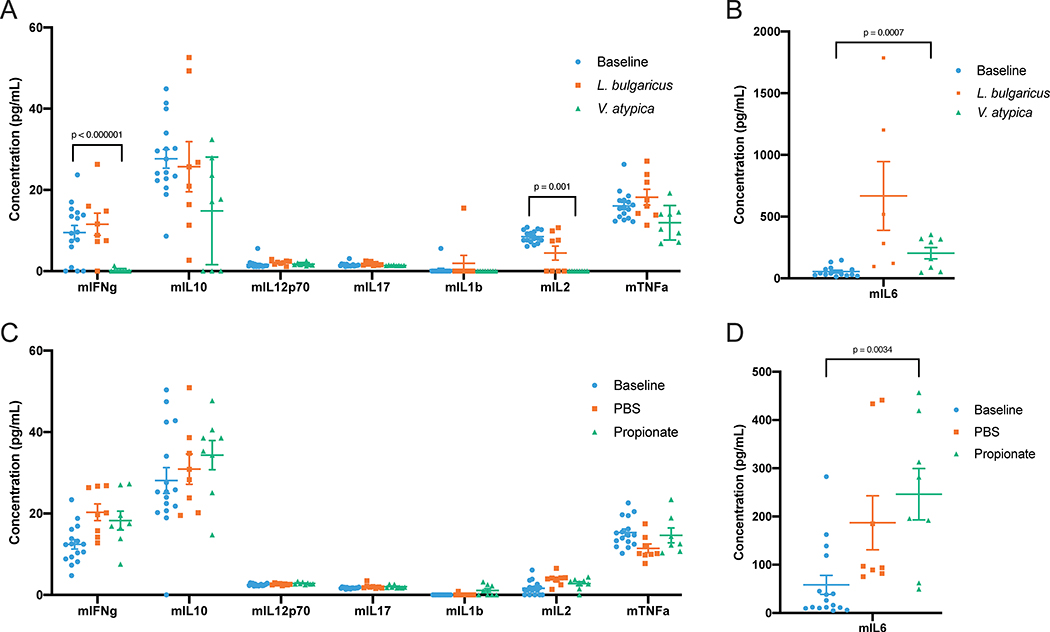
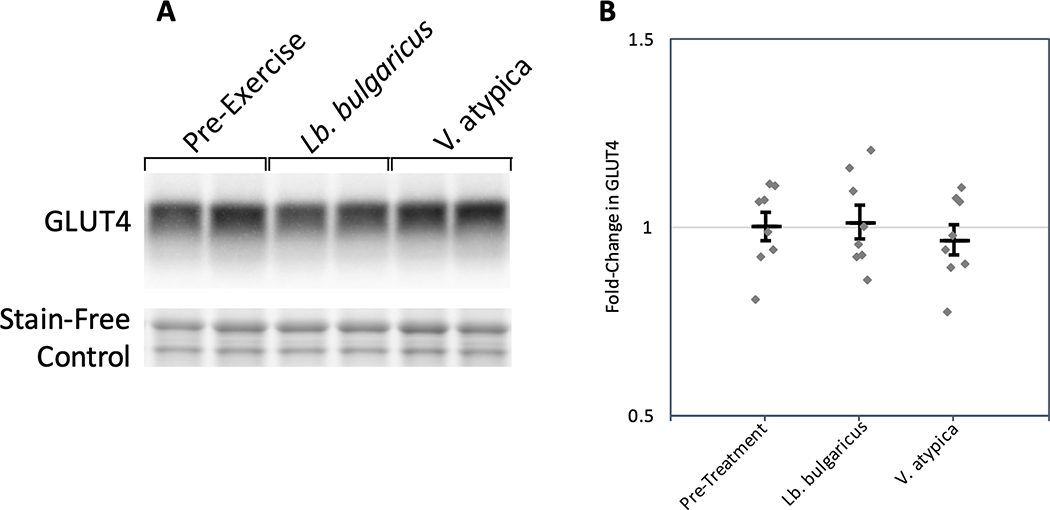
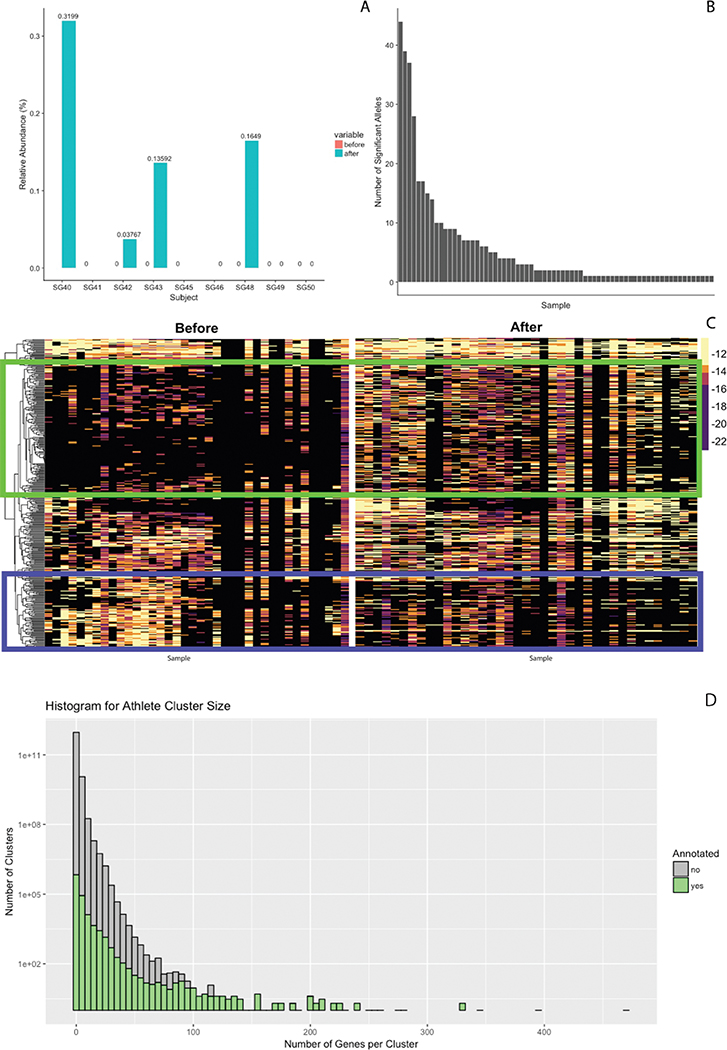
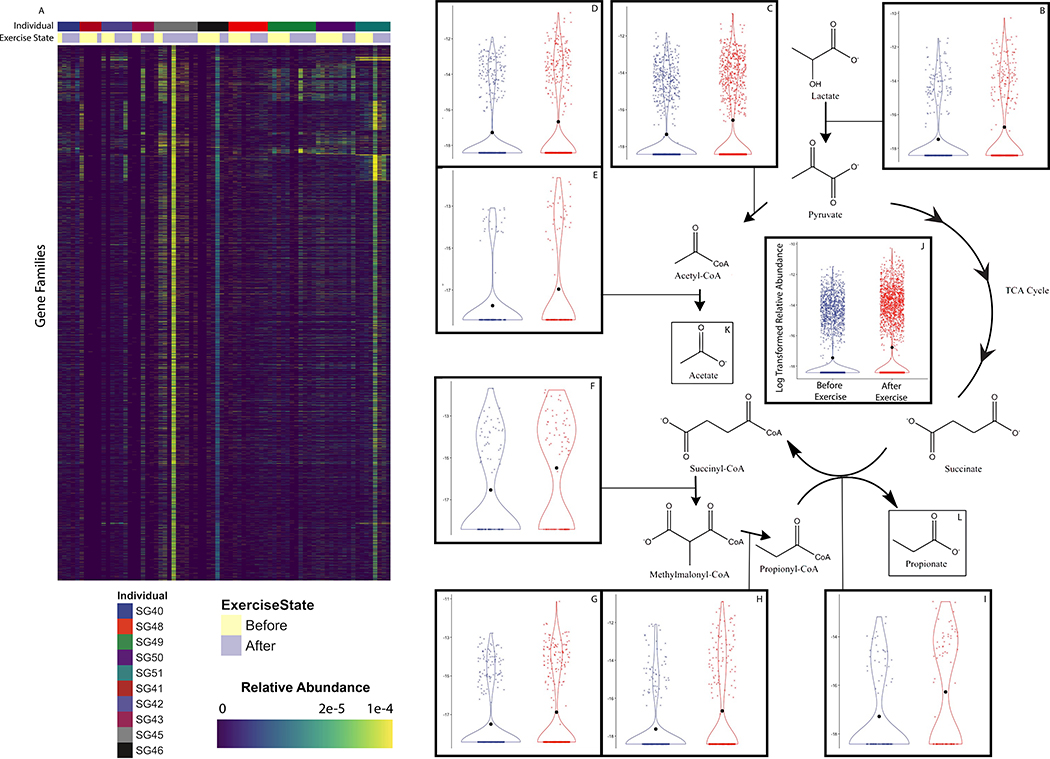
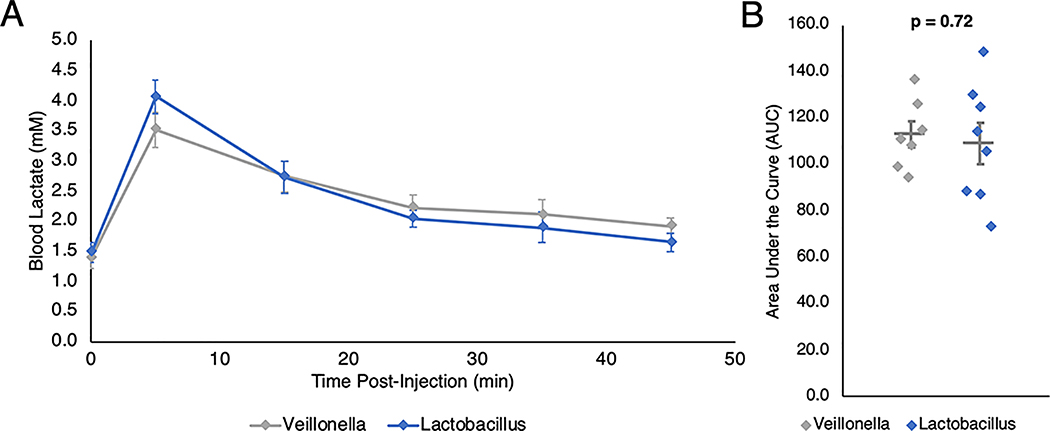
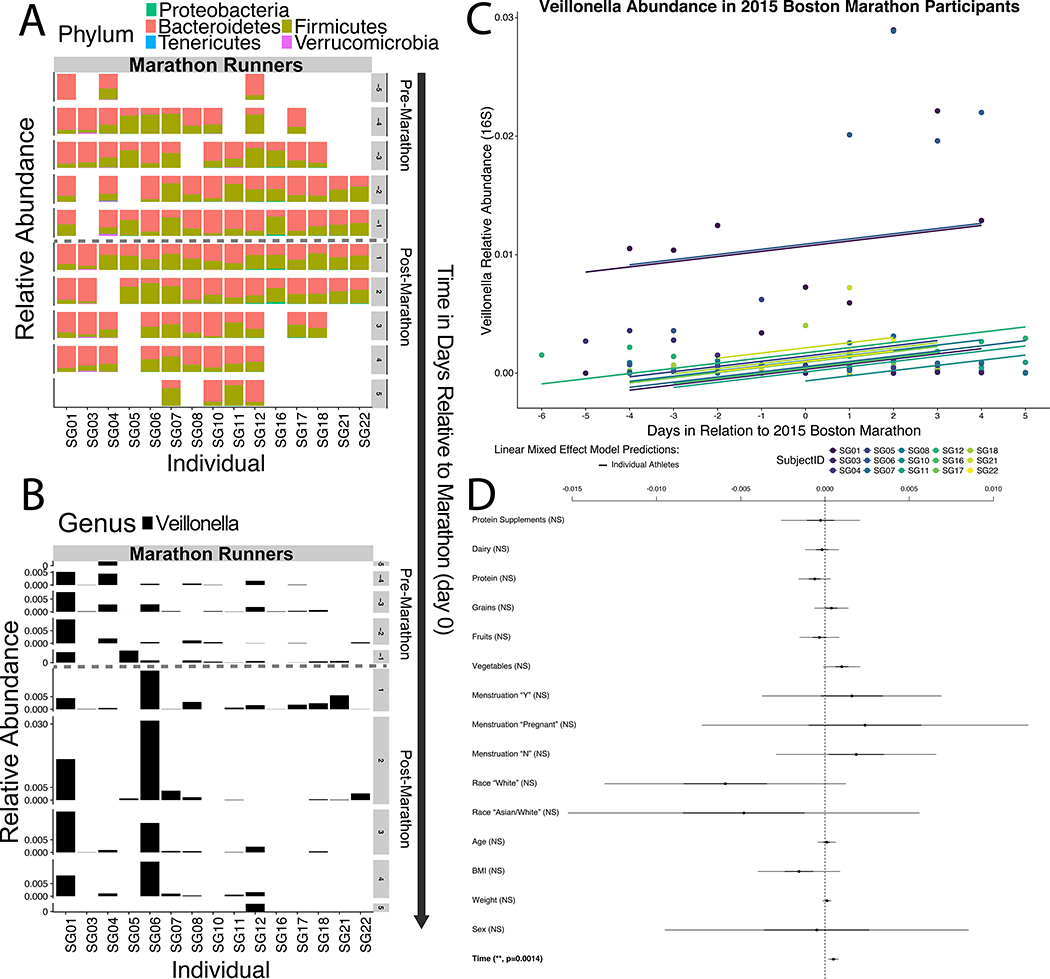
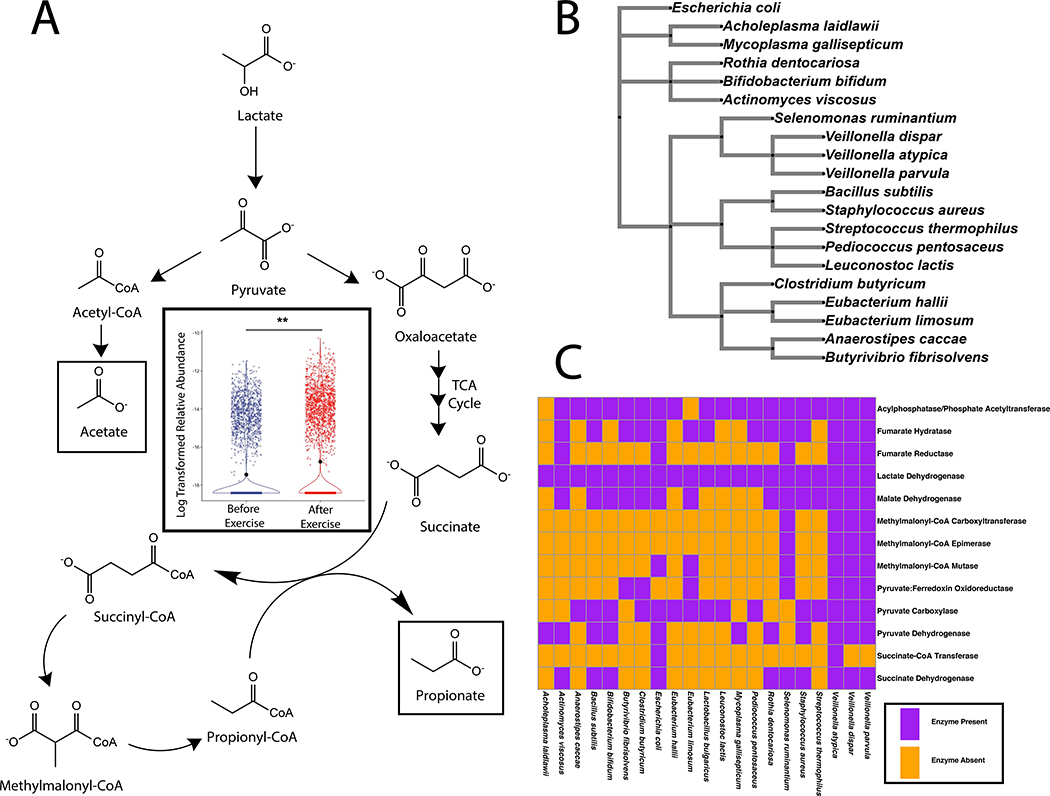
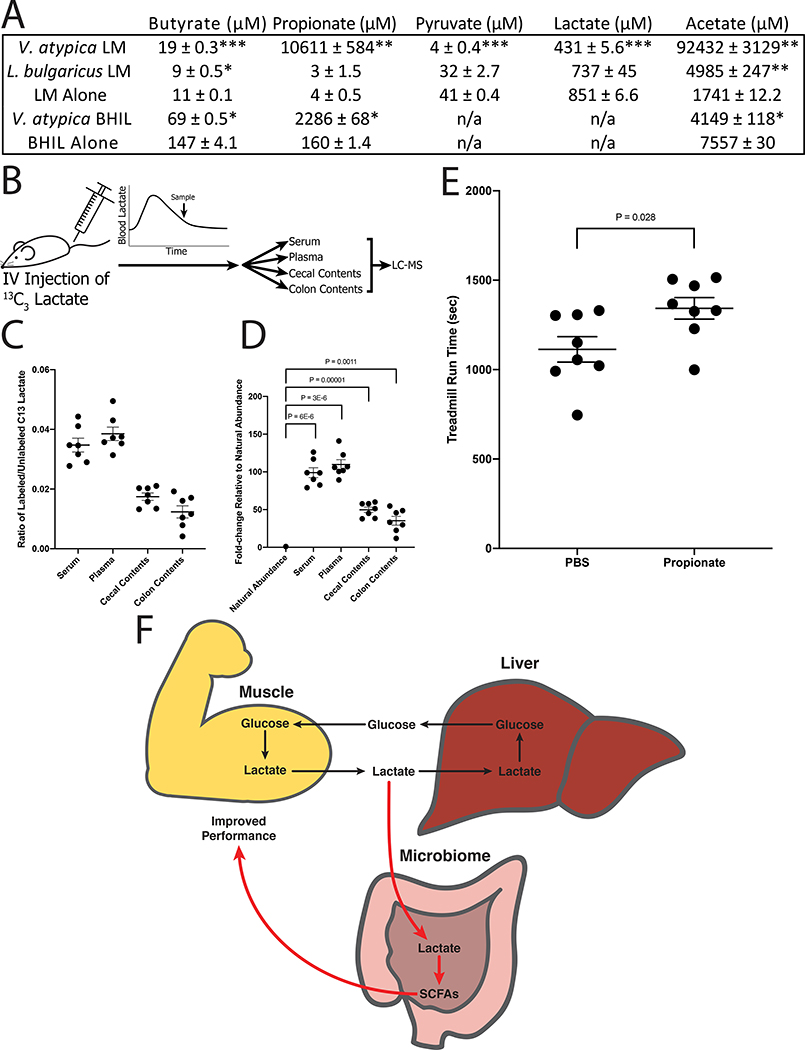
The human gut microbiome is linked to many states of human health and disease1. The metabolic repertoire of the gut microbiome is vast, but the health implications of these bacterial pathways are poorly understood. In this study, we identify a link between members of the genus Veillonella and exercise performance. We observed an increase in Veillonella relative abundance in marathon runners postmarathon and isolated a strain of Veillonella atypica from stool samples. Inoculation of this strain into mice significantly increased exhaustive treadmill run time. Veillonella utilize lactate as their sole carbon source, which prompted us to perform a shotgun metagenomic analysis in a cohort of elite athletes, finding that every gene in a major pathway metabolizing lactate to propionate is at higher relative abundance postexercise. Using 13C3-labeled lactate in mice, we demonstrate that serum lactate crosses the epithelial barrier into the lumen of the gut. We also show that intrarectal instillation of propionate is sufficient to reproduce the increased treadmill run time performance observed with V. atypica gavage. Taken together, these studies reveal that V. atypica improves run time via its metabolic conversion of exercise-induced lactate into propionate, thereby identifying a natural, microbiome-encoded enzymatic process that enhances athletic performance.


Conflict of interest statement

Competing Interests Statement

J.S. and G.M.C. are co-founders of FitBiomics, Inc. They and A.D.K. hold equity in FitBiomics, Inc.

Figures

Extended Data 1:
Extended Data 1:
A: Histogram of two-sided p-values (Wald-Z tests) for time coefficient from LOOCV models predicting 16S Veillonella abundance. Red line represents p value for model trained without any hold outs. B: Histogram of two-sided p-values for time coefficient from 1000 label permutations in GLMM models predicting Veillonella relative abundance. Red line represents p value for model trained without any label permutation.
Extended Data 2:
Extended Data 2:
A:16S composition in control subjects B:Veillonella relative abundance in control subjects.
Extended Data 3:
Extended Data 3:
A: Density plot of Max Run Times in AB/BA crossover study. Two-sided Shapiro-Wilk normality test on the max run times for each mouse in each treatment group results in p = 0.67 with a null hypothesis that the distribution of the data is normal (n = 64). B: 95% confidence intervals for coefficient effect on treadmill runtime in AB/BA crossover (Wald-Z tests, n=64). Center values are the regression estimate for each coefficient. Error bars represent the 95% confidence interval. C: Histogram of p-values for treatment coefficient from LOOCV models predicting treadmill runtime. Red line represents p value for model trained without any hold outs (Wald-Z tests, n=64). D: Histogram of p-values for treatment coefficient from 1000 label permutations in GLMM models predicting treadmill runtime. Red line represents p value for model trained without any label permutation (Wald-Z tests, n=64 per permutation).
Extended Data 4:
Extended Data 4:
AB/BA Crossover Study Results Segregated by Individual Mouse. Each of the 32 facets (each representing an individual mouse) has 6 longitudinal treadmill run times plotted (3 pre and 3 post treatment crossover). Shape of points represent treatment sequence. Each mouse facet has two horizontal lines showing mean runtime when dosed Lb. bulgaricus (light blue) and when dosed V. atypica (light red). Each facet has a GLMM fit to all data in a treatment sequence (green), a LOOCV GLMM fit trained on all mice except for the mouse the facet represents (red) and a GLMM fit showing change in intercept related to random effect for each mouse (blue).
Extended Data 5:
Extended Data 5:
Difference in Maximum Run Time between V. atypica gavage periods and L. Bulgaricus gavage treatment periods segregated into “responders” and “non-responders” to V. atypica treatment (n = 32).
Extended Data 6:
Extended Data 6:
A, B: Cytokines after V. atypica and L. bulgaricus gavage. Each mouse sample is represented as an individual point, with the central bar representing the mean and error bars representing s.e.m. (n = 64, 32, and 32, for baseline, L. bulgaricus, and V. atypica, respectively). C, D: Cytokines after intra-rectal propionate instillation. Each mouse sample is represented as an individual point, with the central bar representing the mean and error bars representing s.e.m. (n = 32, 16, and 16, for baseline, L. bulgaricus, and V. atypica, respectively). P values determined using one-way ANOVA followed by Tukey’s post-hoc test.
Extended Data 7:
Extended Data 7:
A: Representative section of western blot showing GLUT4 abundance in pre-exercise states as well as following Lb. bulgaricus and V. atypica gavage. Stain-free control used to normalize densitometry analysis shown. Experiment was performed once (n = 8). B: Fold-change in GLUT4 abundance. Each point represents an individual mouse sample, the center bar represents the mean, and error bars represent s.e.m. (n = 8).
Extended Data 8:
Extended Data 8:
A: Fraction of putative Veillonella relative abundance from metagenomics (calculated utilizing metaphlan2) before and after exercise in rowers and runners. B: Significant alleles (calculated from pairwise ANOVA) that are present in each of the 87 samples. C: Aforementioned 396 significant alleles are segregated by exercise state and sample. D: Histogram comparing non-redundant gene family size size and annotation fraction.
Extended Data 9:
Extended Data 9:
Enzyme-resolution log-transformed relative abundances of differentially abundant non-redundant gene families mapped by EC ID to Methylmalonyl-CoA pathway components. Panel A represents the pathway in aggregate and panels B-I represent individual reactions in the pathway (n=8). This data is represented as a violin plot, which displays the distribution of data as a rotated kernel density distribution.
Extended Data 10:
Extended Data 10:
Lactate clearance following IP injection in mice. A: Mice were gavaged either Veillonella atypica or Lactobacillus bulgaricus and 5 hours later injected with sodium lactate (750 mg/kg). Blood lactate was measured 5 minutes post-injection and every subsequent 10 minutes (n = 8). Points are means ± s.e.m. B: Area under the curve (AUC) was determined for each mouse and compared between treatments. Each mouse is represented as an individual point, with the central bar representing the mean and error bars representing s.e.m. (p = 0.72 using two-sided unpaired t-test, n = 8).
Figure 1:
Figure 1:. Gut Veillonella abundance is significantly associated with marathon running.
A: Phylum level relative abundance partitioned by individual and time (−5 to +5 days in relation to running the Marathon) shows few global differences in composition. B: Veillonella relative abundance at the Genus level partitioned by individual and time (−5 to +5 days in relation to running the Marathon) shows that Veillonella has a significant difference in relative abundance (P = 0.02; two-sided Wilcoxon rank sum test with continuity correction; n = 15 individuals) between samples collected before and after exercise. C: Generalized linear mixed effect models (GLMMs) predicting longitudinal Veillonella relative abundance in the marathon participants. Differences in intercept between fits for different marathoners represent random effects. D: 95% confidence intervals for all fixed effects (coefficients) included in the GLMMs. The Y-axis represents represents Veillonella relative abundance and the X-axis represents (time days in relation to running the Marathon). All coefficients except time (P = 0.0014, Wald Z-test, post-marathon time points correspond with increased Veillonella relative abundance) are not significant, suggesting that Veillonella blooms in runners correspond with exercise state and not other fixed effects (n = 15 individuals).
Figure 2:
Figure 2:. Veillonella atypica gavage improves treadmill runtime in mice.
A: Mice gavaged with Veillonella atypica have greater maximum run time per week than mice gavaged with Lactobacillus bulgaricus in an AB/BA crossover trial. Data shown are the maximum run time out of 3 days of consecutive treadmill running for a given treatment (all mice switched treatments second week). The jitter plot shows each mouse as an individual point, with the central bar representing the mean and error bars representing s.e.m. (n = 32). (*P = 0.02, using two-sided paired t-test). B: Generalized linear mixed effect models (GLMMs) predicting runtime in the 2 week AB/BA crossover trial. The Y-axis shows seconds run on treadmill until exhaustion and the X-axis shows days which the mice were run in the 2 week crossover. Color of lines (GLMM fits) and points (runs by an arbitrary mouse) represents treatment sequence; shape of points represents treatment at a given time point. These models incorporate both random effects (individual variation per mouse that manifests longitudinally) and fixed effects (treatment day, treatment sequence, and treatment given). Visualization of all longitudinal data points with the GLMM predictions overlayed show both the effect of Veillonella atypica increasing performance on both sides of the crossover when aggregated by treatment group (thick lines) as well as the trends for each of the 32 individual mice (thin lines). (*P=0.016, Wald-Z test on model coefficients).
Figure 3:
Figure 3:. The athlete gut microbiome is functionally enriched for the metabolism of lactate to propionate post-exercise.
A: methylmalonyl-CoA pathway and inset showing significant differentially expressed gene families pathway wide in a pair of non-redundant gene catalogs created from metagenomic sequencing of athlete stool samples. Log transformed relative abundance increases after exercise for every enzyme in the methylmalonyl-CoA pathway. (**P = 0.00147; two-sided Fisher’s exact test; n = 8, contingency table constructed for enzymes in pathway). Data represented as a violin plot, which displays the distribution of data as a rotated kernel density distribution. B: Bacterial phylogenetic tree showing diversity of microbes that have the ability to utilize Lactate as a carbon source. C: Prevalence of enzymes in the methylmalonyl-CoA pathway that breaks down lactate into acetate and propionate in reference genomes from this represent subset of lactate processing microbes.
Figure 4:
Figure 4:. Serum lactate crosses the epithelial barrier into the gut lumen and colorectal propionate instillation is sufficient to enhance treadmill runtime.
A: SCFAs detected in spent media after 48 hours of growth with the indicated strain. LM = semi-synthetic lactate media; BHIL = brain-heart infusion media supplemented with sodium lactate; n/a = not quantified. Each table entry shows the mean ± s.e.m. (BHIL, n = 2; LM, n = 3). (p values from left to right, top to bottom: .0008, .003, 4.4E-7, 1.4E-6, .001, .023, .006, .03, .02, .015; compared with media control using two-sided Welch’s t-test). B: Schematic of the 13C3 flux tracing experimental design. Mice were injected with 13C3 sodium lactate, then sacrificed after 12 minutes. Serum and plasma were collected via cardiac puncture. Cecum and colon contents were collected by dissection. C: Abundance of 13C3 lactate quantified relative to abundance of unlabeled lactate. Each mouse sample is represented as an individual point, with the central bar representing the mean and error bars representing s.e.m. (n = 7). D: 13C3 lactate abundance normalized to the expected natural abundance of 13C3 lactate. Ratio of labeled/unlabeled lactate was quantified for experimental samples as well as for unlabeled lactate standard. Experimental samples are represented as fold-change relative to unlabeled standard. Each mouse sample is represented as an individual point, with the central bar representing the mean and error bars representing s.e.m. (n = 7). (p values are from two-sided one sample t-test vs natural abundance). E: Intracolonic infusion of propionate improves maximum run time in mice. Data shown are the maximum run time out of 3 days of consecutive treadmill running. The jitter plot shows each mouse as an individual point, with the central bar representing the mean and error bars representing s.e.m. (n = 8). (p value from two-sided unpaired t-test). F: Proposed model of the microbiome-exercise interaction. Black arrows represent the well-known steps of the Cori cycle, where glucose is converted to lactate in the muscle, enters the liver via blood circulation, then is converted back to glucose in the liver via gluconeogenesis. Red arrows represent the steps proposed in this work. First, lactate produced in the muscle enters the intestinal lumen via blood circulation. In the intestine it acts as a carbon source for specific microbes, including Veillonella species. This causes the observed bloom in intestinal Veillonella, as well as production of SCFA byproducts (predominantly propionate), which are taken up by the host via the intestinal epithelium. Presence of microbiome-sourced SCFAs in the blood improves athletic performance via an unknown mechanism. Together, this creates an addendum to the Cori cycle by converting an exercise byproduct into a performance-enhancing molecule, mediated by naturally occurring members of the athlete gut microbiome.

Comment in

References

    1. Gilbert JA et al. Current understanding of the human microbiome. Nat. Med. 24, 392–400 (2018). - PMC - PubMed
    1. Lax S et al. Longitudinal analysis of microbial interaction between humans and the indoor environment. Science 345, 1048–1052 (2014). - PMC - PubMed
    1. Rothschild D et al. Environment dominates over host genetics in shaping human gut microbiota. Nature 555, 210–215 (2018). - PubMed
    1. Dusko Ehrlich S & The MetaHIT Consortium. MetaHIT: The European Union Project on Metagenomics of the Human Intestinal Tract in Metagenomics of the Human Body 307–316 (Springer, New York, NY, 2011). doi:10.1007/978-1-4419-7089-3_15 - DOI
    1. Petersen LM et al. Community characteristics of the gut microbiomes of competitive cyclists. Microbiome 5, 98 (2017). - PMC - PubMed

Methods-Only References

    1. Team, R. C. & Others. R: A language and environment for statistical computing. (2013).
    1. Wickham H & Chang W ggplot2: An Implementation of the Grammar of Graphics. 2015. URL http://CRAN.R-project.org/package=ggplot2. R package version 1, (2015).
    1. Wickham H & Francois R dplyr: A grammar of data manipulation. R package version 0. 4 3, (2015).
    1. Murrell P The grid graphics package. R News 2, 14–19 (2002).
    1. Wickham H reshape2: Flexibly reshape data: a reboot of the reshape package. R package version. 2012; 1.

Publication types