

Person-Fit as an Index of Inattentive Responding: A Comparison of Methods Using Polytomous Survey Data
- PMID: 31235983
- PMCID: PMC6572906
- DOI: 10.1177/0146621618798666
Person-Fit as an Index of Inattentive Responding: A Comparison of Methods Using Polytomous Survey Data
Abstract
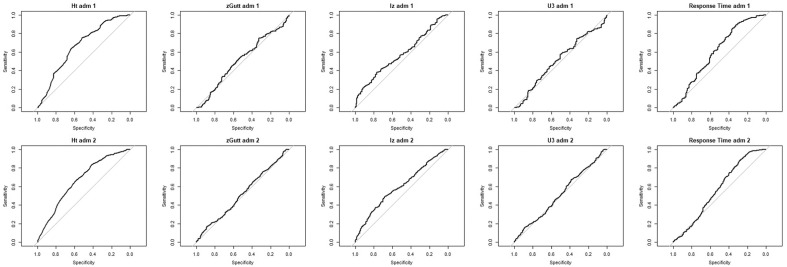
Self-report measures are vulnerable to response biases that can degrade the accuracy of conclusions drawn from results. In low-stakes measures, inattentive or careless responding can be especially problematic. A variety of a priori and post hoc methods exist for detecting these aberrant response patterns. Previous research indicates that nonparametric person-fit statistics tend to be the most accurate post hoc method for detecting inattentive responding on measures with dichotomous outcomes. This study investigated the accuracy and impact on model fit of parametric and nonparametric person-fit statistics in detecting inattentive responding with polytomous response scales. Receiver operating curve (ROC) analysis was used to determine the accuracy of each detection metric, and confirmatory factor analysis (CFA) fit indices were used to examine the impact of using person-fit statistics to identify inattentive respondents. ROC analysis showed the nonparametric H T statistic offered the most area under the curve when predicting a proxy for inattentive responding. The CFA fit indices showed the impact of using the person-fit statistics largely depends on the purpose (and cutoff) for using the person-fit statistics. Implications for using person-fit statistics to identify inattentive responders are discussed further.
Keywords: data quality; inattentive responding; nonparametric IRT; person-fit statistics; response biases.
Conflict of interest statement
Declaration of Conflicting Interests: The author(s) declared no potential conflicts of interest with respect to the research, authorship, and/or publication of this article.
Figures
References
-
- Armstrong R. D., Stoumbos Z. G., Kung M. T., Shi M. (2007). On the performance of the lz person-fit statistic. Practical Assessment, Research & Evaluation, 12(16), 1-15.
-
- Cheung G. W., Rensvold R. B. (2002). Evaluating goodness-of-fit indexes for testing measurement invariance. Structural Equation Modeling, 9, 233-255.
-
- Clark M., Skorupski W., Jirka S., McBride M., Wang C., Murphy S. (2014). An investigation into statistical methods to identify aberrant response patterns (Research report). Retrieved from https://www.pearson.com/content/dam/one-dot-com/one-dot-com/global/Files...
-
- Clark M. E., Gironda R. J., Young R. W. (2003). Detection of back random responding: Effectiveness of MMPI-2 and Personality Assessment Inventory validity indices. Psychological Assessment, 15, 223-234. - PubMed
-
- Credé M. (2010). Random responding as a threat to the validity of effect size estimates in correlational research. Educational and Psychological Measurement, 70, 596-612.