. 2019 Jun 7:17:100244.
doi: 10.1016/j.jbo.2019.100244. eCollection 2019 Aug.

The bone metastasis niche in breast cancer-potential overlap with the haematopoietic stem cell niche in vivo

Affiliations

The bone metastasis niche in breast cancer-potential overlap with the haematopoietic stem cell niche in vivo

Gloria Allocca et al. J Bone Oncol. .

Abstract

Background: Bone metastasis is one of the most common complications of advanced breast cancer. During dissemination to bone, breast cancer cells locate in a putative 'metastatic niche', a microenvironment that regulates the colonisation, maintenance of tumour cell dormancy and subsequent tumour growth. The precise location and composition of the bone metastatic niche is not clearly defined. We have used in vivo models of early breast cancer dissemination to provide novel evidence that demonstrates overlap between endosteal, perivascular, HSC and the metastatic niche in bone.

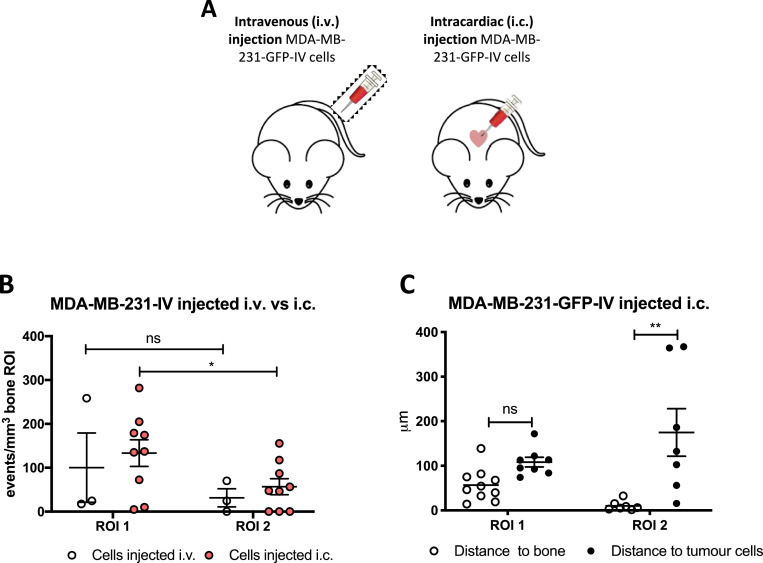
Methods: Estrogen Receptor (ER) +ve and -ve breast cancer cells were labelled with membrane dyes Vybrant-DiD and Vybrant-CM-DiI and injected via different routes in BALBc/nude mice of different ages. Two-photon microscopy was used to detect and quantitate tumour cells and map their location within the bone microenvironment as well as their distance to the nearest bone surface compared to the nearest other tumour cell. To investigate whether the metastatic niche overlapped with the HSC niche, animals were pre-treated with the CXCR4 antagonist AMD3100 to mobilise hematopoietic (HSCs) prior to injection of breast cancer cells.

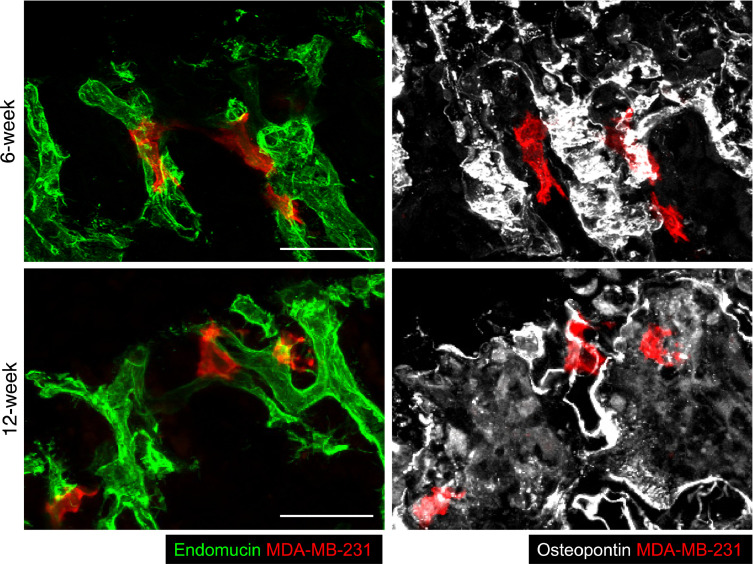
Results: Breast cancer cells displayed a characteristic pattern of homing in the long bones, with the majority of tumour cells seeded in the trabecular regions, regardless of the route of injection, cell-line characteristics (ER status) or animal age. Breast cancer cells located in close proximity to the nearest bone surface and the average distance between individual tumour cells was higher than their distance to bone. Mobilisation of HSCs from the niche to the circulation prior to injection of cell lines resulted in increased numbers of tumour cells disseminated in trabecular regions.

Conclusion: Our data provide evidence that homing of breast cancer cells is independent of their ER status and that the breast cancer bone metastasis niche is located within the trabecular region of bone, an area rich in osteoblasts and microvessels. The increased number of breast cancer cells homing to bone after mobilisation of HSCs suggests that the HSC and the bone metastasis niche overlap.

Keywords: ANOVA, Analysis of variance; Animal models; Bone metastasis; Breast cancer; CTC, Circulating tumour cell; DAPI, 4′,6-diamidino-2-phenylindole; DTC, Disseminated tumour cell; EDTA, Ethylenediaminetetraacetic acid; ER, Estrogen Receptor; FBS, Foetal bovine serum; GFP, Green fluorescent protein; HSC, Hematopoietic stem cell; Hematopoietic stem cell; IC, Intra cardiac; IV, Intra venous; Luc2, Luciferase2; OVX, Ovariectomy; ROI, Region of interest; TSP-1, thrombospondin-1; µCT, Microcomputed tomography.


Figures

Fig 1
Fig. 1
In vivo tumour model and location of the bone metastatic niche. (A) Representative image of the breast cancer bone metastasis animal model. Female BALB/c nude mice were injected i.c. MDA-MB-231-GFP cells transfected with luciferase, tumour growth was detected in the hind limbs using an in vivo imaging system (IVIS). (B) Representative micro-computed tomography reconstruction illustrating the trabecular architecture of the tibia. (C) Immunofluorescence staining using antibody against the endothelial marker endomucin to visualise the extensive microvascular network of long bones. (D) Immunofluorescence staining of a tumour bearing tibial section using an antibody specific for the endothelial cell marker endomucin. Dotted yellow line = tumour outline, BM = bone marrow, GP = growth plate, green = Endomucin and blue = DAPI, scale bar = 200um. (For interpretation of the references to color in this figure legend, the reader is referred to the web version of this article.)
Fig 2
Fig. 2
Homing of the bone-seeking MDA-MB-231-GFP-IV cell-line. (A) Experimental outline of the in vivo study. 12-week old female BALB/c nude mice were injected intravenously (i.v.) with PBS on day 0 followed by 1 × 105 MDA-MB-231-GFP-IV cells labelled with Vybrant-CM-DiI (n = 6) or Vybrant-DiI (n = 2) on day 7. Animals were culled on day 12 and tibiae and femora were collected for analysis by two-photon microscopy. (B) Schematic representation of the regions of interest (ROIs) of two-photon bone scan analysed: ROI1 consists of the trabecular bone region and ROI2 of the area of bone immediately adjacent to/including the growth plate. Cortical bone was excluded. (C) and (D) are examples of two-photon scan showing bone (white), Vybrant-CM-DiI+cells (blue and blue arrows in panel C) and Vybrant-DID+cells (red and red arrows in panel D). Scale bars 100 µm.(E) and (F) Show the number of Vybrant-CM-DiI+ events/mm3 (n = 11 bones analysed), Vybrant-DiD+(n = 3 bones analysed) events. **p ≤ 0.005 and ****p < 0.0001 student's t-test, graphs show mean ± SEM. (For interpretation of the references to color in this figure legend, the reader is referred to the web version of this article.)
Fig 3
Fig. 3
Location of MDA-MB-231-GFP-IV cells in the bone microenvironment. (A) Schematic illustration of the distances measured from the edge of the tumour cells to the nearest bone surface and (B) to the closest other cancer cell. Graphs show the distance of Vybrant-CM-DiI cells to the bone surface (C) and to other tumour cells (D) (n = 11 bones analysed). The comparison between the distances to the bone surface and to other tumour cells in ROI1 is shown in (E) and in ROI2 in (F). *p ≤ 0.05 and **p ≤ 0.01, student's t-test, graphs show mean ± SEM.
Fig 4
Fig. 4
Comparison between different routes of tumour cell injection. (A) Experimental outline of the in vivo study. 12-week old female BALB/c nude mice were injected either i.v. (n = 1) or i.c. with 1 × 105 MDA-MB-231-GFP-IV cells labelled with Vybrant-DiD (n = 5) to compare the pattern of homing using different routes of injection. (B) Graph representing the direct comparison between the homing of MDA-MB-231-GFP-IV cells after i.v and i.c injection. Comparison between the distance to the nearest bone surface and to the closest tumour cells after i.c. injection is show in (C). *p ≤ 0.05 and **p ≤ 0.01 student's t-test and two-way ANOVA and Tukey post-hoc test.
Fig 5
Fig. 5
Homing of ER+ve cell lines. (A) Experimental outline of the in vivo study. 12-week old female BALB/c nude mice were injected on day 1 with 1 × 105 T47D or MCF7 Vybrant-DiD labelled cells i.c. (n = 5/group) to compare the homing pattern of ER+ve cell-lines with the triple negative MDA-MB-231. Five days later, animals were culled and long bones collected for ex-vivo two-photon analysis. (B) Graph representing the direct comparison between the homing of T47D cells vs MCF7 cells (n = 5 bones/group analysed). (C) Comparison between the distances to the nearest bone surface of the two cell-lines injected. *p ≤ 0.05 two-way ANOVA and Tukey post-hoc test. Examples of two-photon scan showing the proximity to the bone surface of T47D (D) and MCF7 (E), position of the cells is highlighted by the yellow arrows and scale bar are 100 µm (right panel) and 50 µm (left panel). (For interpretation of the references to color in this figure legend, the reader is referred to the web version of this article.)
Fig 6
Fig. 6
Homing of MDA-MB-231-GFP-IV cells in young and mature mice. (A) Experimental outline of the in vivo study. 6- and 12-week old female BALB/c nude mice (n = 8/group) were injected on day 1 with 1 × 105 CM-DiI labelled MDA-MB-231-GFP-IV cells i.v. Five days later, animals were culled and long bones collected for ex-vivo two-photon analysis. (B) The number of MDA-MB-231-GFP-IV cells detected in 6- and 12-week old mice 5 days after tumour cell i.v. injection (n = 8/group), graph shows mean ± SEM. (C) Distances of the tumour cells to the nearest bone surface and to the closest breast cancer cells. Two-way ANOVA and Tukey's post-hoc test.
Fig 7
Fig. 7
Modification of the HSCs niche – effect on tumour cell homing. (A) Experimental outline of the in vivo study. 12-week old female BALB/c nude mice were injected daily for 5 days with PBS or AMD3100 (5 mg/kg i.p.) (n = 5/group). On day 5, animals were injected with 1 × 105 Vybrant-DiD labelled MDA-MB-231-GFP-IV cells i.v. and culled on day 10, tibias were collected for two-photon microscopy. (B) Ex vivo colony formation by HSC/PCs present in the peripheral blood of 12-week old female BALB/c-Nude mice treated daily for five days with AMD3100 (5 mg/Kg, i.p.) or saline. Graph shows HSC/PCs colony numbers after 11 days of culture ex vivo. (*p<0.05 Mann-Whitney U test; n = 4/group). (C) Graph representing the homing of MDA-MB-231-GFP-IV cells after treatment with the CXCR4 antagonist AMD3100 (n = 9 bones analysed) or with PBS (n = 10 bones analysed). Significantly greater number of tumour cells was detected in ROI1 after the mobilization of the HSCs cells outside the niche. *p ≤ 0.05 two-way ANOVA and Tukey's post-hoc test.
Fig 8
Fig. 8
Disseminated breast cancer cells reside in perivascular locations within mouse long bones. Immunofluorescent labelling of tibial cryosections from young and mature mice containing human MDA-MB-231 breast cancer cells with antibodies against the vascular marker Endomucin, the bone marker Osteopontin and two human antigens expressed by MDA-MB-231 cells. The samples were prepared 6 days after intra-cardiac injection of tumour cells (scale bar = 50 µm). (For interpretation of the references to color in this figure, the reader is referred to the web version of this article.)

References

    1. Eccles S.A., Aboagye E.O., Ali S., Anderson A.S., Armes J. Critical research gaps and translational priorities for the successful prevention and treatment of breast cancer. Breast Cancer Res. 2013;15(5):R92. - PMC - PubMed
    1. Waks A.G., Winer E.P. Breast cancer treatment: a review. JAMA. 2019;321(3):288–300. - PubMed
    1. Weilbaecher K.N., Guise T.A., McCauley L.K. Cancer to bone: a fatal attraction. Nat. Rev. Cancer. 2011;11(6):411–425. - PMC - PubMed
    1. Pan H., Gray R., Braybrooke J., Davies C., Taylor C., McGale P. 20-year risks of breast-cancer recurrence after stopping endocrine therapy at 5 years. N. Engl. J. Med. 2017;377(19):1836–1846. - PMC - PubMed
    1. Coleman R.E. Bone cancer in 2011: prevention and treatment of bone metastases. Nat. Rev. Clin. Oncol. 2011;9(2):76–78. - PubMed

LinkOut - more resources