. 2019 Oct;20(5):475-487.
doi: 10.1007/s10162-019-00717-3. Epub 2019 Jun 24.

Rapamycin Protects Spiral Ganglion Neurons from Gentamicin-Induced Degeneration In Vitro

Affiliations

Rapamycin Protects Spiral Ganglion Neurons from Gentamicin-Induced Degeneration In Vitro

Shasha Guo et al. J Assoc Res Otolaryngol. 2019 Oct.

Abstract

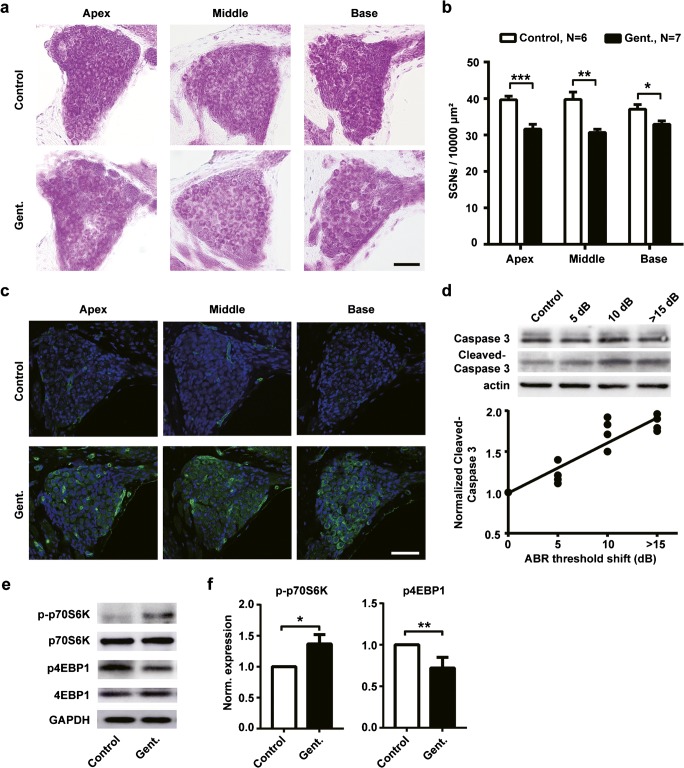
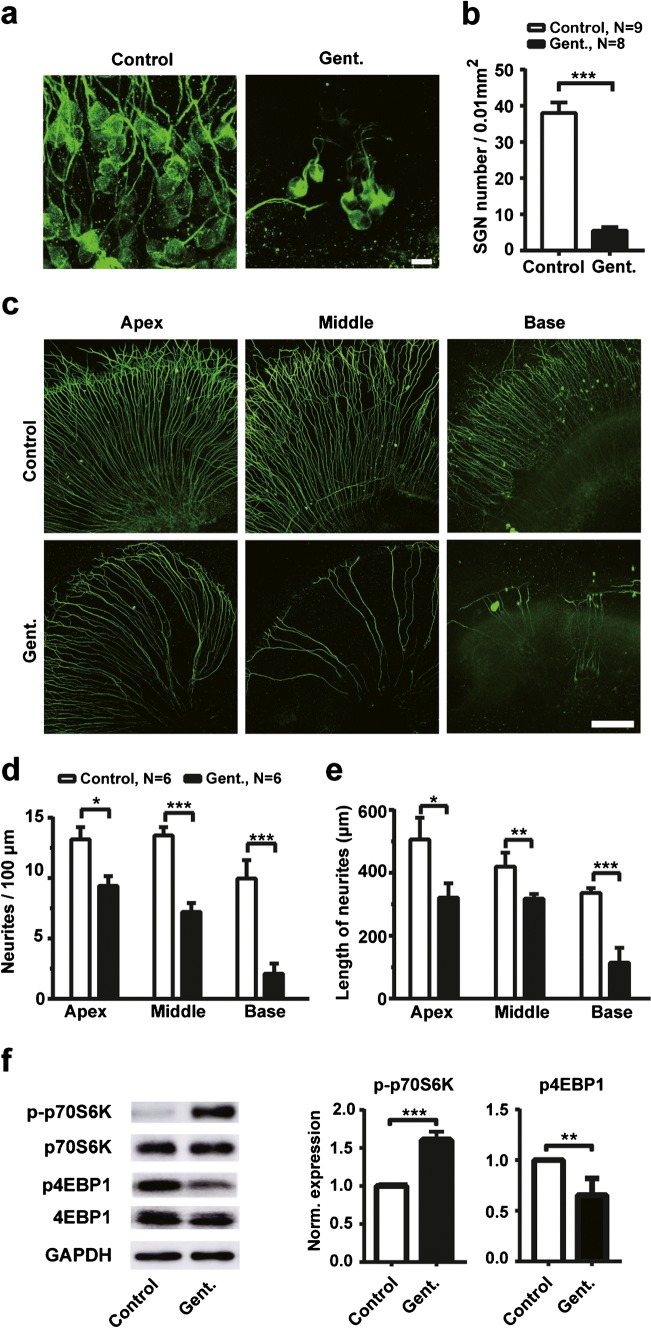
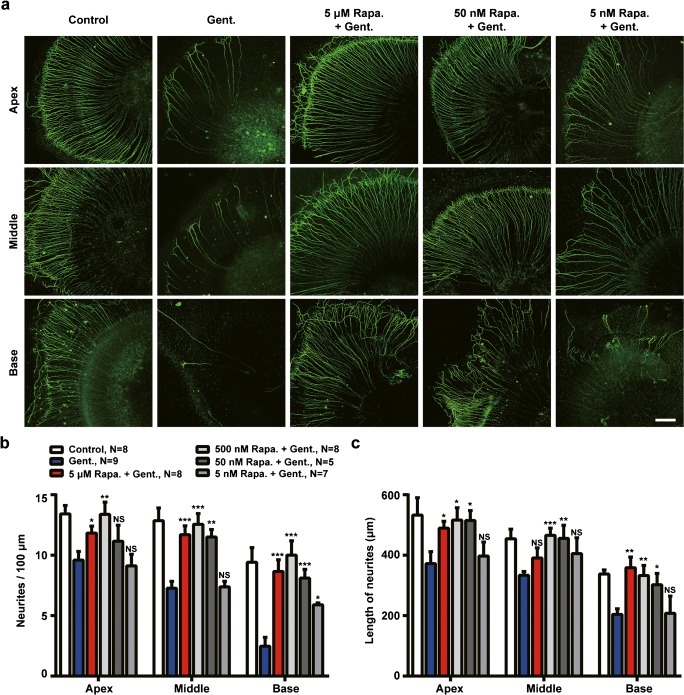
Gentamicin, one of the most widely used aminoglycoside antibiotics, is known to have toxic effects on the inner ear. Taken up by cochlear hair cells and spiral ganglion neurons (SGNs), gentamicin induces the accumulation of reactive oxygen species (ROS) and initiates apoptosis or programmed cell death, resulting in a permanent and irreversible hearing loss. Since the survival of SGNs is specially required for cochlear implant, new procedures that prevent SGN cell loss are crucial to the success of cochlear implantation. ROS modulates the activity of the mammalian target of rapamycin (mTOR) signaling pathway, which mediates apoptosis or autophagy in cells of different organs. However, whether mTOR signaling plays an essential role in the inner ear and whether it is involved in the ototoxic side effects of gentamicin remain unclear. In the present study, we found that gentamicin induced apoptosis and cell loss of SGNs in vivo and significantly decreased the density of SGN and outgrowth of neurites in cultured SGN explants. The phosphorylation levels of ribosomal S6 kinase and elongation factor 4E binding protein 1, two critical kinases in the mTOR complex 1 (mTORC1) signaling pathway, were modulated by gentamicin application in the cochlea. Meanwhile, rapamycin, a specific inhibitor of mTORC1, was co-applied with gentamicin to verify the role of mTOR signaling. We observed that the density of SGN and outgrowth of neurites were significantly increased by rapamycin treatment. Our finding suggests that mTORC1 is hyperactivated in the gentamicin-induced degeneration of SGNs, and rapamycin promoted SGN survival and outgrowth of neurites.

Keywords: gentamicin; inner ear; mammalian target of rapamycin; ototoxicity; spiral ganglion neurons.


Conflict of interest statement

The authors declare that they have no conflicts of interest.

Figures

Fig. 1
Fig. 1
Intraperitoneal injection of gentamicin elevates the ABR threshold. a Diagram of gentamicin administration. ABRs were examined before and after intraperitoneal injections with gentamicin once daily for 15 days. b The ABR threshold-frequency tuning curves obtained before and after 15 days of saline (left) or gentamicin (right) application. All data points are mean ± SD. n = 12 for saline group and n = 12 for gentamicin group
Fig. 2
Fig. 2
Intraperitoneal injection of gentamicin induces cell loss of spiral ganglion neurons (SGNs). a Nissl staining of SGNs in representative cochlear sections from different locations (apical, middle, and basal) from gentamicin and control animals. Scale bar = 50 μm. b The density of SGNs at different cochlear locations. Gentamicin application significantly decreased the density of SGNs (n = 7 for gentamicin group, n = 6 for control group). Data points are mean ± SEM. *, p < 0.05, **, p < 0.01, ***, p < 0.001. c Representative confocal microscope images show cleaved-caspase 3 expression was increased in SGNs after gentamicin administration. Cleaved-caspase 3 was labeled in green. The nuclei were labeled in blue. Scale bar = 50 μm. d Cleaved-caspase 3 expression correlates with the degree of gentamicin-induced hearing loss. Upper panel: immunobands of caspase 3 and cleaved-caspase 3 in control (saline) mice (n = 6) and gentamicin mice with 5 (n = 4), 10 (n = 4), and > 15 dB (n = 4) hearing loss. Lower panel: correlation analysis between hearing loss and expression of cleaved-caspase 3, R2 = 0.94, p = 0.03. The experiment was repeated 4 times for each group. e Immunobands of p70S6k and 4EBP1 of cochleae from gentamicin (Gent.) and control mice. f Normalized expression level of p- p70S6k (left) and p-4EBP1 (right). The experiment was repeated three times in each group. All data points present as the mean ± SD. Control, n = 6; Gent., n = 6. *, p < 0.05, **, p < 0.01
Fig. 3
Fig. 3
Gentamicin induces degeneration of SGNs in SGN explants. a Representative confocal images of SGNs under 50-μM gentamicin (Gent.) treatment and control conditions. The SGN soma was labeled with TUJ-1 (green). Scale bar = 10 μm. b The SGN soma densities under gentamicin and control conditions. c Representative confocal images of SGN neurites from different locations of the cochlea under 50-μM gentamicin (Gent.) and control conditions. The SGN neurites were labeled with TUJ-1 (green). Scale bar = 100 μm. d The density of neurites of cultured SGN explants from different turns of the cochlea (n = 6 for each column). e The length of neurites of cultured SGN explants under gentamicin and control conditions (n = 6 for each column). For b, d, and e, all data points are mean ± SEM. f Immunobands (left) and expression level (right two panels) of p- p70S6k and p-4EBP1 from gentamicin (Gent.) treated (n = 6) and control groups (n = 5). The experiment was repeated three times in each group. Data points are mean ± SD. *, p < 0.05; **, p < 0.01; ***, p < 0.001
Fig. 4
Fig. 4
Effects of rapamycin at different concentrations in SGN explants. a Representative confocal images of SGN explants from different locations of the cochlea under administration of DMSO (control) or 5 or 15-μM rapamycin. Scale bar = 100 μm. b The density of neurites of cultured SGN explants from different turns of the cochlea (n = 6 for each column). c The length of neurites of cultured SGN explants under rapamycin and control conditions (n = 6 for each column). For b and c, all data points are mean ± SEM. *, p < 0.05; **, p < 0.01, ***, p < 0.001; NS, no significance
Fig. 5
Fig. 5
The protective effect of rapamycin treatment. a Confocal images of TUJ-1 immunolabeled SGN soma (green) showing survival of SGNs in various concentrations of rapamycin treatment. Scale bar = 10 μm. b SGN soma densities in control, gentamicin only, and rapamycin-treated groups. The number in each column indicates the sample size. Data are presented as mean ± SEM. **, p < 0.01; ***, p < 0.001; NS, no significance, tested by the Student’s t test by comparing with corresponding gentamicin treated group
Fig. 6
Fig. 6
Rapamycin treatment protects SGN neurites against gentamicin-induced degeneration in SGN explants. a Representative confocal images of SGN explants from different locations of the cochlea under administration of DMSO (control) or 50-μM gentamicin (Gent.) in the absence and presence of rapamycin treatment at different concentrations. Scale bar = 100 μm. b The density of neurites of cultured SGN explants under gentamicin administration with/without rapamycin treatment. c The length of neurites of cultured SGN explants under gentamicin administration with/without rapamycin treatment. For b and c, all data points are mean ± SEM. *, p < 0.05; **, p < 0.01; ***, p < 0.001; NS, no significance, tested by the Student’s t test by comparing with corresponding gentamicin treated group

Similar articles

Cited by

References

    1. Al-Ali H, Ding Y, Slepak T, Wu W, Sun Y, Martinez Y, Xu XM, Lemmon VP, Bixby JL. The mTOR substrate S6 kinase 1 (S6K1) is a negative regulator of axon regeneration and a potential drug target for central nervous system injury. J Neurosci. 2017;37:7079–7095. doi: 10.1523/JNEUROSCI.0931-17.2017. - DOI - PMC - PubMed
    1. Bae WY, Kim LS, Hur DY, Jeong SW, Kim JR. Secondary apoptosis of spiral ganglion cells induced by aminoglycoside: Fas-Fas ligand signaling pathway. Laryngoscope. 2008;118:1659–1668. doi: 10.1097/MLG.0b013e31817c1303. - DOI - PubMed
    1. Bai X, Jiang Y. Key factors in mTOR regulation. Cell Mol Life Sci. 2010;67:239–253. doi: 10.1007/s00018-009-0163-7. - DOI - PMC - PubMed
    1. Chen Y, Zheng Y, Foster DA. Phospholipase D confers rapamycin resistance in human breast cancer cells. Oncogene. 2003;22:3937–3942. doi: 10.1038/sj.onc.1206565. - DOI - PubMed
    1. Chen Y, Rodrik V, Foster DA. Alternative phospholipase D/mTOR survival signal in human breast cancer cells. Oncogene. 2005;24:672–679. doi: 10.1038/sj.onc.1208099. - DOI - PubMed

Publication types

MeSH terms

Substances