. 2019 Aug 1;317(2):E362-E373.
doi: 10.1152/ajpendo.00396.2018. Epub 2019 Jun 25.

Excess membrane cholesterol is an early contributing reversible aspect of skeletal muscle insulin resistance in C57BL/6NJ mice fed a Western-style high-fat diet

Affiliations

Excess membrane cholesterol is an early contributing reversible aspect of skeletal muscle insulin resistance in C57BL/6NJ mice fed a Western-style high-fat diet

Brian A Grice et al. Am J Physiol Endocrinol Metab. .

Abstract

Skeletal muscle insulin resistance manifests shortly after high-fat feeding, yet mechanisms are not known. Here we set out to determine whether excess skeletal muscle membrane cholesterol and cytoskeletal derangement known to compromise glucose transporter (GLUT)4 regulation occurs early after high-fat feeding. We fed 6-wk-old male C57BL/6NJ mice either a low-fat (LF, 10% kcal) or a high-fat (HF, 45% kcal) diet for 1 wk. This HF feeding challenge was associated with an increase, albeit slight, in body mass, glucose intolerance, and hyperinsulinemia. Liver analyses did not reveal signs of hepatic insulin resistance; however, skeletal muscle immunoblots of triad-enriched regions containing transverse tubule membrane showed a marked loss of stimulated GLUT4 recruitment. An increase in cholesterol was also found in these fractions from HF-fed mice. These derangements were associated with a marked loss of cortical filamentous actin (F-actin) that is essential for GLUT4 regulation and known to be compromised by increases in membrane cholesterol. Both the withdrawal of the HF diet and two subcutaneous injections of the cholesterol-lowering agent methyl-β-cyclodextrin at 3 and 6 days during the 1-wk HF feeding intervention completely mitigated cholesterol accumulation, cortical F-actin loss, and GLUT4 dysregulation. Moreover, these beneficial membrane/cytoskeletal changes occurred concomitant with a full restoration of metabolic responses. These results identify skeletal muscle membrane cholesterol accumulation as an early, reversible, feature of insulin resistance and suggest cortical F-actin loss as an early derangement of skeletal muscle insulin resistance.

Keywords: GLUT4; actin; cholesterol; insulin resistance; skeletal muscle.


Conflict of interest statement

No conflicts of interest, financial or otherwise, are declared by the authors.

Figures

Fig. 1.
Fig. 1.
Dietary and treatment intervention plan. As described in materials and methods, upon arrival at our facility, 2 wk before the diet and treatment intervention (−2 wk), all mice were singly housed and given standard laboratory chow for 1 wk and then the low-fat diet (LF, open circles) for 1 wk to adapt to the modified diet. After this 2-wk acclimation period (0 wk), mice were either left on LF (groups 1, 3, and 5) or placed on a high-fat diet (HF, black circles; groups 2, 4, 6, and 7). After the 1-wk LF and HF diet interventions, mice in groups 3 and 4 were placed back on the LF diet for an additional week and denoted LF2 (gray circles) and RF (red circles), respectively. Mice in groups 5–7 were subcutaneously injected with saline (groups 5 and 6 denoted S) or 750 mg/kg methyl-β-cyclodextrin (group 7, denoted CD; blue symbols) at days 3 and 6 during the 1-wk LF or HF challenge. At 1 and 2 wk 3–12 animals per group were used for metabolic/tissue analyses.
Fig. 2.
Fig. 2.
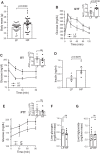
Glucose intolerance and hyperinsulinemia develop within 1-wk of high fat (HF) feeding. A: body mass measurements made for low fat (LF; ○)- and HF (●)-fed mice after the 1-wk diet intervention (n = 41). B, C, and E: blood glucose measured after an intraperitoneal injection of glucose (B; 2 g/kg, n = 6/group), insulin (C; 0.5 U/kg, n = 6/group), or pyruvate (E; 2 g/kg, n = 6/group). Insets in B, C, and E show the area under the curve (AUC) or area above the curve (AAC) calculated as described in materials and methods. GTT, glucose tolerance test; ITT, insulin tolerance test; PTT, pyruvate tolerance test. D: plasma insulin concentrations at 15 min after an intraperitoneal injection of glucose (2 g/kg, n = 5 or 6/group). F: liver glycogen content (n = 6/group). G: liver triglyceride content (n = 6/group). Data represent means ± SE. Difference between LF and HF groups was analyzed by unpaired, 2-tailed Student’s t-test. ns, Not significant.
Fig. 3.
Fig. 3.
Low-fat (LF) feeding of mice that were high-fat (HF) fed for 1 wk mitigates glucose intolerance and hyperinsulinemia. A: body mass measurements for mice fed a HF diet for 1 wk and then subsequently fed a LF diet for an additional week (RF; red circles, n = 12) and a LF diet control group that continued on the LF diet for an additional week (LF2; gray circles, n = 12). B and C: blood glucose measured after an intraperitoneal injection of glucose (B; 2 g/kg, n = 6/group) or insulin (C; 0.5 U/kg, n = 5/group). Insets in B and C show the area under the curve (AUC) or area above the curve (AAC) calculated as described in materials and methods. GTT, glucose tolerance test; ITT, insulin tolerance test. D: plasma insulin concentrations at 15 min after an intraperitoneal injection of glucose (2 g/kg, n = 9–12/group). Data represent means ± SE. Difference between LF2 and RF groups was analyzed by unpaired, 2-tailed Student’s t-test (A–C); difference between LF2, HF, and RF groups was analyzed by 1-way ANOVA and Tukey’s multiple-comparison tests (D). ns, Not significant.
Fig. 4.
Fig. 4.
Treatment of high-fat-fed mice with methyl-β-cyclodextrin (MβCD) during the 1-wk diet intervention prevented glucose intolerance and hyperinsulinemia. A: body mass measurements for saline-treated mice fed a low-fat (LF; open circles, n = 12) or high-fat (HF; black circles, n = 18) diet and MβCD-treated HF-fed mice (CD; blue circles, n = 18). B: blood glucose measured after an intraperitoneal injection of glucose (2 g/kg, n = 3–5/group). Inset in B shows the area under the curve (AUC) calculated as described in materials and methods. GTT, glucose tolerance test. C: plasma insulin concentrations at 15 min after an intraperitoneal injection of glucose (2 g/kg, n = 4–6/group). D: caloric intake (n = 6–10). RF, reverse fat group. Data represent means ± SE. Difference between LF, HF, RF, and CD groups was analyzed by 1-way ANOVA and Tukey’s multiple-comparison tests. ns, Not significant.
Fig. 5.
Fig. 5.
High-fat feeding for 1 wk increases triad-enriched membrane cholesterol that either diet reversal or methyl-β-cyclodextrin (MβCD) normalizes. A: triad-enriched membrane fraction cholesterol content in skeletal muscle from low-fat (LF; open circles, n = 5), high-fat (HF; black circles, n = 5), and reverse fat (RF; red circles, n = 4) mice. B: triad-enriched membrane fraction cholesterol content in skeletal muscle from saline-treated LF (open circles, n = 6) and HF (black circles, n = 6) and MβCD-treated HF-fed (HF+CD, blue circles, n = 4) mice. Data represent means ± SE. Difference between LF, HF, RF, and HF+CD groups was analyzed by 1-way ANOVA and Tukey’s multiple-comparison tests. ns, Not significant. C: representative Western immunoblots of the ryanodine receptor (RYR, top) and dihydropyridine receptor (DHPR, bottom) in triad-enriched membrane fractions (n = 3).
Fig. 6.
Fig. 6.
Glucose transporter (GLUT)4 translocation is impaired within 1 wk of high-fat feeding and is restored to normal with either diet reversal or methyl-β-cyclodextrin (MβCD). A and B: representative Western immunoblots (IB) of GLUT4 in skeletal muscle triad-enriched membrane fractions (A) and whole cell lysates (B). LF, low fat; HF, high fat; RF, reverse fat; CD, MβCD treatment. C and D: quantification from saline- or glucose-stimulated LF (open circles, n = 4/treatment group), HF (black circles, n = 4/treatment group), RF (red circles, n = 4/treatment group), and CD (blue circles, n = 4/treatment group) mice (C) and nontreated LF (open circles, n = 3/treatment group), HF (black circles, n = 3/treatment group), RF (red circles, n = 3/treatment group), and CD (blue circles, n = 3/treatment group) mice (D). au, Arbitrary units. Data represent means ± SE. Difference between LF, HF, RF, and CD groups was analyzed by 2-way ANOVA and Sidak’s multiple-comparison tests. ns, Not significant.
Fig. 7.
Fig. 7.
Disrupted cortical actin filaments in soleus and gastrocnemius muscle in mice fed a high-fat diet for 1 wk. A: 2 representative images of 1-mm sections of soleus muscle per group subjected to immunofluorescent labeling of F-actin. Note that before imaging all samples were deidentified to ensure an objective analysis. All images were taken in the same focal plane of the section and under identical microscopic parameters. B: immunofluorescence (IF) F-actin intensity/area for multiple (3–5) images captured in muscle sections per muscle per mouse (n = 3). au, Arbitrary units. C and D: average immunofluorescence F-actin soleus intensity/area per mouse (C; n = 3) and gastrocnemius intensity/area per mouse (D; n = 3). Data represent means ± SE. Difference between low fat (LF), high fat (HF), reverse fat (RF), and methyl-β-cyclodextrin (CD) groups was analyzed by 1-way ANOVA and Tukey’s multiple-comparison tests. ns, Not significant.
Fig. 8.
Fig. 8.
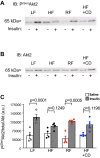
Insulin signaling to Akt2 is impaired by short-term high-fat feeding and is restored by diet reversal. A and B: representative Western immunoblot (IB) of P(Ser)Akt2 (A) and Akt2 (B) in skeletal muscle from saline (−)- and insulin (+)-treated low fat (LF), high fat (HF), reverse fat (RF), and methyl-β-cyclodextrin (CD) mice. C: quantification of P(Ser)Akt2/total Akt2 in skeletal muscle from for saline- and insulin-treated LF (open circles, n = 4/treatment group), HF (black circles, n = 4/treatment group), RF (red circles, n = 4/treatment group), and CD (blue circles, n = 4/treatment group) mice. au, Arbitrary units. Data represent means ± SE. Difference between LF, HF, RF, and CD groups was analyzed by 2-way ANOVA and Sidak’s multiple-comparison tests.

References

    1. Al-Qusairi L, Laporte J. T-tubule biogenesis and triad formation in skeletal muscle and implication in human diseases. Skelet Muscle 1: 26, 2011. doi:10.1186/2044-5040-1-26. - DOI - PMC - PubMed
    1. Ambery AG, Tackett L, Penque BA, Brozinick JT, Elmendorf JS. Exercise training prevents skeletal muscle plasma membrane cholesterol accumulation, cortical actin filament loss, and insulin resistance in C57BL/6J mice fed a western-style high-fat diet. Physiol Rep 5: e13363, 2017. doi:10.14814/phy2.13363. - DOI - PMC - PubMed
    1. Besseling J, Kastelein JJ, Defesche JC, Hutten BA, Hovingh GK. Association between familial hypercholesterolemia and prevalence of type 2 diabetes mellitus. JAMA 313: 1029–1036, 2015. doi:10.1001/jama.2015.1206. - DOI - PubMed
    1. Bhonagiri P, Pattar GR, Habegger KM, McCarthy AM, Tackett L, Elmendorf JS. Evidence coupling increased hexosamine biosynthesis pathway activity to membrane cholesterol toxicity and cortical filamentous actin derangement contributing to cellular insulin resistance. Endocrinology 152: 3373–3384, 2011. doi:10.1210/en.2011-1295. - DOI - PMC - PubMed
    1. Brozinick JT Jr, Hawkins ED, Strawbridge AB, Elmendorf JS. Disruption of cortical actin in skeletal muscle demonstrates an essential role of the cytoskeleton in glucose transporter 4 translocation in insulin-sensitive tissues. J Biol Chem 279: 40699–40706, 2004. doi:10.1074/jbc.M402697200. - DOI - PMC - PubMed

Publication types

MeSH terms