. 2019 Jun 25;5(14):e127197.
doi: 10.1172/jci.insight.127197.

NTCP deficiency in mice protects against obesity and hepatosteatosis

Affiliations

NTCP deficiency in mice protects against obesity and hepatosteatosis

Joanne M Donkers et al. JCI Insight. .

Abstract

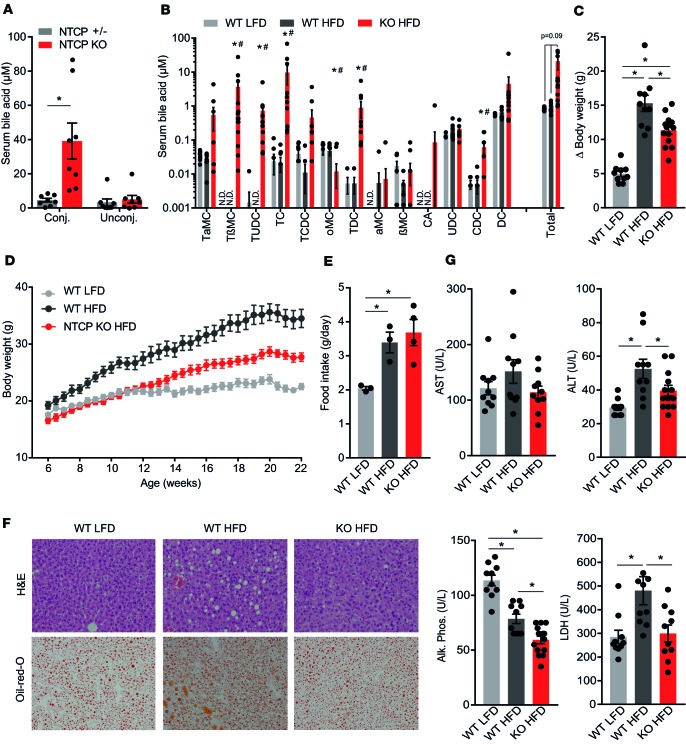
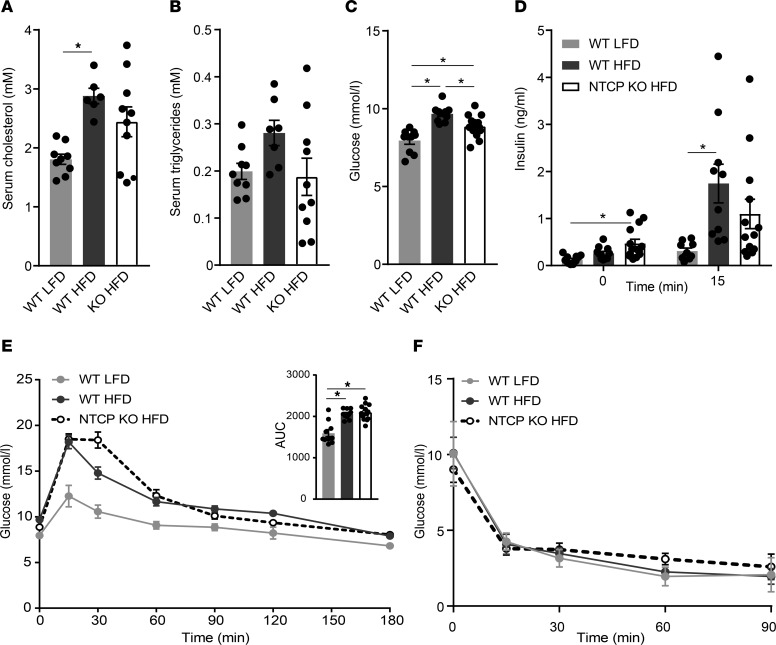
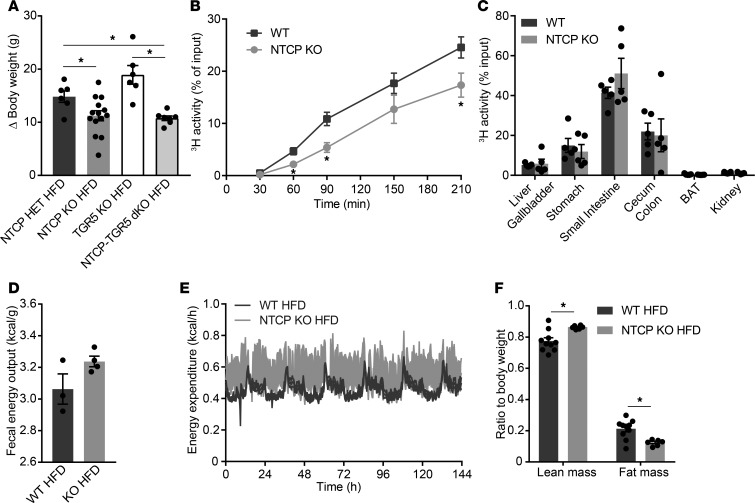
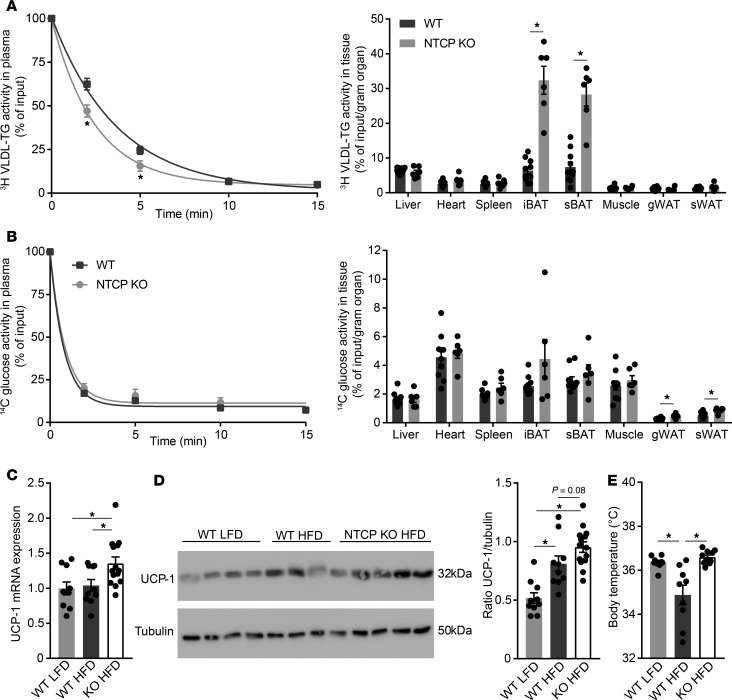
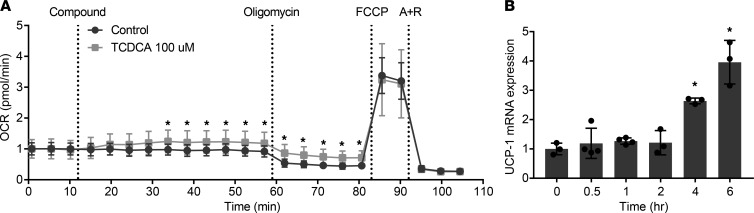
Bile acids play a major role in the regulation of lipid and energy metabolism. Here we propose the hepatic bile acid uptake transporter Na+ taurocholate co-transporting polypeptide (NTCP) as a target to prolong postprandial bile acid elevations in plasma. Reducing hepatic clearance of bile acids from plasma by genetic deletion of NTCP moderately increased plasma bile acid levels, reduced diet-induced obesity, attenuated hepatic steatosis, and lowered plasma cholesterol levels. NTCP-G protein-coupled bile acid receptor (TGR5) double knockout mice were equally protected against diet-induced-obesity as NTCP single knockout mice. NTCP knockout mice displayed decreased intestinal fat absorption and a trend towards higher fecal energy output. Furthermore, NTCP deficiency was associated with an increased uncoupled respiration in brown adipose tissue, leading to increased energy expenditure. We conclude that targeting NTCP-mediated bile acid uptake can be a novel approach to treat obesity and obesity-related hepatosteatosis by simultaneously dampening intestinal fat absorption and increasing energy expenditure.

Keywords: Hepatology; Metabolism; Obesity; Transport.


Conflict of interest statement

Conflict of interest: The authors have declared that no conflict of interest exists.

Figures

Figure 1
Figure 1. NTCP-KO mice have attenuated body weight gain and reduced (hepatic) adiposity when fed a high-fat diet.
(A) Conjugated and unconjugated plasma bile acid levels, measured by high-performance liquid chromatography (HPLC), of nonfasted, chow-fed NTCP-expressing (+/–) and NTCP-KO mice (n = 8). conj., conjugated; unconj., unconjugated. (BG) Female wild-type (WT, n = 10) or NTCP-KO (n = 13) mice were fed a low-fat diet (LFD) or high-fat diet (HFD) for 16 weeks. (B) Concentration of the individual conjugated and unconjugated bile acid species in plasma. Plasma was collected after a 4-hour fast, and bile acid concentration and species were measured by HPLC. N.D., not determined. Asterisk indicates significant changes of both HFD groups compared with the WT LFD group; hash tag indicates a significant change between NTCP-KO HFD and WT HFD mice. (C) Body weight change (Δ) and (D) body weight accumulation between the start and end of the experiment. (E) Food intake g/day per animal. Food intake per cage was weekly measured, divided over the number of animals per cage, and averaged for the 16-week period. n = 3 or 4 cages per group, each with 3 or 4 animals per cage. (F) Hepatic triglyceride content by representative images of liver histology by H&E (top) and Oil Red O (ORO, bottom) staining. Digital images were taken by using a ×10 eyepiece and a ×20 objective. (G) Plasma biochemistry displaying levels of aspartate aminotransferase (AST), alanine aminotransferase (ALT), alkaline phosphatase (Alk. Phos.), and lactate dehydrogenase (LDH). All data are represented as mean ± SEM; each dot represents an individual animal (AD and G) or cage (E). *P < 0.05, calculated with 2-way ANOVA (Holm-Šídák’s) (A) or 1-way ANOVA (Tukey’s) (BE and G).
Figure 2
Figure 2. Improved key blood parameters but not glucose tolerance of NTCP-KO mice on HFD.
Female WT (n = 10) or NTCP-KO (n = 13) mice were fed an LFD or HFD for 16 weeks. Animals were fasted for 4–5 hours before obtaining blood samples or performing glucose or insulin tolerance testing. (A and B) Plasma biochemistry displaying levels of triglycerides (A) and cholesterol (B). Plasma was analyzed by fast protein liquid chromatography (FPLC). (CF) Fasting blood glucose (C) and plasma insulin levels (D) during an oral glucose tolerance test (OGTT, 2 g/kg glucose) (E) and an insulin tolerance test (1.2 mU/kg) (F). Glucose levels were determined in whole blood using a glucometer; plasma insulin was measured by ELISA. All data are represented as mean ± SEM; each dot represents an individual animal (AE). *P < 0.05; 1-way ANOVA (Tukey’s) (AE).
Figure 3
Figure 3. Enhanced bile acid signaling modulates intestinal fat absorption and increases energy expenditure.
(A) Body weight change (Δ) of adult female control (NTCP-heterozygous), NTCP-KO, TGR5-KO, and NTCP-TGR5–double KO (NTCP-TGR5–dKO) mice after a 15-week HFD (n = 6–14 per group). (B and C) WT and NTCP-KO mice (n = 5 per group) were fasted 4 to 5 hours, after which they received an i.p. injection with Poloxamer 407 (1 mg/kg) to inhibit lipoprotein lipase. At t = 0, mice were orally gavaged with olive oil containing tracer. Amounts of [3H]triolein and 3H activity in whole blood (B) and organs (C) were determined by liquid scintillation counting. Blood volume was estimated as 4.706% of total body weight. BAT, brown adipose tissue. (D) Per cage, 24-hour feces were collected from HFD-fed WT and NTCP-KO mice (n = 3–4 cages per group, 3–4 animals per cage), and remaining fecal calories were assessed by bomb calorimetry. (E and F) WT (n = 10) and NTCP-KO (n = 6) mice fed a HFD for 3 weeks were individually housed in fully automated calorimetric cages. Energy expenditure was calculated from O2 consumption and the resting energy requirement (E), and lean and fat mass were assessed by NMR (F). Error bars show ± SEM; each dot represents an individual animal. *P < 0.05, calculated by 1-way ANOVA (A) or Student’s t test (B and F).
Figure 4
Figure 4. Prolonged bile acid signaling stimulates BAT uncoupled respiration.
(A and B) 3-week HFD-fed WT (n = 10) and NTCP-KO mice (n = 6) were fasted 4 to 5 hours and subsequently i.v. injected with radiolabeled [14C]deoxyglucose and [3H]triolein-labeled VLDL-like particles. Plasma clearance and uptake by organs at 15 minutes after injection were determined by assessing 3H and 14C activity by liquid scintillation counting. Blood volume was estimated as 4.706% of total body weight. iBAT, interscapular brown adipose tissue; sBAT, supraclavicular brown adipose tissue; gWAT, gonadal white adipose tissue. (C and D) Uncoupling protein 1 (Ucp1) mRNA (C) and UCP1 protein (D) expression levels, determined by reverse transcription quantitative PCR (RT-qPCR) and Western blotting, respectively, in BAT of WT and NTCP-KO mice fed an LFD or HFD for 16 weeks (n = 10–13). RT-qPCR samples are relative to the geometric mean of control genes 36b4 and Hprt and were normalized to WT LFD. The Western blot shown in D is representative of all mice, and for each mouse the relative UCP1 (32 kDa) to tubulin (50 kDa) protein expression was determined. (E) Body temperature, measured by temperature transponders, of the mice in C and D. Per animal, average body temperature was calculated from 10 individual observations. Error bars show ± SEM; each dot represents an individual animal. *P < 0.05, calculated by Student’s t test (A and B) or 1-way ANOVA (CE).
Figure 5
Figure 5. Prolonged bile acid signaling increases uncoupled respiration in SGBS cells.
(A) Oxygen consumption rate (OCR) in SGBS cells measured by the XFe 96 extracellular flux analyzer. Cells were stimulated with the bile acid taurochenodeoxycholic acid (TCDCA) or vehicle (control) after the first 3 measurements. Subsequently, activators and inhibitors of the mitochondrial respiratory chain were applied at the indicated time points. FCCP, carbonyl cyanide-4-(trifluoromethoxy)phenylhydrazone; A + R, antimycin A + rotenone. Data are represented as OCR normalized to basal respiration (average of 3 cycles). n = 14, representative results of triplicate experiments. (B) UCP1 mRNA expression level in SGBS cells treated with bile acid TCDCA. Samples are relative to the geometric mean of β-actin and HPRT and subsequently normalized to the expression at time point 0 (representative results of triplicate experiments, n = 3–4 wells/group). Error bars show mean ± SD; each dot represents an individual sample. Student’s t test (A) or 1-way ANOVA using Dunnett’s multiple-comparisons test (B) was used to calculate significance; *P < 0.05.

References

    1. Kuipers F, Bloks VW, Groen AK. Beyond intestinal soap — bile acids in metabolic control. Nat Rev Endocrinol. 2014;10(8):488–498. doi: 10.1038/nrendo.2014.60. - DOI - PubMed
    1. Vítek L, Haluzík M. The role of bile acids in metabolic regulation. J Endocrinol. 2016;228(3):R85–R96. doi: 10.1530/JOE-15-0469. - DOI - PubMed
    1. Thomas C, Pellicciari R, Pruzanski M, Auwerx J, Schoonjans K. Targeting bile-acid signalling for metabolic diseases. Nat Rev Drug Discov. 2008;7(8):678–693. doi: 10.1038/nrd2619. - DOI - PubMed
    1. Watanabe M, et al. Bile acids induce energy expenditure by promoting intracellular thyroid hormone activation. Nature. 2006;439(7075):484–489. doi: 10.1038/nature04330. - DOI - PubMed
    1. Thomas C, Auwerx J, Schoonjans K. Bile acids and the membrane bile acid receptor TGR5 — connecting nutrition and metabolism. Thyroid. 2008;18(2):167–174. doi: 10.1089/thy.2007.0255. - DOI - PubMed

Publication types

MeSH terms