

Are there differences in HIV retention in care between female and male patients in Indonesia? A multi-state analysis of a retrospective cohort study
- PMID: 31237899
- PMCID: PMC6592601
- DOI: 10.1371/journal.pone.0218781
Are there differences in HIV retention in care between female and male patients in Indonesia? A multi-state analysis of a retrospective cohort study
Abstract
Background: Little is known about HIV treatment outcomes in Indonesia, which has one of the most rapidly growing HIV epidemics worldwide.
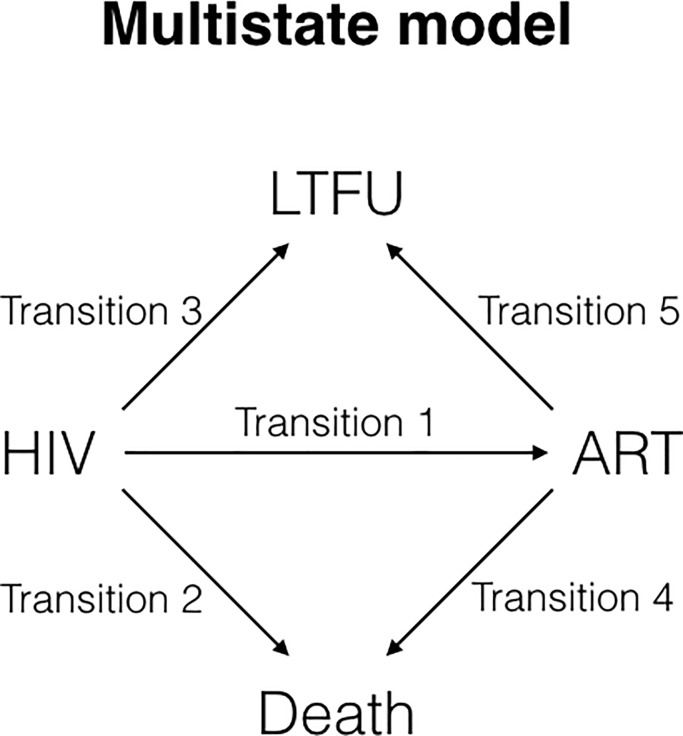
Methods: We examined possible differences in loss to follow-up (LTFU) and survival between HIV-infected females and males over a 7-year period in an HIV clinic in Bandung, West Java. Data imputation was performed on missing covariates and a multi-state Cox regression was used to investigate the effects of sex and other covariates on patient transitions among four states: (1) clinic enrollment with HIV, (2) initiation/continuation/re-initiation of antiretroviral therapy (ART), (3) LTFU, and (4) death.
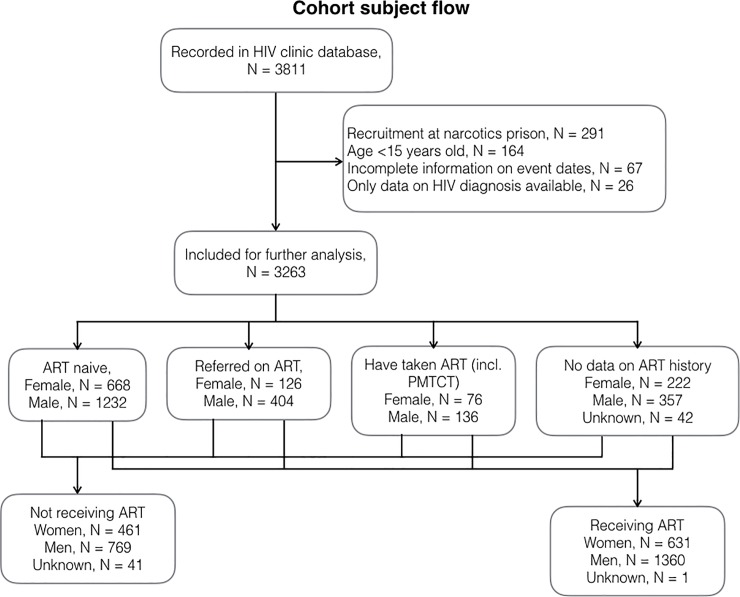
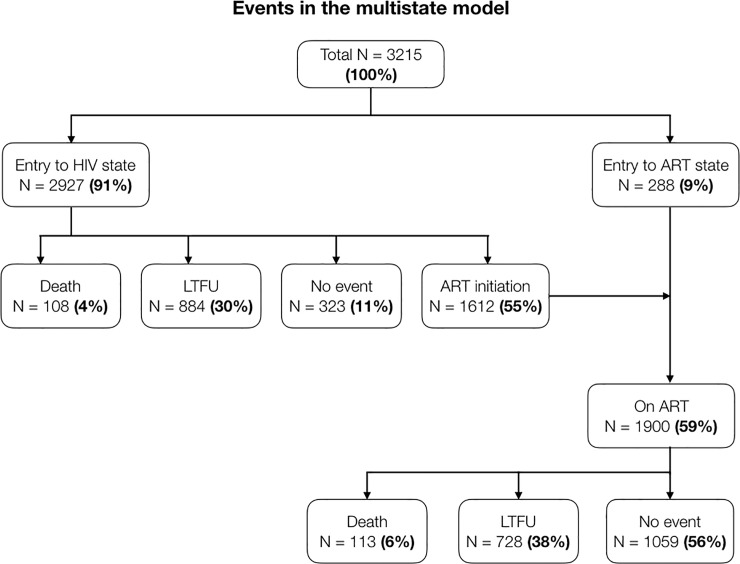
Results: We followed 3215 patients (33% females), for a total of 8430 person-years. ART was used by 59% of patients at some point. One-year retention was 73% for females and 77% for males (p = 0.06). One-year survival was 98% for both females and males (p = 0.15). Females experienced a higher relative hazard to transition from HIV to LTFU (adjusted hazard ratio 1.21; 95% confidence interval 1.00-1.45), but this decreased after adjustments for clinical variables (aHR 0.94; 95% CI 0.79-1.11). Similarly, a lower relative hazard in females to transition from ART to death (aHR 0.59; 95% CI 0.35-0.99) decreased after adjustments for demographic variables.
Conclusion: This Indonesian cohort has low ART uptake and poor overall pre- and post-ART retention. Female-male differences in survival and retention were gone after adjusting for clinical and sociodemographic factors such as CD4 count and education level. Efforts should be made to improve retention among patients with lower education.
Conflict of interest statement
The authors have declared that no competing interests exist.
Figures
Similar articles
-
Same-day antiretroviral therapy is associated with increased loss to follow-up in South African public health facilities: a prospective cohort study of patients diagnosed with HIV.J Int AIDS Soc. 2020 Jun;23(6):e25529. doi: 10.1002/jia2.25529. J Int AIDS Soc. 2020. PMID: 32510186 Free PMC article.
-
High rates of loss to follow-up during the first year of pre-antiretroviral therapy for HIV patients at sites providing pre-ART care in Nigeria, 2004-2012.PLoS One. 2017 Sep 1;12(9):e0183823. doi: 10.1371/journal.pone.0183823. eCollection 2017. PLoS One. 2017. PMID: 28863160 Free PMC article.
-
Determinants of loss to follow-up among HIV positive patients receiving antiretroviral therapy in a test and treat setting: A retrospective cohort study in Masaka, Uganda.PLoS One. 2020 Apr 7;15(4):e0217606. doi: 10.1371/journal.pone.0217606. eCollection 2020. PLoS One. 2020. PMID: 32255796 Free PMC article.
-
Attrition of HIV-positive children from HIV services in low and middle-income countries.AIDS. 2019 Dec 1;33(15):2375-2386. doi: 10.1097/QAD.0000000000002366. AIDS. 2019. PMID: 31764102 Free PMC article.
-
Retention in Care After Transition to Adult Care for Adolescents and Young Adults With HIV: A Systematic Review and Meta-Analysis.Int J Public Health. 2025 Mar 24;70:1607733. doi: 10.3389/ijph.2025.1607733. eCollection 2025. Int J Public Health. 2025. PMID: 40196728 Free PMC article.
Cited by
-
Retention in HIV care among Southeast Asian people living with HIV: A systematic review and meta-analysis.Belitung Nurs J. 2025 May 27;11(3):264-277. doi: 10.33546/bnj.3719. eCollection 2025. Belitung Nurs J. 2025. PMID: 40438660 Free PMC article. Review.
-
How Home Delivery of Antiretroviral Drugs Ensured Uninterrupted HIV Treatment During COVID-19: Experiences From Indonesia, Laos, Nepal, and Nigeria.Glob Health Sci Pract. 2021 Dec 21;9(4):978-989. doi: 10.9745/GHSP-D-21-00168. Print 2021 Dec 31. Glob Health Sci Pract. 2021. PMID: 34933991 Free PMC article.
-
Progress Toward the Elimination of Vertical HIV Transmission in Nepal: A Retrospective Cohort Study.J Community Health. 2025 Jul 1. doi: 10.1007/s10900-025-01474-6. Online ahead of print. J Community Health. 2025. PMID: 40593364
-
Statistical methods applied for the assessment of the HIV cascade and continuum of care: a systematic scoping review.BMJ Open. 2023 Nov 23;13(11):e071392. doi: 10.1136/bmjopen-2022-071392. BMJ Open. 2023. PMID: 37996221 Free PMC article.
-
Novel Longitudinal Methods for Assessing Retention in Care: a Synthetic Review.Curr HIV/AIDS Rep. 2021 Aug;18(4):299-308. doi: 10.1007/s11904-021-00561-2. Epub 2021 May 4. Curr HIV/AIDS Rep. 2021. PMID: 33948789 Review.
References
-
- UNAIDS. AIDS by the numbers. 2016.
-
- Indonesia D and ICM of H. HIV AIDS situation and analysis. South Jakarta; 2014.
-
- Sia D, Onadja Y, Hajizadeh M, Heymann SJ, Brewer TF, Nandi A. What explains gender inequalities in HIV/AIDS prevalence in sub-Saharan Africa? Evidence from the demographic and health surveys. BMC Public Health [Internet]. BMC Public Health; 2016;16(1):1136 Available from: http://www.ncbi.nlm.nih.gov/pubmed/27809824%5Cnhttp://www.pubmedcentral.... - PMC - PubMed
-
- Wisaksana R, Alisjahbana B, van Crevel R, Kesumah N, Sudjana P, Sumantri R. Challenges in delivering HIV-care in Indonesia: experience from a referral hospital. Acta Med Indones [Internet]. 2009. July;41 Suppl 1:45–51. Available from: http://www.ncbi.nlm.nih.gov/pubmed/19920298 - PubMed
Publication types
MeSH terms
Substances
LinkOut - more resources
Full Text Sources
Medical
Research Materials
