. 2019 Jun 25;14(6):e0218531.
doi: 10.1371/journal.pone.0218531. eCollection 2019.

Comprehensive and quantitative analysis of G1 cyclins. A tool for studying the cell cycle

Affiliations

Comprehensive and quantitative analysis of G1 cyclins. A tool for studying the cell cycle

Elisabet Bállega et al. PLoS One. .

Abstract

In eukaryotes, the cell cycle is driven by the actions of several cyclin dependent kinases (CDKs) and an array of regulatory proteins called cyclins, due to the cyclical expression patterns of the latter. In yeast, the accepted pattern of cyclin waves is based on qualitative studies performed by different laboratories using different strain backgrounds, different growing conditions and media, and different kinds of genetic manipulation. Additionally, only the subset of cyclins regulating Cdc28 was included, while the Pho85 cyclins were excluded. We describe a comprehensive, quantitative and accurate blueprint of G1 cyclins in the yeast Saccharomyces cerevisiae that, in addition to validating previous conclusions, yields new findings and establishes an accurate G1 cyclin blueprint. For the purposes of this research, we produced a collection of strains with all G1 cyclins identically tagged using the same and most respectful procedure possible. We report the contribution of each G1 cyclin for a broad array of growing and stress conditions, describe an unknown role for Pcl2 in heat-stress conditions and demonstrate the importance of maintaining the 3'UTR sequence of cyclins untouched during the tagging process.


Conflict of interest statement

The authors have declared that no competing interests exist.

Figures

Fig 1
Fig 1. The 3’UTR sequence of cyclin genes is important for protein levels.
A) Protein amounts for Clb5 (right) and Pcl1 (left), Cdc28 and Pho85 cyclins, respectively. The genes of both cyclins were modified to introduce the 3HA tag sequence, either eliminating or retaining the 3’UTR sequence. Cells were grown to the exponential phase in YPD (see Materials and Methods), synchronized in G1 with α-factor and released in fresh YPD medium. At specific times, samples were taken and protein amounts were determined by western blot analysis using Image Studio Lite software. Representative western blot images are depicted. Although the blots for cyclins with and without 3’UTR are presented as separate images, they were realized, analysed and developed in the same membrane. B) Quantification of the amount of Pcl1-3HA and Clb5-3HA with and without 3’UTR. As in A), the signal from the western blots was quantified using Image Studio Lite software. Values were standardized using loading control and were relativized to the maximum expression amounts. Mean±SEM values for three and four independent experiments for Clb5 and Pcl1, respectively, are shown. C) Duplication time of strains bearing PCL1-3HA or CLB5-3HA with or without the 3’UTR sequence. Cells were grown overnight in YPD at 30°C, diluted to OD = 0.4 in fresh medium and incubated in a water shaker at 30°C. Samples were taken every 10 min over 420 min. Optical density (wavelength 660 nm) was used as a measure of cell density. Mean±SEM values for three independent experiments are shown. An asterisk indicates a statistically significant difference (p≤0.05).
Fig 2
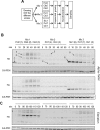
Fig 2. Experimental setup for determining G1 cyclin amounts.
A) Workflow and pooling scheme. Strains were grown overnight in YPD at 30°C in a water shaker, diluted in fresh medium, mixed in three different sets according to the molecular weight of the tagged proteins, grown in the exponential phase, synchronized, released in fresh medium and subjected to the designed stress or treatment (see Materials and Methods). B) Two representative and independent western blot images (to show reproducibility) used to quantify G1 cyclin amounts. Cells were synchronized using α-factor and samples were obtained as described in A), separated by SDS-PAGE and blotted and developed (see Materials and Methods). The different cyclins are indicated by numbers in the upper image. C) Same procedure as in B), except that cells were synchronized by elutriation, with time 0 corresponding to the moment the cells were retrieved from the elutriation device, after which the cells were incubated under agitation at 30°C.
Fig 3
Fig 3. Cyclin waves in S. cerevisiae growing in normal lab conditions (YPD at 30°C).
G1 cyclin waves as determined in this research. From top to bottom, the panels show the Cdc28 G1 cyclins, the Pho85 G1 cyclins and the different molecular markers (Clb5 and Sic1) and morphological markers (budding percentage and size for elutriation). START, determined as the moment in which Sic1 and Clb5 amounts were identical, is extrapolated as a dashed line to all the panels. A) Cells were synchronized by centrifugal elutriation (left panels) or α-factor (right panels). Time 0 corresponds to the moment of cell removal from the elutriation device or α-factor removal, after which cells were incubated under agitation at 30°C. Note that the time elapsed before the cells resumed the cell cycle was greater after elutriation than after α-factor treatment. B) Since the amount of Cln3-3HA is very low, it is plotted both with the other Clns and individually so as to clearly represent levels. In the case of α-factor synchronization, at least three independent western blot experiments as in Fig 2B were quantified, standardized using loading control and relativized to the maximum expression amounts (Cln2). Values are expresed as mean±SEM.
Fig 4
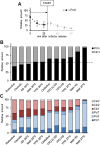
Fig 4. Cyclin amounts in different conditions and stresses.
Strains were grown and processed as described in Fig 2B. Western blots were quantified, values were standardized using loading control, relativized to the maximum expression amounts and plotted as in Figs 1B and 3B. A) Cyclin amounts in particular environmental or stress conditions were obtained by calculating the area under the curve from α-factor release to START. B) Pcl and Cln amounts were calculated as for A). Conditions are ordered according to increasing amounts of Pcl. C) Same procedure as in A) but with the different members of the two cyclin families separated. Conditions are ordered according to increasing amounts of Pcl. Values are expressed as means of at least three independent experiments.
Fig 5
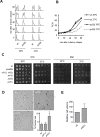
Fig 5. Cell cycle progression and thermosensitivity of pcl2Δ cells.
A) FACS analysis of wild-type and pcl2Δ cells from the BY4741 background. Cells were grown exponentially at 30°C in YPD, synchronized in G1 with α-factor and released in fresh YPD medium at 30°C or 37°C. B) Quantification of cells with 2n DNA content from A). C) Spot assay. W303 background cells were grown in YPD or a malt-based medium to the exponential phase and diluted to an optical density of 0.05 (wavelength 660 nm). Spotted on plates were 5 μl of tenfold sequential dilution for incubation at the indicated temperature. D) Nomarski images of the strains after 5 h at 37°C. Arrows indicate cells showing a ‘mickey mouse’ phenotype and the bar represents 10 μm. The ‘mickey mouse’ cells were quantified (mean±SEM) for three different experiments. E) Relative cell volume (mean±SEM), based on measurement of some 30 cells from each of the three independent experiments.

Similar articles

Cited by

References

    1. Nurse P, Bissett Y. Gene required in G1 for commitment to cell cycle and in G2 for control of mitosis in fission yeast. Nature. 1981. 292(5823): 558–560. 10.1038/292558a0 - DOI - PubMed
    1. Reed SI, Hadwiger JA, Lorincz AT. Protein kinase activity associated with the product of the yeast cell division cycle gene CDC28. Proc Natl Acad Sci U S A. 1985. 82(12): 4055–4059. 10.1073/pnas.82.12.4055 - DOI - PMC - PubMed
    1. Reed SI, Wittenberg C. Mitotic role for the Cdc28 protein kinase of Saccharomyces cerevisiae. Proc Natl Acad Sci U S A. 1990. 87(15): 5697–5701. 10.1073/pnas.87.15.5697 - DOI - PMC - PubMed
    1. Nurse P. Universal control mechanism regulating onset of M-phase. Nature. 1990. 344(6266): 503–508. 10.1038/344503a0 - DOI - PubMed
    1. Morgan DO. Principles of CDK regulation. Nature. 1995. 374(6518): 131–134. 10.1038/374131a0 - DOI - PubMed

Publication types

MeSH terms

Substances