

Photoacoustic/Ultrasound/Optical Coherence Tomography Evaluation of Melanoma Lesion and Healthy Skin in a Swine Model
- PMID: 31238540
- PMCID: PMC6630987
- DOI: 10.3390/s19122815
Photoacoustic/Ultrasound/Optical Coherence Tomography Evaluation of Melanoma Lesion and Healthy Skin in a Swine Model
Abstract
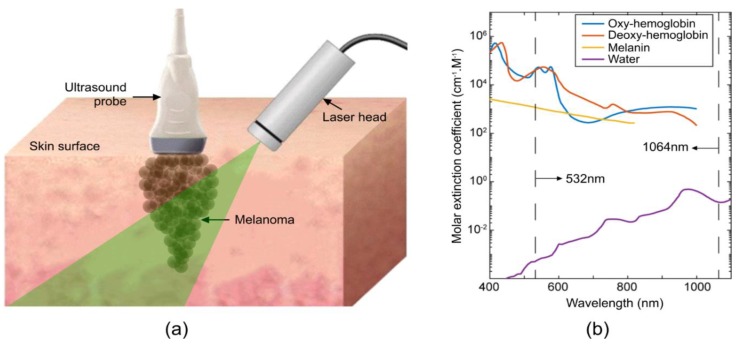
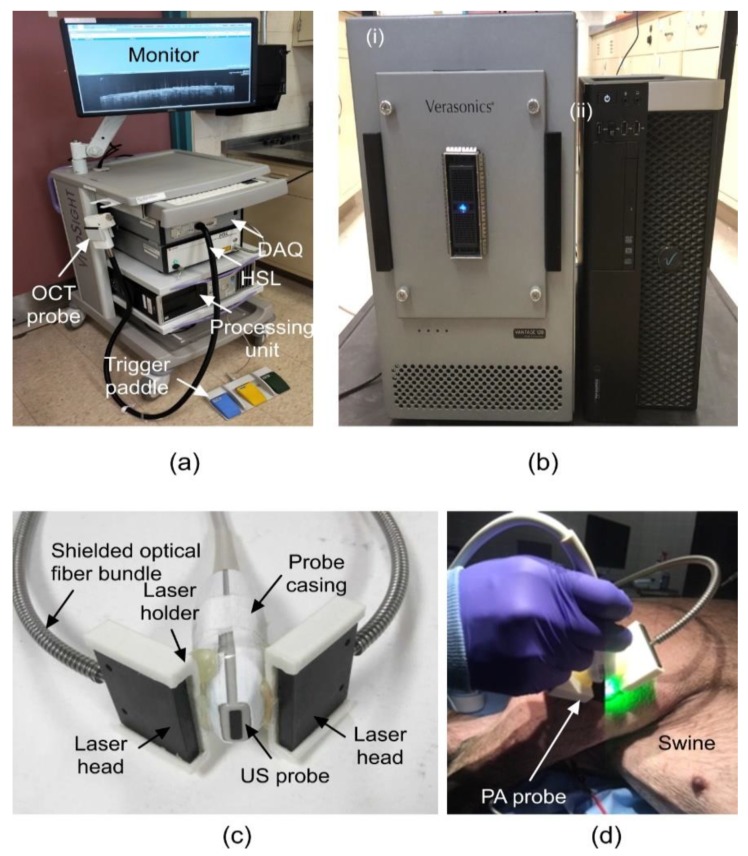
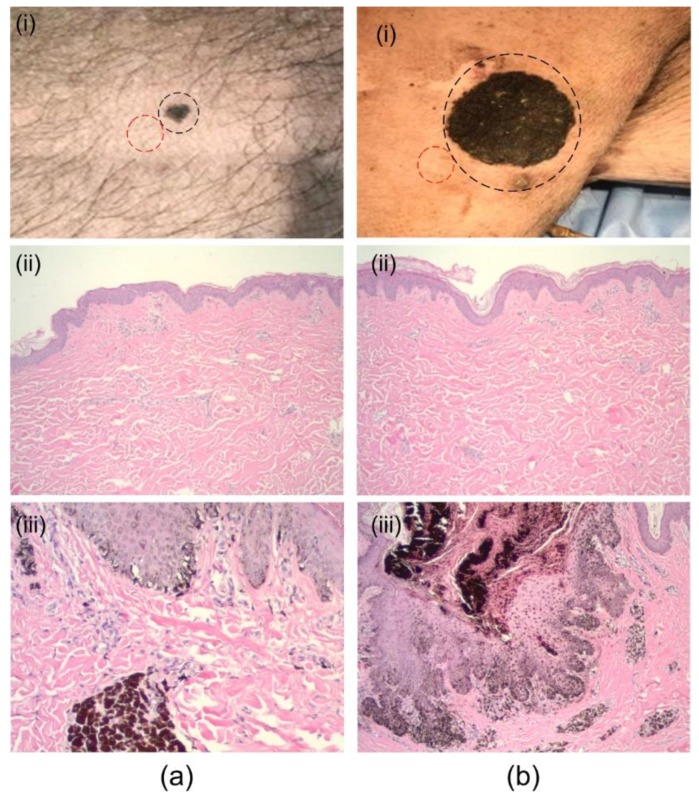
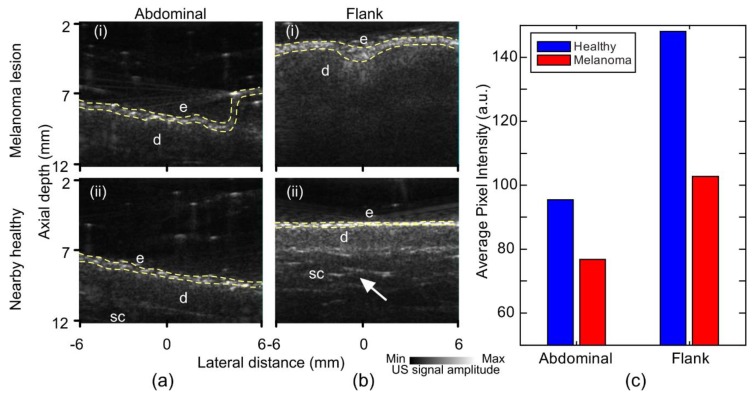
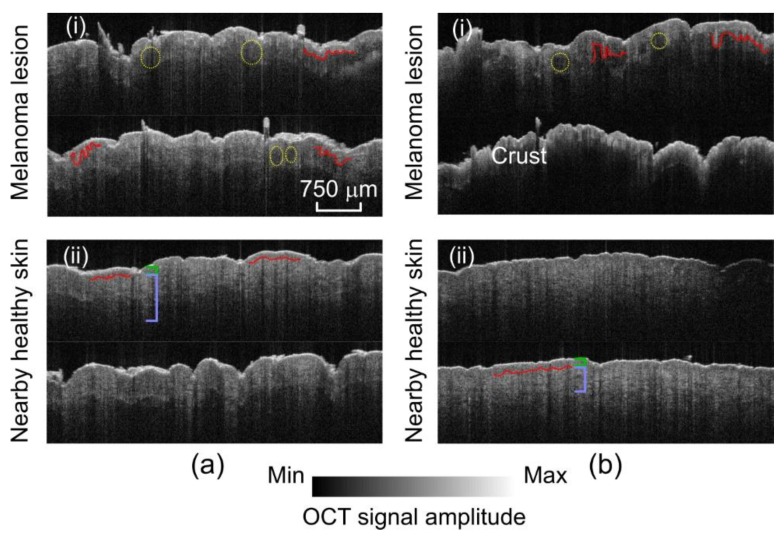
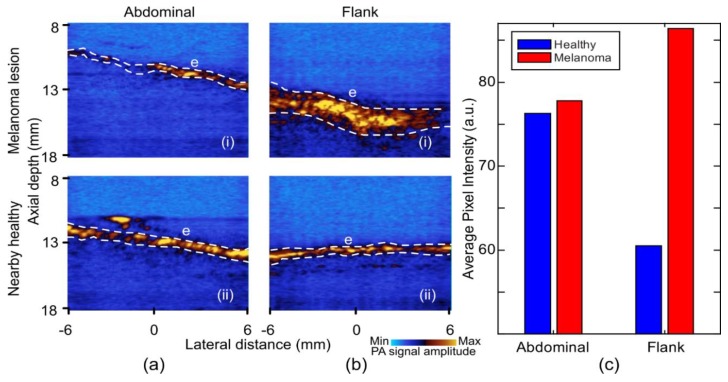
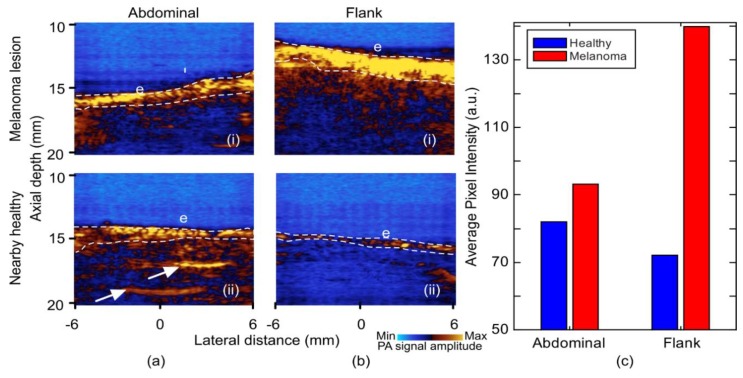
The marked increase in the incidence of melanoma coupled with the rapid drop in the survival rate after metastasis has promoted the investigation into improved diagnostic methods for melanoma. High-frequency ultrasound (US), optical coherence tomography (OCT), and photoacoustic imaging (PAI) are three potential modalities that can assist a dermatologist by providing extra information beyond dermoscopic features. In this study, we imaged a swine model with spontaneous melanoma using these modalities and compared the images with images of nearby healthy skin. Histology images were used for validation.
Keywords: cancer imaging; melanoma; optical coherence tomography; photoacoustic imaging; skin imaging; swine melanoma model; ultrasound.
Conflict of interest statement
The authors declare no conflict of interest.
Figures
Similar articles
-
Optical biopsy approach to basal cell carcinoma and melanoma based on all-optically integrated photoacoustic and optical coherence tomography.Opt Lett. 2017 Jun 1;42(11):2145-2148. doi: 10.1364/OL.42.002145. Opt Lett. 2017. PMID: 28569867
-
Optical coherence tomography imaging of melanoma skin cancer.Lasers Med Sci. 2019 Mar;34(2):411-420. doi: 10.1007/s10103-018-2696-1. Epub 2018 Dec 11. Lasers Med Sci. 2019. PMID: 30539405 Review.
-
Optical Coherence Tomography in the Diagnosis of Skin Cancer.Dermatol Clin. 2017 Oct;35(4):465-488. doi: 10.1016/j.det.2017.06.008. Epub 2017 Aug 9. Dermatol Clin. 2017. PMID: 28886803 Review.
-
Combined ultrasound and photoacoustic C-mode imaging system for skin lesion assessment.Sci Rep. 2023 Oct 20;13(1):17947. doi: 10.1038/s41598-023-44919-5. Sci Rep. 2023. PMID: 37864039 Free PMC article.
-
In-vivo imaging of melanoma with simultaneous dual-wavelength acoustic-resolution-based photoacoustic/ultrasound microscopy.Appl Opt. 2021 May 1;60(13):3772-3778. doi: 10.1364/AO.412609. Appl Opt. 2021. PMID: 33983310
Cited by
-
Monitoring the topical delivery of ultrasmall gold nanoparticles using optical coherence tomography.Skin Res Technol. 2020 Mar;26(2):263-268. doi: 10.1111/srt.12789. Epub 2019 Sep 25. Skin Res Technol. 2020. PMID: 31556193 Free PMC article.
-
Application of photoacoustic computed tomography in biomedical imaging: A literature review.Bioeng Transl Med. 2022 Sep 29;8(2):e10419. doi: 10.1002/btm2.10419. eCollection 2023 Mar. Bioeng Transl Med. 2022. PMID: 36925681 Free PMC article. Review.
-
Automatic Identification and Representation of the Cornea-Contact Lens Relationship Using AS-OCT Images.Sensors (Basel). 2019 Nov 21;19(23):5087. doi: 10.3390/s19235087. Sensors (Basel). 2019. PMID: 31766394 Free PMC article.
-
Advancements in Dermatological Imaging Modalities.Indian Dermatol Online J. 2024 Feb 28;15(2):278-292. doi: 10.4103/idoj.idoj_852_23. eCollection 2024 Mar-Apr. Indian Dermatol Online J. 2024. PMID: 38550821 Free PMC article. No abstract available.
-
Melanoma Biomarkers and Their Potential Application for In Vivo Diagnostic Imaging Modalities.Int J Mol Sci. 2020 Dec 16;21(24):9583. doi: 10.3390/ijms21249583. Int J Mol Sci. 2020. PMID: 33339193 Free PMC article. Review.
References
-
- National Cancer Institute Surveillance, Epidemiology, and End Results Program . Cancer Stat Facts. National Institutes of Health; Washington, DC, USA: 2016. Cancer Stat Facts: Melanoma of the Skin.
-
- American Cancer Society . Cancer Facts & Figures 2018. American Cancer Society; Atlanta, GA, USA: 2018.
MeSH terms
Grants and funding
LinkOut - more resources
Full Text Sources
Medical
