

Molecular Comparison of Imatinib-Naïve and Resistant Gastrointestinal Stromal Tumors: Differentially Expressed microRNAs and mRNAs
- PMID: 31238586
- PMCID: PMC6627192
- DOI: 10.3390/cancers11060882
Molecular Comparison of Imatinib-Naïve and Resistant Gastrointestinal Stromal Tumors: Differentially Expressed microRNAs and mRNAs
Abstract
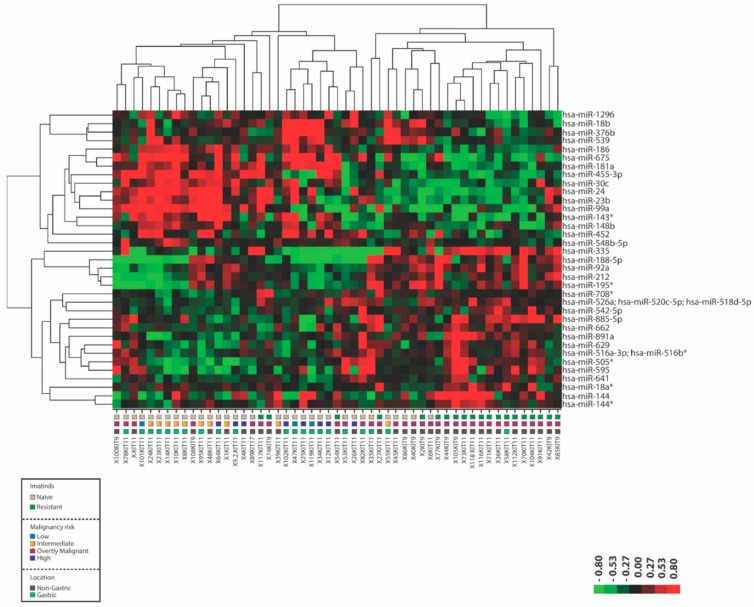
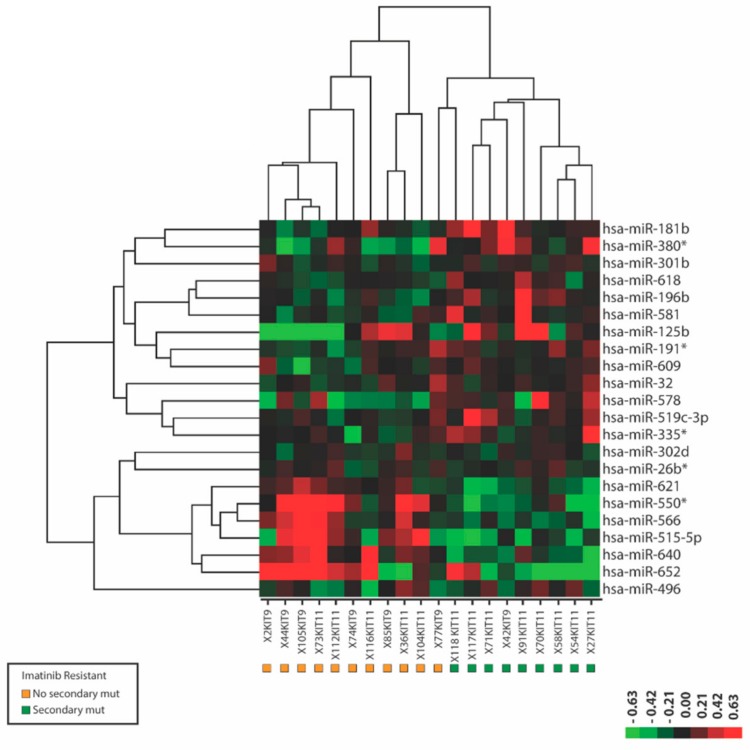
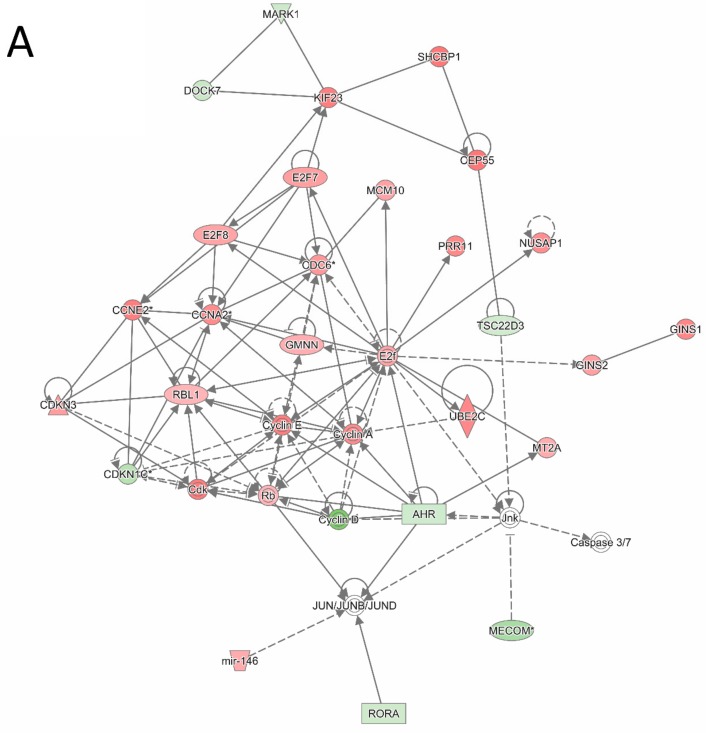
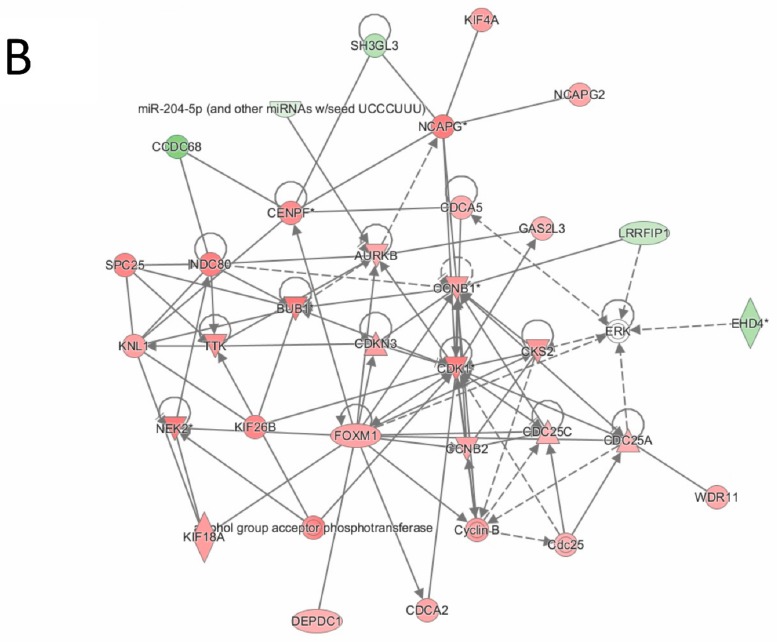
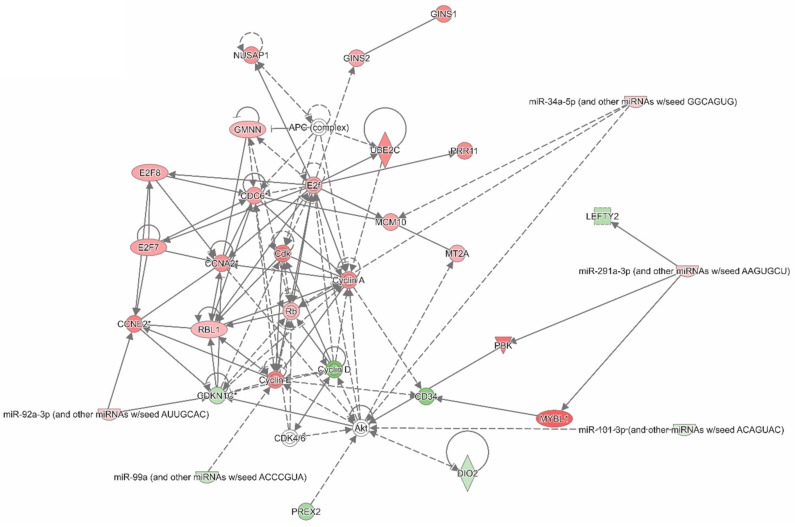
Despite the success of imatinib in advanced gastrointestinal stromal tumor (GIST) patients, 50% of the patients experience resistance within two years of treatment underscoring the need to get better insight into the mechanisms conferring imatinib resistance. Here the microRNA and mRNA expression profiles in primary (imatinib-naïve) and imatinib-resistant GIST were examined. Fifty-three GIST samples harboring primary KIT mutations (exon 9; n = 11/exon 11; n = 41/exon 17; n = 1) and comprising imatinib-naïve (IM-n) (n = 33) and imatinib-resistant (IM-r) (n = 20) tumors, were analyzed. The microRNA expression profiles were determined and from a subset (IM-n, n = 14; IM-r, n = 15) the mRNA expression profile was established. Ingenuity pathway analyses were used to unravel biochemical pathways and gene networks in IM-r GIST. Thirty-five differentially expressed miRNAs between IM-n and IM-r GIST samples were identified. Additionally, miRNAs distinguished IM-r samples with and without secondary KIT mutations. Furthermore 352 aberrantly expressed genes were found in IM-r samples. Pathway and network analyses revealed an association of differentially expressed genes with cell cycle progression and cellular proliferation, thereby implicating genes and pathways involved in imatinib resistance in GIST. Differentially expressed miRNAs and mRNAs between IM-n and IM-r GIST were identified. Bioinformatic analyses provided insight into the genes and biochemical pathways involved in imatinib-resistance and highlighted key genes that may be putative treatment targets.
Keywords: GIST; IPA pathway analysis; drug resistance; gene networks; imatinib; mRNA expression; miRNA.
Conflict of interest statement
The authors declare no conflict of interest. The funders had no role in the design of the study; in the collection, analyses, or interpretation of data; in the writing of the manuscript; or in the decision to publish the results.
Figures
Similar articles
-
[Analysis of imatinib trough concentration at steady state in adjuvant therapy of patients with high risk gastrointestinal stromal tumor].Zhonghua Wei Chang Wai Ke Za Zhi. 2019 Sep 25;22(9):848-855. doi: 10.3760/cma.j.issn.1671-0274.2019.09.009. Zhonghua Wei Chang Wai Ke Za Zhi. 2019. PMID: 31550824 Chinese.
-
A Novel Receptor Tyrosine Kinase Switch Promotes Gastrointestinal Stromal Tumor Drug Resistance.Molecules. 2017 Dec 5;22(12):2152. doi: 10.3390/molecules22122152. Molecules. 2017. PMID: 29206199 Free PMC article.
-
Fibroblast Growth Factor 2 (FGF2) Activates Vascular Endothelial Growth Factor (VEGF) Signaling in Gastrointestinal Stromal Tumors (GIST): An Autocrine Mechanism Contributing to Imatinib Mesylate (IM) Resistance.Cancers (Basel). 2024 Sep 7;16(17):3103. doi: 10.3390/cancers16173103. Cancers (Basel). 2024. PMID: 39272961 Free PMC article.
-
Correlation of imatinib resistance with the mutational status of KIT and PDGFRA genes in gastrointestinal stromal tumors: a meta-analysis.J Gastrointestin Liver Dis. 2013 Dec;22(4):413-8. J Gastrointestin Liver Dis. 2013. PMID: 24369323 Review.
-
Inhibition of FGF2-Mediated Signaling in GIST-Promising Approach for Overcoming Resistance to Imatinib.Cancers (Basel). 2020 Jun 24;12(6):1674. doi: 10.3390/cancers12061674. Cancers (Basel). 2020. PMID: 32599808 Free PMC article. Review.
Cited by
-
Advances in the research of the mechanism of secondary resistance to imatinib in gastrointestinal stromal tumors.Front Oncol. 2022 Sep 6;12:933248. doi: 10.3389/fonc.2022.933248. eCollection 2022. Front Oncol. 2022. PMID: 36147927 Free PMC article. Review.
-
Non-Coding RNAs, a Novel Paradigm for the Management of Gastrointestinal Stromal Tumors.Int J Mol Sci. 2020 Sep 22;21(18):6975. doi: 10.3390/ijms21186975. Int J Mol Sci. 2020. PMID: 32972022 Free PMC article. Review.
-
Aurora kinase A (AURKA) promotes the progression and imatinib resistance of advanced gastrointestinal stromal tumors.Cancer Cell Int. 2021 Jul 31;21(1):407. doi: 10.1186/s12935-021-02111-7. Cancer Cell Int. 2021. PMID: 34332577 Free PMC article.
-
Transcriptomic study of gastrointestinal stromal tumors with liver metastasis.Front Genet. 2023 Feb 23;14:1007135. doi: 10.3389/fgene.2023.1007135. eCollection 2023. Front Genet. 2023. PMID: 36911388 Free PMC article.
-
Heterogeneity of Metabolic Vulnerability in Imatinib -Resistant Gastrointestinal Stromal Tumor.Cells. 2020 May 26;9(6):1333. doi: 10.3390/cells9061333. Cells. 2020. PMID: 32466502 Free PMC article.
References
-
- Heinrich M.C., Corless C.L., Demetri G.D., Blanke C.D., von Mehren M., Joensuu H., McGreevey L.S., Chen C.J., Van den Abbeele A.D., Druker B.J., et al. Kinase mutations and imatinib response in patients with metastatic gastrointestinal stromal tumor. J. Clin. Oncol. 2003;21:4342–4349. doi: 10.1200/JCO.2003.04.190. - DOI - PubMed
Grants and funding
LinkOut - more resources
Full Text Sources
Other Literature Sources
Molecular Biology Databases
