. 2020 Mar;16(3):466-485.
doi: 10.1080/15548627.2019.1628538. Epub 2019 Jun 25.

PLA2G4A/cPLA2-mediated lysosomal membrane damage leads to inhibition of autophagy and neurodegeneration after brain trauma

Affiliations

PLA2G4A/cPLA2-mediated lysosomal membrane damage leads to inhibition of autophagy and neurodegeneration after brain trauma

Chinmoy Sarkar et al. Autophagy. 2020 Mar.

Abstract

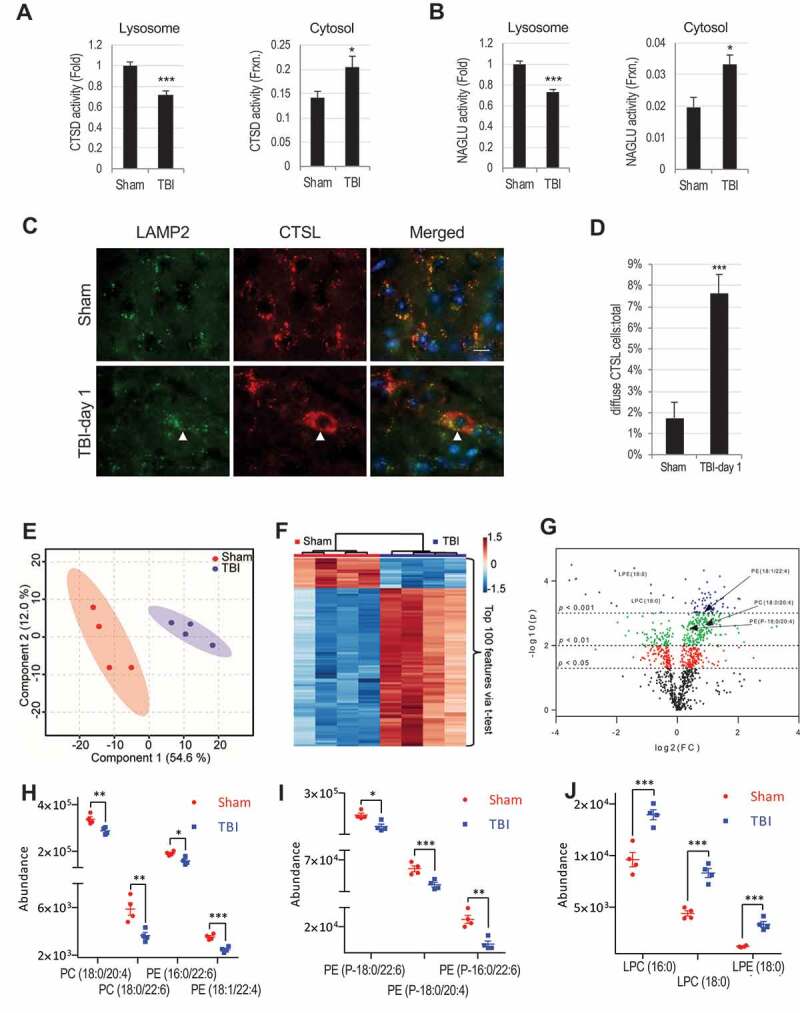
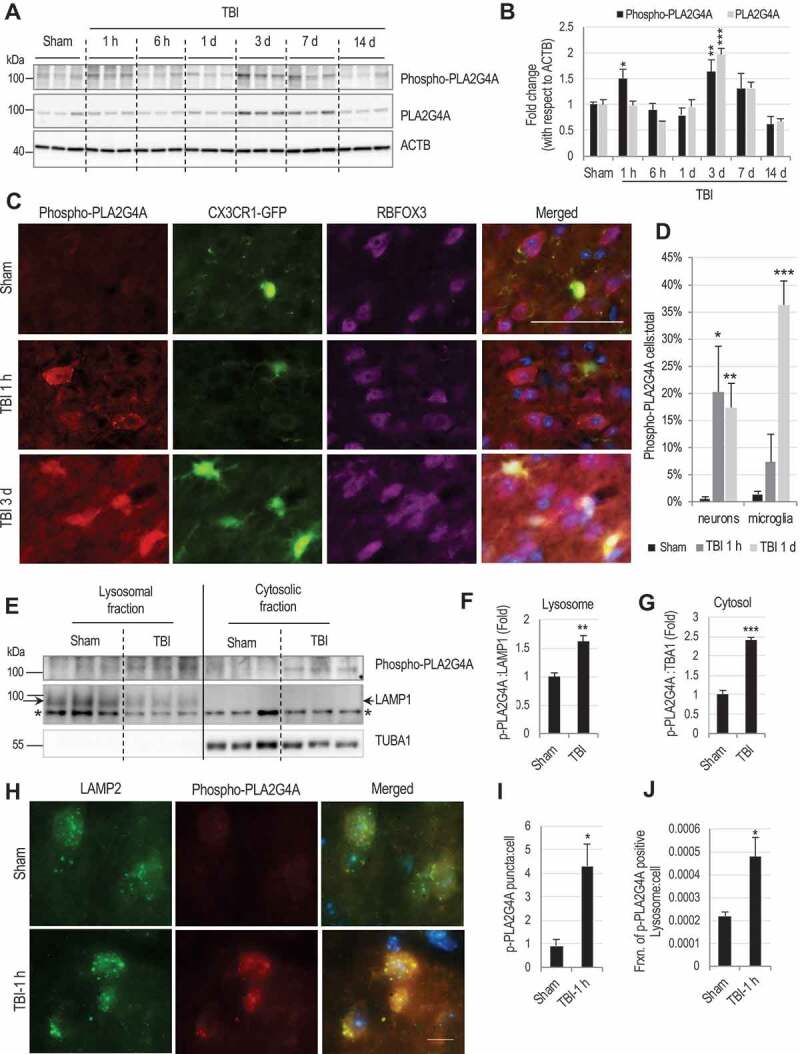
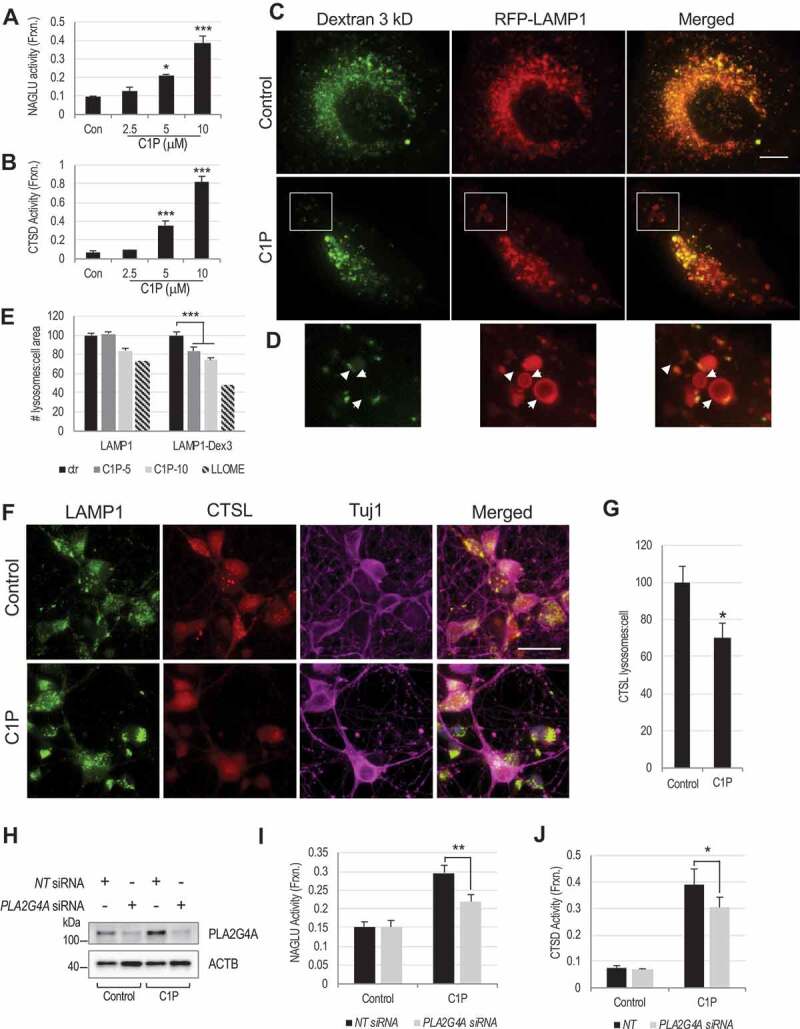
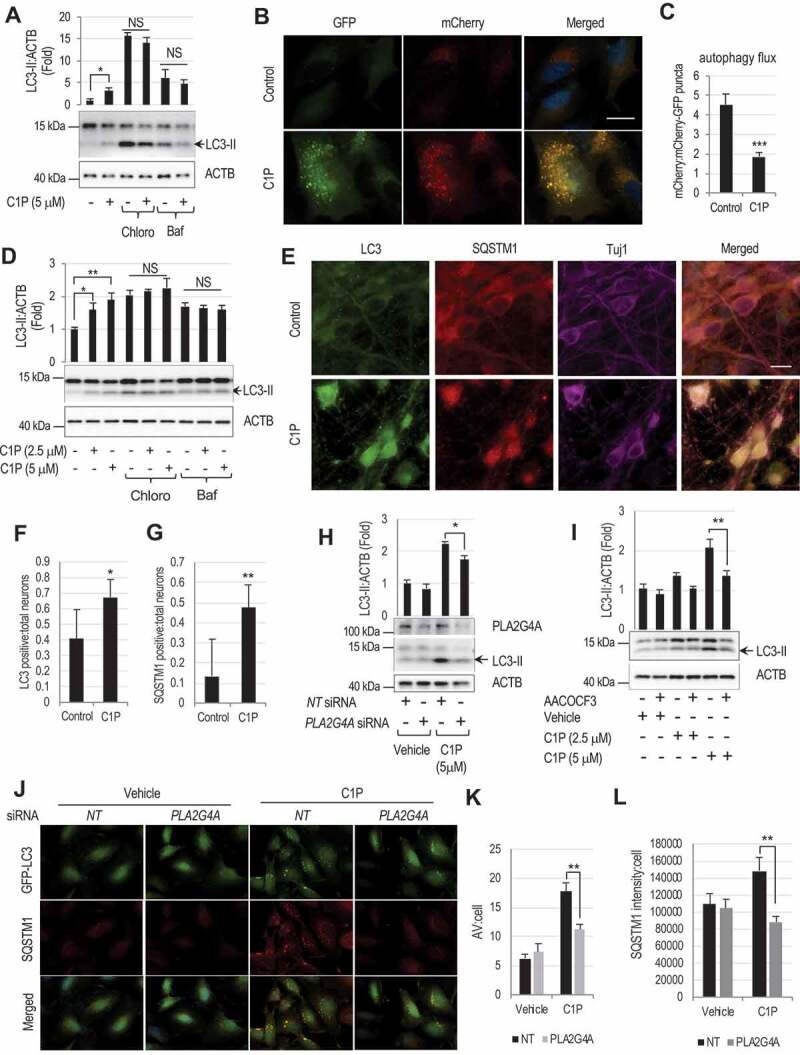
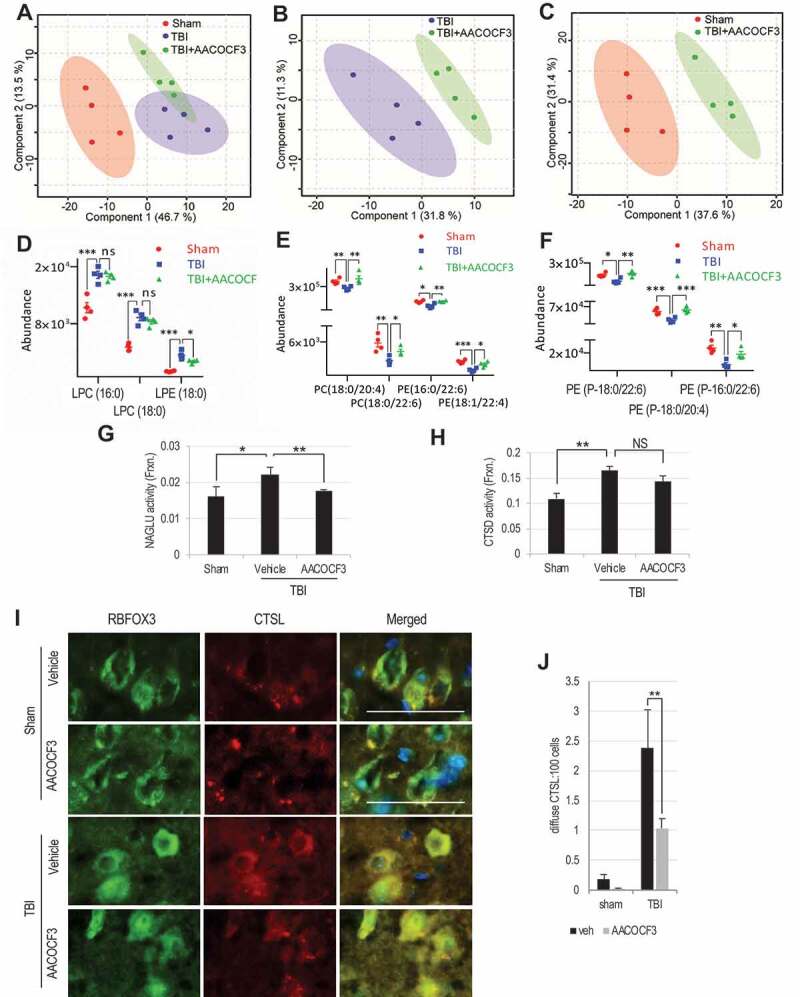
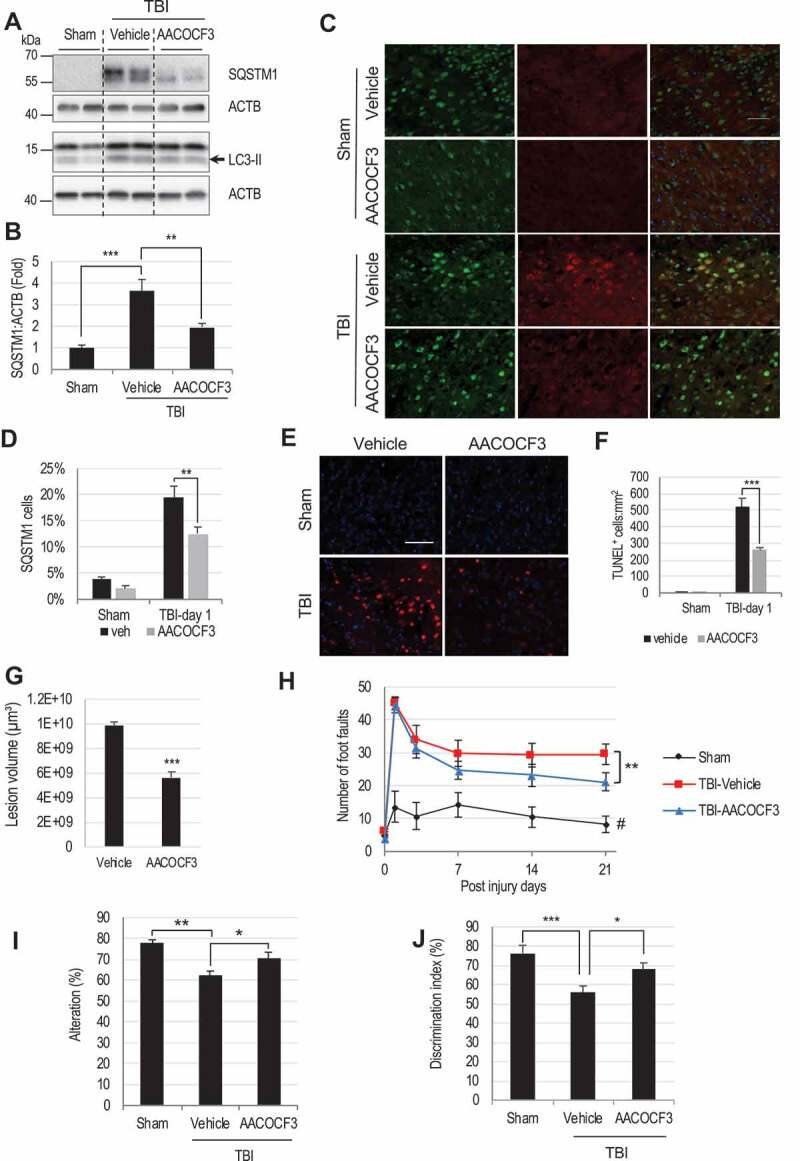
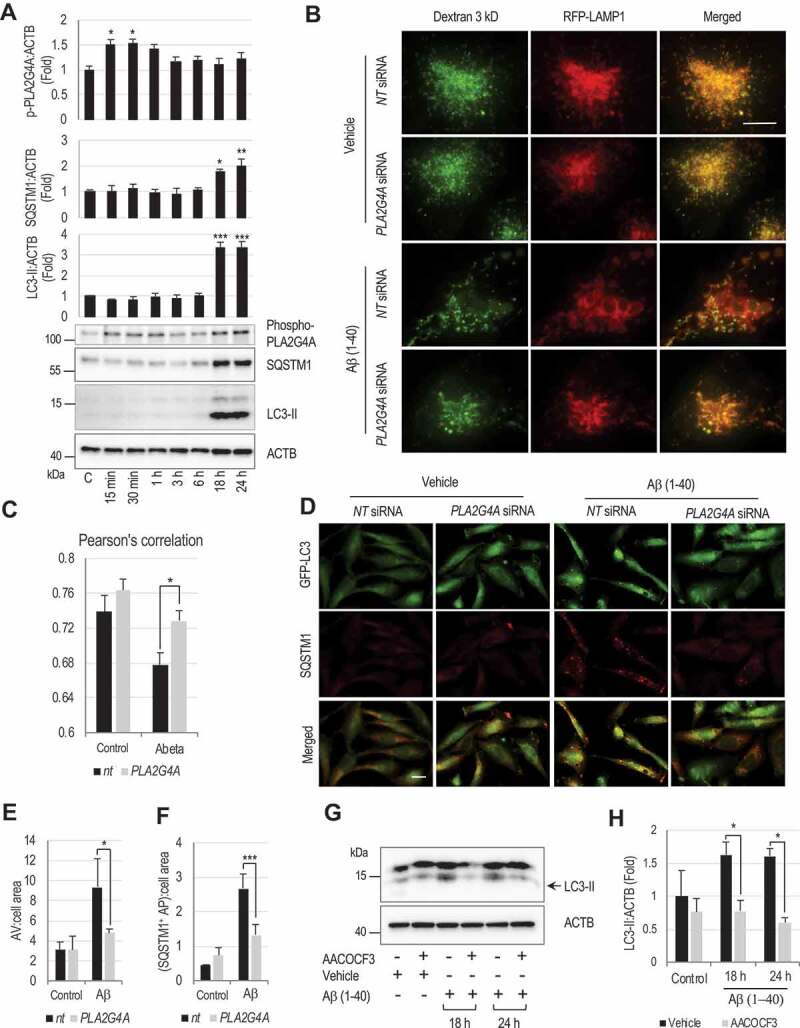
Lysosomal membrane permeabilization (LMP) is observed under many pathological conditions, leading to cellular dysfunction and death. However, the mechanisms by which lysosomal membranes become leaky in vivo are not clear. Our data demonstrate that LMP occurs in neurons following controlled cortical impact induced (CCI) traumatic brain injury (TBI) in mice, leading to impaired macroautophagy (autophagy) and neuronal cell death. Comparison of LC-MS/MS lysosomal membrane lipid profiles from TBI and sham animals suggested a role for PLA2G4A/cPLA2 (phospholipase A2, group IVA [cytosolic, calcium-dependent]) in TBI-induced LMP. Activation of PLA2G4A caused LMP and inhibition of autophagy flux in cell lines and primary neurons. In vivo pharmacological inhibition of PLA2G4A attenuated TBI-induced LMP, as well as subsequent impairment of autophagy and neuronal loss, and was associated with improved neurological outcomes. Inhibition of PLA2G4A in vitro limited amyloid-β-induced LMP and inhibition of autophagy. Together, our data indicate that PLA2G4A -mediated lysosomal membrane damage is involved in neuronal cell death following CCI-induced TBI and potentially in other neurodegenerative disorders.Abbreviations: AACOCF3, arachidonyl trifluoromethyl ketone; ACTB/β-actin, actin, beta; AD, Alzheimer disease; ATG5, autophagy related 5; ATG7, autophagy related 7; ATG12, autophagy related 12; BECN1, beclin 1, autophagy related; C1P, ceramide-1-phosphate; CCI, controlled cortical impact; CTSD, cathepsin D; CTSL, cathepsin L; GFP, green fluorescent protein; IF, immunofluorescence; LAMP1, lysosomal-associated membrane protein 1; LAMP2, lysosomal-associated membrane protein 2; LC-MS/MS, liquid chromatography-tandem mass spectrometry; LMP, Lysosomal membrane permeabilization; LPC, lysophosphatidylcholine; LPE, lysophosphatidylethanolamine; MAP1LC3/LC3, microtuble-associated protein 1 light chain 3; NAGLU, alpha-N-acetylglucosaminidase (Sanfilippo disease IIIB); PC, diacyl glycerophosphatidylcholine; PE, diacyl glycerophosphatidylethanolamine; PE-O, plasmanyl glycerophosphatidylethanolamine; PE-P, plasmenyl glycerophosphatidylethanolamine; PLA2G4A/cPLA2, phospholipase A2, group IVA (cytosolic, calcium-dependent); RBFOX3, RNA binding protein, fox-1 homolog (C. elegans) 3; RFP, red fluorescent protein; ROS, reactive oxygen species; SQSTM1, sequestosome 1; TUBA1/α-tubulin, tubulin, alpha; TBI, traumatic brain injury; TFEB, transcription factor EB; ULK1, unc-51 like kinase 1.

Keywords: Amyloid β; autophagy; cytosolic phospholipase A2 (cPLA2); lysosomal membrane permeabilization (LMP); membrane lipidomic analysis; traumatic brain injury (TBI).


Figures

Figure 1.
Figure 1.
TBI leads to lysosomal membrane permeabilization and altered lysosomal membrane lipid composition. (A-B) Activity of lysosomal enzymes (A) CTSD (cathepsin D) and (B) NAGLU is decreased in lysosomal and increased in cytosolic fractions from sham and TBI mouse cortex. Data are mean ± SEM, n = 10 mice/group for CTSD and 5 for NAGLU; *p < 0.05, ***p < 0.001 (students’ t-test). (C) Images (60x) demonstrating leakage of cathepsin L (CTSL) (red) from lysosomes stained with antibody against lysosomal membrane protein LAMP2 (green) into the cytosol in the cortex of mice 24 h after TBI. Cells with diffused CTSL (cytosolic) staining are indicated with arrowheads in the injured brain sections. Scale bar:10 μm. (D) Quantification of cells with diffused CTSL. Data are mean ± SEM, n = 3 sham and 5 TBI mice; ***p < 0.001 (students’ t-test). (E-J) Results of LC-MS/MS lipid analysis of purified cortical lysosomal membranes from sham and TBI mice at 1 h after injury. (E) Partial Least Squares – Discriminate Analysis (PLS-DA) plot comparing sham (red) and TBI (blue) in positive ion mode UPLC-HDMS demonstrating separation of sham and TBI data; R2 = 0.98, Q2 = 0.81. Each point represents a data set from an individual animal. The 95% confidence intervals are indicated by elliptical shaded areas surrounding each group. Data were sum normalized, log transformed, and mean centered. (F) Heatmap displaying the top 100 differential abundance features based on t-test/ANOVA, euclidean distancing and ward clustering in positive ion mode UPLC-HDMS. (G) Volcano plot highlighting features that had a < 0.05 (red), p < 0.01(green), and p < 0.001 (blue) when comparing Sham to TBI. Location of selected lipid species of interest is indicated. The x-axis is log2(FC) (FC = fold change) and the y-axis is – log10(p) (p = p-value based on t-test). Plots in E-G generated using Metaboanalyst; n = 4 mice/group. (H-J) Altered abundance of specific phospholipid classes in lysosomal membranes from cortices of sham (red) and TBI (blue) mice. Statistical significance was determined using t-test. (H) PC/PE abundance. Calculated p-values were 0.0080 (PC(18:0/20:4)), 0.0084 (PC(18:0/22:6)), 0.0112 (PE(16:0/22:6)), and 0.0006 (PE(18:1/22:4)). (I) Ether PE abundance. Calculated p-values were 0.0106 (PE(P-18:0/22:6)), 0.0050 (PE(P-18:0/20:4)), and 0.0026 (PE(P-18:0/22:6)). (J) LPC/LPE abundance. Calculated p-values were 0.0020 (LPC(16:0)), 0.0002 (LPC(18:0)), and 0.0003 (LPE(18:0)). Individual data points as well as mean ± SEM are indicated; n = 4 mice/group.
Figure 2.
Figure 2.
PLA2G4A is activated and present at lysosomal membranes after TBI. (A) Western blot of phospho- and total PLA2G4A in cortical tissue lysates from sham and TBI animals. Each lane represents an individual animal. (B) Quantification of phosopho- (black bars) and total (gray bars) PLA2G4A normalized to loading control (ACTB). Data are mean ± SEM, n = 3 mice/group; *p < 0.05, **p < 0.01, ***p < 0.001 vs. sham. (Two-way ANOVA with Bonferroni posttests). (C and D) Time dependent and cell type specific activation of PLA2G4A after TBI. (C) Images (20×) of Cx3CR1-GFP (marks microglia) mouse cortical brain sections stained with antibodies against phospho- PLA2G4A (red) and neuronal marker RBFOX3/NeuN (purple). Scale bar: 50 μm. (D) Quantification of phospho-PLA2G4A positive neurons and microglial cells in sham (black bars) and injured brain sections at 1 h (dark gray) and 1 day (light gray) after TBI. Data are mean ± SEM, n = 3 mice/group; *p < 0.05, **p < 0.01, ***p < 0.001 vs. sham. (Two-way ANOVA with Bonferroni posttests); (E-J) Activated PLA2G4A is present at the lysosomes after TBI. (E) Western blot of phospho-PLA2G4A in lysosomal and cytosolic fractions from cortices of sham and TBI mice. *indicated non-specific band. (F-G) Quantification of phospho-PLA2G4A with respect to the loading controls (F) LAMP1 in lysosomal fractions and (G) TUBA1/α-tubulin in the cytosolic fraction. Data are mean ± SEM, n = 4 mice/group; **p < 0.01, ***p < 0.001 (Students’ t-test). (H) Images (60×) of cells in the cortex of sham and TBI (1 h) mice stained with antibodies against lysosomal membrane protein LAMP2 (green) and phospho-PLA2G4A (red). Scale bar: 10 μm. (I-J) Quantification of data from (H) demonstrating increased levels of phospho-PLA2G4A at lysosomes in the injured brain section as compared to sham. (I) Quantification of phospho-PLA2G4A puncta in sham and TBI (1 h) brain sections. (J) Quantification of fraction of phospho-PLA2G4A-positive lysosomes per cell in sham and TBI (1 h) brain sections. Data are presented as mean ± SEM, n = 3 sham and 4 TBI mice; *p < 0.05, (Students’ t-test).
Figure 3.
Figure 3.
PLA2G4A activation leads to LMP in H4 neuroglioma cells and rat cortical neurons. (A and B) Activity of lysosomal enzymes (A) NAGLU and (B) CTSD in the digitonin extracted cytosolic fractions of H4 neuroglioma cells treated with PLA2G4A activator, ceramide-1-phosphate (C1P). Data are mean ± SEM, n = 6 for NAGLU and 3 for CTSD; *p < 0.05, ***p < 0.001 (One-way ANOVA with Turkey’s multiple comparison test). (C-E) C1P mediated PLA2G4A activation causes leakage of Alexa Fluor 488 dextran from lysosomes. (C) Images (60×) of H4 cells expressing RFP-LAMP1 and loaded with Alexa Fluor 488-dextran (3 kDa) treated with C1P or vehicle for 4 h. Scale bar: 10 μm (D) Magnified image of inset in (C). Many RFP-LAMP1 positive lysosomes are partially or fully devoid of Alexa Fluor 488 dextran (arrowheads) in C1P-trated cells. (E) Quantification of Alexa Fluor 488-dextran positive lysosomes (LAMP1-Dex3) in H4 cells treated with C1P (5 and 10 μM) or LLOME positive control for 4 h. Data are mean ± SEM, n = 9 for control and cells treated with 10 μM C1P and 6 for cells treated with 5 μM C1P; ***p < 0.001. (Two-way ANOVA with Bonferroni posttests). (F-G) C1P treatment causes leakage of lysosomal enzyme CTSL into the cytosol in rat cortical neurons. (F) Images (60×) of C1P (2.5 μM) treated rat cortical neurons stained with antibodies against lysosomal membrane protein LAMP1, soluble lysosomal enzyme CTSL and neuronal marker TUBB3/Tuj1. Scale bar: 20 μm. (G) Quantification of CTSL positive lysosomes per cell. Data are mean ± SEM, n = 12; *p < 0.05, vs. control. (Students’ t-test). (H-J) Lysosomal enzyme activity in the cytosolic fraction of C1P treated H4 is attenuated following siRNA-mediated knock down of PLA2G4A as compared to non-targeting (NT) controls. (H) Western blot confirming knock down of PLA2G4A in PLA2G4A siRNAs transfected cells. (I-J) Activity of lysosomal enzymes (I) NAGLU and (J) CTSD in the digitonin extracted cytosolic fractions of C1P treated or control H4 cells transfected with either non-targeting (NT) or PLA2G4A siRNAs. Data are presented as mean ± SEM, n = 4; *p < 0.05, **p < 0.01 (Two-way ANOVA with Bonferroni posttests).
Figure 4.
Figure 4.
PLA2G4A -mediated lysosomal damage causes inhibition of autophagy flux. (A) Western blot and corresponding quantification of LC3-II levels in H4 cells treated with lysosomal inhibitors chloroquine or bafilomycin in the presence or absence of C1P (5 μM) for 4 h. Data are mean ± SEM, n = 4; *p < 0.05, (Two-way ANOVA with Bonferroni posttests). (B) Images (60×) of C1P (5 μM) treated H4 cells expressing mCherry-GFP-LC3 reporter and (C) quantification of mCherry to mCherry-GFP puncta ratio, indicating inhibition of autophagy flux in C1P treated cells. Scale bar: 20 μm. Data are mean ± SEM, n = 4; *p < 0.05, (Students’ t-test). (D) Western blot and corresponding quantification of LC3-II levels in rat cortical neurons treated with chloroquine or bafilomycin in the presence or absence of C1P (2.5 or 5 μM) for 4 h. Data are mean ± SEM, n = 3; *p < 0.05, **p < 0.01, (Two-way ANOVA with Bonferroni posttests). (E-G) Images (60×) of C1P (5 μM) treated rat cortical neurons stained with antibodies against LC3, SQSTM1 and TUBB3/Tuj1 (E) and quantification of LC3 (F) and SQSTM1 (G) positive neurons. Scale bar: 10 μm. Data are mean ± SEM, n = 6; *p < 0.05, **p < 0.01 (Students’ t-test). (H-I) Knock down or inhibition of PLA2G4A prevent C1P induced accumulation of autophagosomes. (H) Western blot and corresponding quantification of LC3-II in C1P (5 μM) treated H4 cells transfected either with non-targeting (NT) or PLA2G4A (PLA2G4A) siRNAs. Data are mean ± SEM, n = 4; *p < 0.05, (Two-way ANOVA with Bonferroni posttests). (I) Western blot and corresponding quantification of LC3-II in rat cortical neurons pretreated with AACOCF3 (20 μM) for 90 min and then treated with C1P (2.5 μM) for 4 h. Data are mean ± SEM, n = 4; **p < 0.01, (Two-way ANOVA with Bonferroni posttests). (J-L) PLA2G4A knockdown prevents inhibition of autophagy flux in H4 cells. Images (60×) of C1P (5 μM) treated GFP-LC3 expressing H4 cell stained with antibodies against SQSTM1 (J) and quantification of GFP-LC3-positive autophagosomes (AV) per cell (K) and SQSTM1 intensity per cell (L). Scale bar: 20 μm. Data are mean ± SEM, n = 3; **p < 0.01, (Two-way ANOVA with Bonferroni posttests).
Figure 5.
Figure 5.
PLA2G4A inhibition normalizes lysosomal membrane lipid composition and attenuates lysosomal membrane permeabilization after TBI. (A-C) Comparison of positive ion mode UPLC-HDMS of lysosomal membrane prepared from the cortices of sham, TBI and TBI+AACOCF3 using Partial Least Squares – Discriminate Analysis (PLS-DA) plot. Each point represents data set from an individual animal; sham (red), TBI (blue), TBI+AACOCF3 (green). The 95% confidence intervals are indicated by elliptical shaded areas surrounding each group. (A) PLS-DA plot comparing Sham, TBI, and TBI+AACOCF3 in positive ion mode UPLC-HDMS; R2 = 0.97, Q2 = 0.32. (B) PLS-DA plot comparing TBI and TBI+AACOCF3 in positive ion mode UPLC-HDMS; R2 = 0.92, Q2 = 0.34. (C) PLS-DA plot comparing Sham and TBI+AACOCF3 in positive ion mode UPLC-HDMS; R2 = 0.95, Q2 = 0.64. Data were sum normalized, log transformed, and mean centered. n = 4 animals/group. Plots generated using MetaboAnalyst. (D-F) Abundance of specific classes of phospholipids is normalized in the lysosomal membranes from AACOCF3 treated TBI mice as compared to vehicle treated TBI controls. Individual data points as well as mean ± SEM are indicated. Sham (red), TBI (blue), and TBI+AACOCF3 (green). n = 4 animals/group. (D) LPC/LPE abundance. Calculated p-values for TBI to TBI+AACOCF3 were 0.7124 (LPC(16:0)), 0.3140 (LPC(18:0)), and 0. 0366 (LPE(18:0)). (E) PC/PE abundance. Calculated p-values for TBI to TBI+AACOCF3 were 0.0253 (PC(18:0/20:4)), 0.0224 (PC(18:0/22:6)), 0.0071 (PE(16:0/22:6)), and 0.0130 (PE(18:1/22:4)). (F) Ether PE abundance. Calculated p-values for TBI to TBI+AACOCF3 were 0.0074 (PE(P-18:0/22:6)), 0.0020 (PE(P-18:0/20:4)), and 0.0209 (PE(P-18:0/22:6)). (G and H) Activity of lysosomal enzymes (G) NAGLU and (H) CTSD in the cytosolic fraction from sham and TBI mouse cortices. Data are mean ± SEM, n = 8–10 animals/group; *p < 0.05, **p < 0.01 (One-way ANOVA with Turkey’s multiple comparison test). (I-J) IF analysis demonstrating decreased cytoplasmic leakage of CTSL in TBI+AACOCF3 as compared to TBI cortex. (I) Images (20×) of cortical brain sections from sham, sham+AACOCF3, TBI and TBI+AACOCF3 mice stained with antibodies against neuronal marker RBFOX3/NeuN (green) and CTSL (red). Scale bar: 50 μm (J) Corresponding quantification of cells with diffused (cytosolic) CTSL staining. Data are mean ± SEM, n = 3 for vehicle or AACOCF3 treated sham and 5 for vehicle or AACOCF3 treated TBI mice; *p < 0.05, (Two-way ANOVA with Bonferroni posttests).
Figure 6.
Figure 6.
PLA2G4A inhibition restores autophagy flux, attenuates cortical cell death and improves motor and cognitive function in mice after TBI. (A) Western blot of SQSTM1 and LC3 in sham, TBI and TBI+AACOCF3 cortical lysates and (B) Quantification of SQSTM1 level. Data are mean ± SEM, n = 6 for sham and 10 for vehicle or AACOCF3 treated TBI mice; **p < 0.01, ***p < 0.001, (One-way ANOVA with Turkey’s multiple comparison test). (C and D) IF analysis demonstrating decreased SQSTM1 accumulation in AACOCF3 treated TBI cortical neurons as compared to TBI controls. (C) Images (20×) of cortical brain sections of sham, sham+AACOCF3, TBI and TBI+AACOCF3 mice stained with antibodies against neuronal marker RBFOX3/NeuN and SQSTM1. Scale bar: 50 μm. (D) Quantification of SQSTM1 positive cells. Data are mean ± SEM, n = 3 for vehicle or AACOCF3 treated sham and 5 for vehicle or AACOCF3 treated TBI mice; *p < 0.05, ***p < 0.001, (Two-way ANOVA with Bonferroni posttests). (E) Images (20×) demonstrating decreased cell death (TUNEL) in cortical brain sections from TBI+AACOCF3 as compared to TBI mice. Scale bar: 50 μm (F) Quantification of TUNEL positive cells. Data are mean ± SEM, n = 3 for vehicle or AACOCF3 treated sham and 5 for vehicle or AACOCF3 treated TBI mice; ***p < 0.001, (Two-way ANOVA with Bonferroni posttests). (G) Quantification of lesion volume (Cavalieri method) at 28 days post injury in TBI and TBI+AACOCF3 mouse cortices. Representative images are included in the Fig. S6N. Data are mean ± SEM, n = 7 for vehicle treated and 8 for AACOCF3 treated TBI mice; ***p < 0.001, vs. vehicle treated TBI group. (Students’ t-test). (H-J) AACOCF3 treatment leads to improved functional outcomes after TBI. (H) Assessment of sensorimotor function of sham, TBI+vehicle and TBI+AACOCF3 mice at days 1, 3, 7, 14 and 21 post injury using the beam-walk test. Day 0 represents baseline prior to injury. AACOCF3 treatment of TBI mice led to improvement in motor function vs. TBI+vehicle controls, starting from day 14 (p = 0.0513) and increasing through day 21 (**p = 0.0047). Data are mean ± SEM, n = 11 sham, 14 TBI+vehicle and 14 TBI+AACOCF3 mice. Significant effects of injury and AACOCF3 treatment [F(2,26) = 18.41; p < 0.0001] were detected across all time points [F(5,65) = 105.8, p < 0.0001] except day 0. (Two-way repeated-measures ANOVA with Turkey’s multiple comparison test). (I) Spatial memory assessment using Y-maze spontaneous alternation test at 7 day after TBI. TBI led to significantly reduced percentages of spontaneous alternation (**p < 0.01 vs. sham). AACOCF3 treatment significantly increased percentage of spontaneous alternation compared with the vehicle treated TBI group (*p < 0.05). Data are mean ± SEM, n = 11 sham and 14 TBI and TBI+AACOCF3 mice, (One-way ANOVA, with Turkey’s multiple comparison test). (J) Memory retention assessment by novel object recognition (NOR) in mice at day 22 after TBI. All groups spent equal time with the two identical objects during the sample phase (Fig. S6O). AACOCF3 treated TBI mice spent significantly more time with the novel vs. familiar object as compared with vehicle treated TBI group (*P < 0.05). Significant differences were also observed between the sham and vehicle treated TBI group (**P < 0.01). Data are mean ± SEM, n = 11 sham and 14 TBI and TBI+AACOCF3 mice, (One-way ANOVA with Turkey’s multiple comparison test).
Figure 7.
Figure 7.
Amyloid-β activates PLA2G4A leading to LMP and subsequent autophagy impairment. (A) Western blot demonstrating activating phosphorylation of PLA2G4A, and accumulation of SQSTM1 and LC3-II in amyloid-β(1–40) (5 μM) treated H4 neuroglioma cells and corresponding quantification. Data are mean ± SEM, n = 3, *p < 0.05, **p < 0.01, ***p < 0.001, (One-way ANOVA with Turkey’s multiple comparison test). (B and C) Amyloid-β-induced PLA2G4A activation causes lysosomal abnormalities and LMP. (B) Images (60×) of H4 cells expressing RFP-LAMP1 treated with amyloid-β(1–40) (5 μM) or vehicle control. Cells were transfected with either non-targeting (NT) or PLA2G4A siRNA for 48 h, loaded with Alexa Fluor 488-dextran (3 kDa) and then treated with amyloid β(1–40) for 18 h. Enlarged lysosomes with low dextran levels were detected in amyloid-β treated cells. Lysosomal abnormalities were attenuated in cells transfected with PLA2G4A siRNA. Scale bar: 10 μm. (C) Pearson’s correlation analysis of Alexa fluor 488 dextran co-localization to RFP-LAMP1 lysosomes. (*p < 0.05), n = 10. (D-F) Knock down of PLA2G4A attenuated inhibition of autophagy flux induced by amyloid-β treatment. (D) Images (20×) of GFP-LC3 expressing H4 cells treated amyloid-β for 24 h and stained with antibody against SQSTM1. Cells were transfected with either NT or PLA2G4A siRNA 48 h prior to treatment. Scale bar: 20 μm. (E-F) Quantification of (E) GFP-LC3 positive autophagic vesicles (AV) and (F) SQSTM1 positive cells. Data are mean ± SEM, n = 3; *p < 0.05, ***p < 0.001, (Two-way ANOVA with Bonferroni posttests). (G and H) PLA2G4A/inhibition prevents amyloid-β-induced autophagosome accumulation in rat cortical neurons. (G) Western blot of LC3 in rat cortical neuron cells treated with amyloid β in presence or absence of AACOCF3 for 18 or 24 h. (H) Corresponding quantification of LC3-II. Data are presented as mean ± SEM, n = 4; *p < 0.05, (Two-way ANOVA with Bonferroni posttests).

References

    1. Xiong Y, Mahmood A, Chopp M.. Animal models of traumatic brain injury. Nat Rev Neurosci. 2013. February;14(2):128–142.nrn3407 [pii]. PubMed PMID: 23329160; PubMed Central PMCID: PMC3951995. eng. - PMC - PubMed
    1. Werner C, Engelhard K.. Pathophysiology of traumatic brain injury. Br J Anaesth. 2007. July;99(1):4–9. 99/1/4 [pii] PubMed PMID: 17573392; eng. - PubMed
    1. Loane DJ, Faden AI. Neuroprotection for traumatic brain injury: translational challenges and emerging therapeutic strategies. Trends Pharmacol Sci. 2010. December;31(12):596–604.S0165-6147(10)00168-9 [pii]. PubMed PMID: 21035878; PubMed Central PMCID: PMC2999630. eng. - PMC - PubMed
    1. Gardner AJ, Zafonte R. Neuroepidemiology of traumatic brain injury. Handb Clin Neurol. 2016;138:207–223. B978-0-12-802973-2.00012-4 [pii]. PubMed PMID: 27637960; eng. - PubMed
    1. Jassam YN, Izzy S, Whalen M, et al. Neuroimmunology of traumatic brain injury: time for a paradigm shift. Neuron. 2017. September 13;95(6):1246–1265. [pii]10.1016/j.neuron.2017.07.010. PubMed PMID: 28910616; PubMed Central PMCID: PMC5678753. eng. - PMC - PubMed

Publication types

MeSH terms