. 2019 Jun 25;19(1):628.
doi: 10.1186/s12885-019-5861-4.

Intertumoral heterogeneity in patient-specific drug sensitivities in treatment-naïve glioblastoma

Affiliations

Intertumoral heterogeneity in patient-specific drug sensitivities in treatment-naïve glioblastoma

Erlend Skaga et al. BMC Cancer. .

Abstract

Background: A major barrier to effective treatment of glioblastoma (GBM) is the large intertumoral heterogeneity at the genetic and cellular level. In early phase clinical trials, patient heterogeneity in response to therapy is commonly observed; however, how tumor heterogeneity is reflected in individual drug sensitivities in the treatment-naïve glioblastoma stem cells (GSC) is unclear.

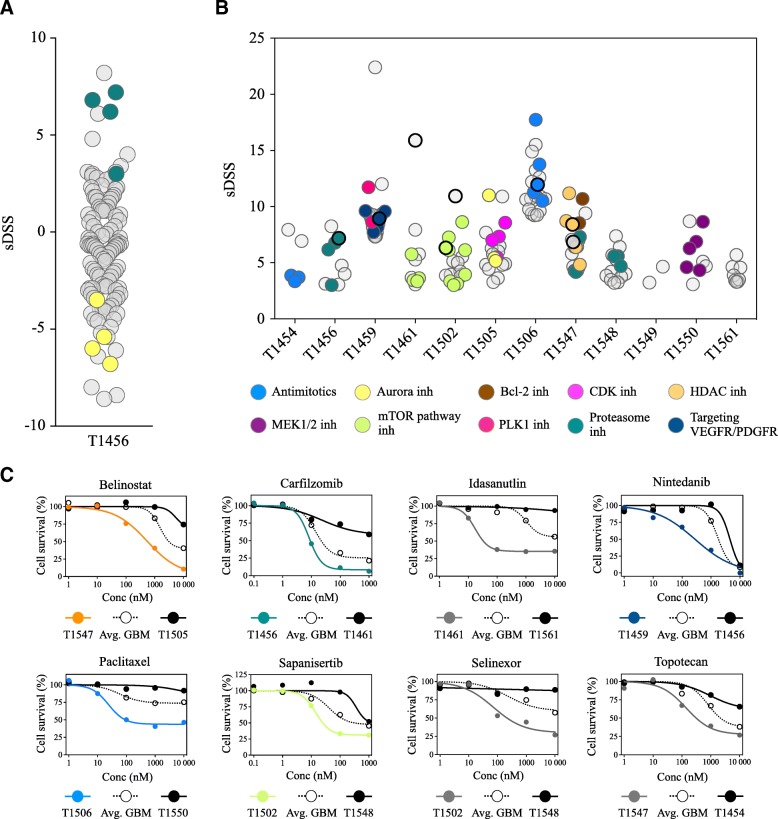
Methods: We cultured 12 patient-derived primary GBMs as tumorspheres and validated tumor stem cell properties by functional assays. Using automated high-throughput screening (HTS), we evaluated sensitivity to 461 anticancer drugs in a collection covering most FDA-approved anticancer drugs and investigational compounds with a broad range of molecular targets. Statistical analyses were performed using one-way ANOVA and Spearman correlation.

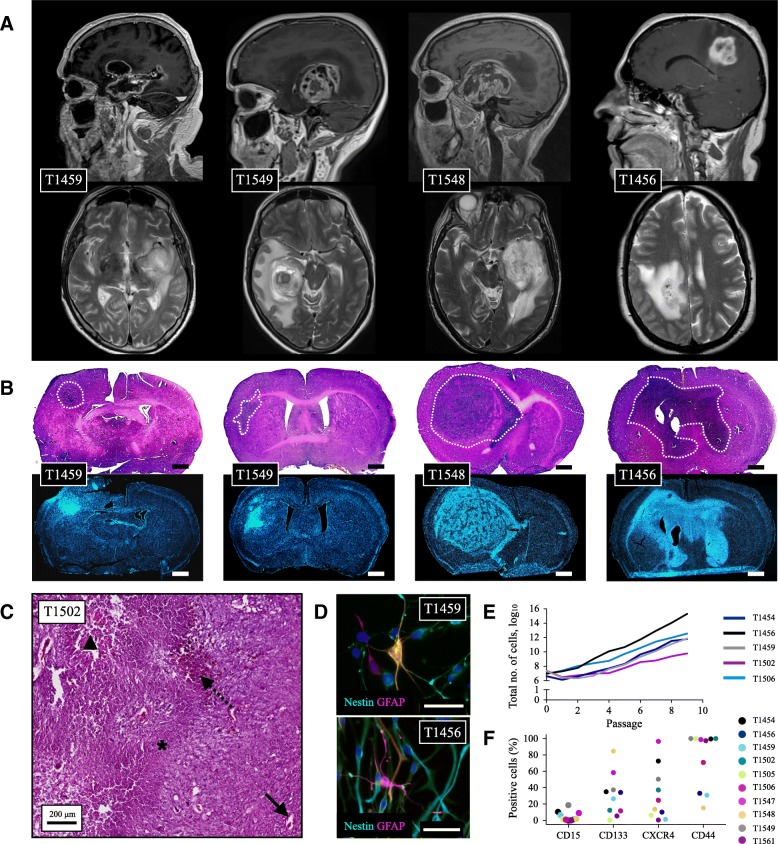
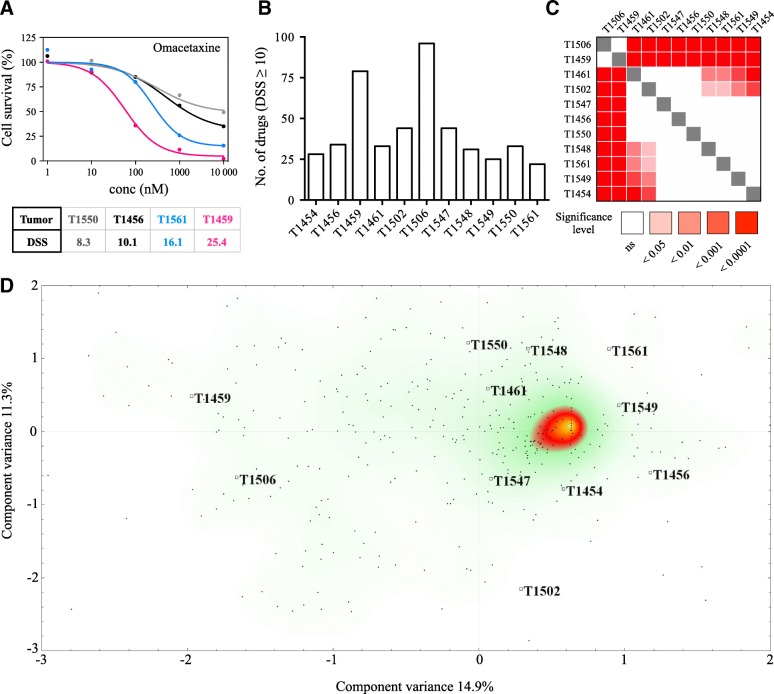
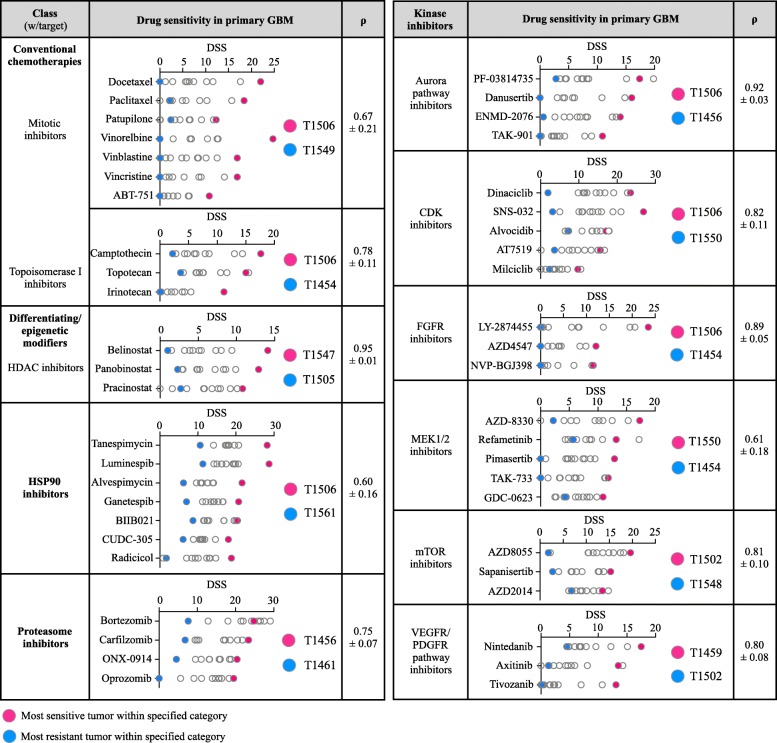
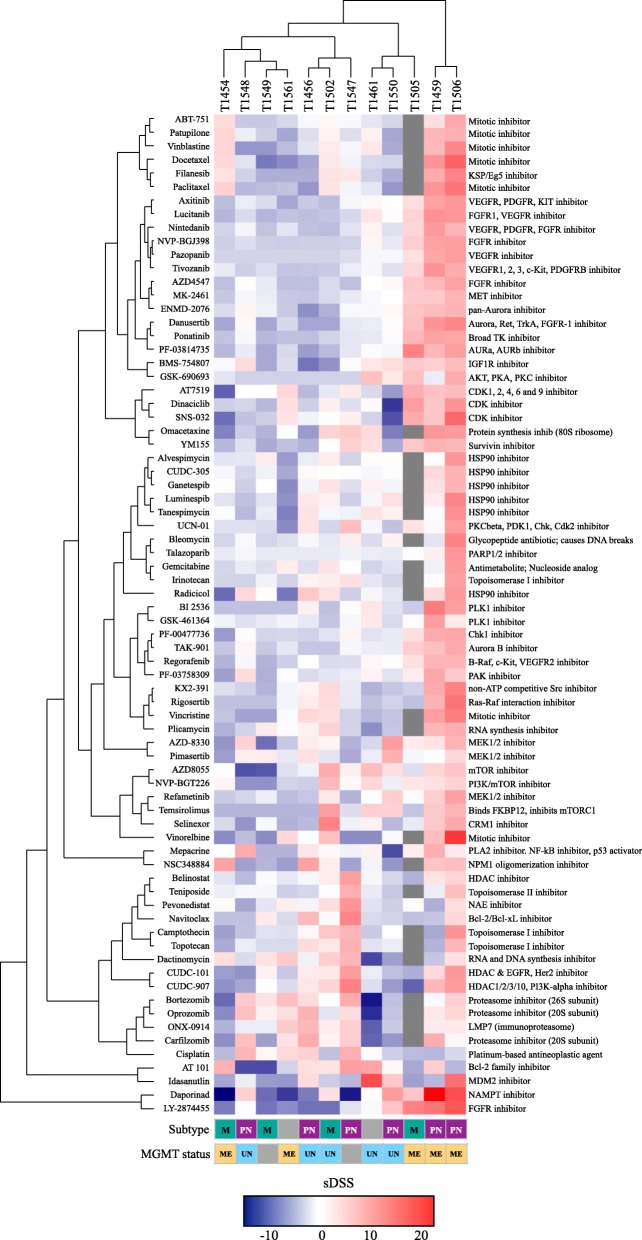
Results: Although tumor stem cell properties were confirmed in GSC cultures, their in vitro and in vivo morphology and behavior displayed considerable tumor-to-tumor variability. Drug screening revealed significant differences in the sensitivity to anticancer drugs (p < 0.0001). The patient-specific vulnerabilities to anticancer drugs displayed a heterogeneous pattern. They represented a variety of mechanistic drug classes, including apoptotic modulators, conventional chemotherapies, and inhibitors of histone deacetylases, heat shock proteins, proteasomes and different kinases. However, the individual GSC cultures displayed high biological consistency in drug sensitivity patterns within a class of drugs. An independent laboratory confirmed individual drug responses.

Conclusions: This study demonstrates that patient-derived and treatment-naïve GSC cultures maintain patient-specific traits and display intertumoral heterogeneity in drug sensitivity to anticancer drugs. The heterogeneity in patient-specific drug responses highlights the difficulty in applying targeted treatment strategies at the population level to GBM patients. However, HTS can be applied to uncover patient-specific drug sensitivities for functional precision medicine.

Keywords: Drug sensitivity; Functional precision medicine; Glioblastoma; Glioblastoma stem cells; High-throughput drug screening; Individualized medicine.


Conflict of interest statement

The authors declare that they have no competing interests.

Figures

Fig. 1
Fig. 1
Characterization of patient-derived GSCs. Magnetic resonance imaging of four GBMs in the study cohort (a) and the corresponding xenografts (b) demonstrating that GSC cultures established from a heterogeneous GBM population display culture-to-culture heterogeneity in their in vivo formation characteristics. Images in (b) are stained with Hematoxylin & Eosin (h&e) in the upper image and Hoechst 33258 in the lower image. Tumor borders are macro-anatomically delineated. Scale bar 1 mm. (c) All histopathological features of glioblastoma were identified, including pathological angiogenesis (whole arrow), intratumoral hemorrhages (dotted arrow), tumor necrosis (triangle), pseudopalisading (asterisk) and nuclear atypia with aberrant mitoses. All tumors were xenografted to ≥2 mice. (d) Upon differentiation, the cells displayed a more mature morphology and stained positive for nestin and GFAP, however the individual GSC culture displayed intertumoral variability in their differentiation morphology. Scale bar 50 μm. (e) The cultures displayed variability in their capacity for total cell yield following serial passages, and (f) intertumoral heterogeneity in expression of stem cell markers (f). Expression of stem cell markers are data generated from n = 1 experiments in the individual cultures
Fig. 2
Fig. 2
GSC sensitivity to anticancer drugs. (a) Presentation of four drug responses from the DSRT to the FDA-approved protein synthesis inhibitor omacetaxine. The dose-response curves and DSS demonstrate a drug response below the threshold defined as moderate activity (DSS ≥10) and three other responses with increasing efficacy from moderate to very strong. (b) Number of drugs from the DSRT in each GSC culture with a DSS ≥10. (c) Significance table of the distribution of the overall drug sensitivity to the drug collection (n = 461 drugs) in the primary GSC cultures. Using a non-parametric one-way ANOVA of ranks corrected for multiple comparisons, a significant difference was observed in the overall drug sensitivity (p < 0.0001). (d) Correspondence analysis of all drug responses displays a clear separation of the two most sensitive cultures along the first component variance (14.9%), whereas no identified pattern explained the spread of the cultures along the second component variance (11.3%). Each dot in the scatter plot represents individual drugs (rows), while individual tumors are highlighted (columns)
Fig. 3
Fig. 3
Drug sensitivity in primary GSCs across different drug classes and molecular targets. The figure displays drug class, the drug sensitivity in GSC cultures, and average (± SD) Spearman’s coefficient (ρ) from correlation matrices for drug categories that were represented with ≥3 drugs for the specific molecular target (n = 47 drugs in the figure, all drug sensitivity data in Additional file 3). Correlation matrices demonstrated that the sensitivity to a drug within a category was strongly associated with sensitivity to all other drugs within that drug category, demonstrating biological consistency and individual uniqueness in GSC cultures. Highlighted in red and blue are the tumors found with the highest and lowest sensitivity within the specified category, respectively
Fig. 4
Fig. 4
Unsupervised hierarchical clustering of drug sensitivity patterns in primary GBM and relation to subtype and MGMT status. Heat map and unsupervised hierarchical clustering of patient-specific drug responses (sDSS) with Euclidian distance (cultures and drugs). The heat map is filtered by DSS ≥10 and sDSS ≥ or ≤ 6.5 (n = 74 drugs). The two most sensitive cultures clustered separately and were both of a proneural subtype, with a methylated MGMT promoter. The four least sensitive cultures grouped together in the other major taxonomy; however, among the moderate and least sensitive cultures, no clear pattern was observed in the subtype classification or methylation status of the parent tumor. Even in the cultures clustering together, individual differences in sensitivities to different mechanistic classes of drugs were found (e.g., sensitivity to topoisomerase I inhibitors in T1459 compared to that in T1506, sensitivity to CDK-inhibitors in T1549 compared to that in T1561, sensitivity to mTOR-pathway inhibitors in T1456 compared to that in T1502, and sensitivity to MEK1/2 inhibitors in T1461 compared to that in T1550). Subtype; M: Mesenchymal, PN: proneural, gray box: not available data. MGMT promoter status: ME: Methylated MGMT promoter, UN: Unmethylated MGMT promoter, gray box: not available data
Fig. 5
Fig. 5
Heterogeneity in patient-specific drug responses in treatment-naïve GSCs. (a) Dot plot of the distribution of the patient-specific responses (sDSS) in T1456 to all drugs with DSS ≥10 in any GSC culture displays the enrichment of proteasome inhibitor (green) clustering with increased culture specificity and the insensitivity to aurora pathway inhibitors (yellow). (b) Dot plot displaying the distribution of the drug categories clustering with the highest patient-selectivity in individual GSC cultures. Drugs are filtered by DSS ≥10 and sDSS ≥3, and drug classes are filtered by O/E ≥ 3 for the individual culture. Classes of drugs enriched in individual cultures are highlighted and display the extensive intertumoral heterogeneity in patient-specific vulnerabilities to anticancer drugs. In cultures T1459, T1506 and T1547, the top 20 selective drug responses are presented. Of the drugs with DSS ≥10, three drugs singly target HDAC, whereas two drugs (CUDC-907 and CUDC-101) have dual targets by targeting HDAC along with PI3K or EGFR/Her2, respectively. In T1547, all five drugs that singly or as a dual target inhibit HDAC were found to have the highest patient selectivity and were highlighted within the category of HDAC inhibitors. For the PLK1 inhibitors and bcl-2 inhibitors, O/E was < 3 as only 2 drugs were represented in the drug collection; however, these drugs are highlighted as they displayed unique selectivity in T1459 and T1547, respectively. (c) Dose-response curves of selected drug responses displaying the most sensitive tumor (colored line, drug response is highlighted with enhanced rim in dot plot in B) and the least sensitive tumor (black line) compared to the average response in GBM (dashed line). All drugs have (i) been tested in clinical trials of GBM (nintedanib, paclitaxel, topotecan), (ii) are currently in clinical trials of GBM (belinostat (NCT02137759), sapanisertib (NCT02142803), and selinexor (NCT01986348), clinicaltrials.gov) or (iii) represent drugs within a class that are being investigated in GBM (carfilzomib; proteasome inhibitors, idasanutlin; mdm2 inhibitors, clinicaltrials.gov). Both insensitive and highly sensitive cultures are found in response to each drug

Similar articles

Cited by

References

    1. Rønning PA, Helseth E, Meling TR, Johannesen TB. A population-based study on the effect of temozolomide in the treatment of glioblastoma multiforme. Neuro-Oncology. 2012;14:1178–1184. doi: 10.1093/neuonc/nos153. - DOI - PMC - PubMed
    1. Touat M, Idbaih A, Sanson M, Ligon KL. Glioblastoma targeted therapy: updated approaches from recent biological insights. Ann Oncol. 2017;28:1457–1472. doi: 10.1093/annonc/mdx106. - DOI - PMC - PubMed
    1. Brennan CW, Verhaak RGW, McKenna A, Campos B, Noushmehr H, Salama SR, et al. The somatic genomic landscape of glioblastoma. Cell. 2013;155:462–477. doi: 10.1016/j.cell.2013.09.034. - DOI - PMC - PubMed
    1. Verhaak RGW, Hoadley KA, Purdom E, Wang V, Qi Y, Wilkerson MD, et al. Integrated genomic analysis identifies clinically relevant subtypes of glioblastoma characterized by abnormalities in PDGFRA, IDH1, EGFR, and NF1. Cancer Cell. 2010;17:98–110. doi: 10.1016/j.ccr.2009.12.020. - DOI - PMC - PubMed
    1. Sottoriva A, Spiteri I, Piccirillo SGM, Touloumis A, Collins VP, Marioni JC, et al. Intratumor heterogeneity in human glioblastoma reflects cancer evolutionary dynamics. Proc Natl Acad Sci U S A. 2013;110:4009–4014. doi: 10.1073/pnas.1219747110. - DOI - PMC - PubMed

MeSH terms

Substances