An official website of the United States government
The .gov means it’s official.
Federal government websites often end in .gov or .mil. Before
sharing sensitive information, make sure you’re on a federal
government site.
The site is secure.
The https:// ensures that you are connecting to the
official website and that any information you provide is encrypted
and transmitted securely.
1 Center for Cellular and Molecular Therapeutics, Children's Hospital of Philadelphia, Philadelphia, Pennsylvania 19104, USA.
2 Department of Genetics, Perelman School of Medicine, University of Pennsylvania, Philadelphia, Pennsylvania 19104, USA.
3 Department of Pathology and Laboratory Medicine, University of Pennsylvania, Philadelphia, Pennsylvania 19104, USA.
4 Institute for Immunology, Perelman School of Medicine, University of Pennsylvania, Philadelphia, Pennsylvania 19104, USA.
5 Division of Protective Immunity, Department of Pathology and Laboratory Medicine, Children's Hospital of Philadelphia, University of Pennsylvania, Philadelphia, Pennsylvania 19104, USA.
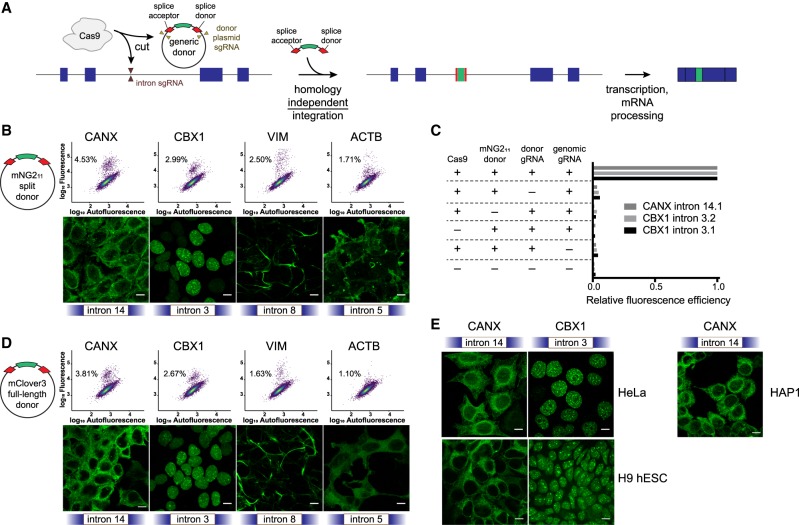
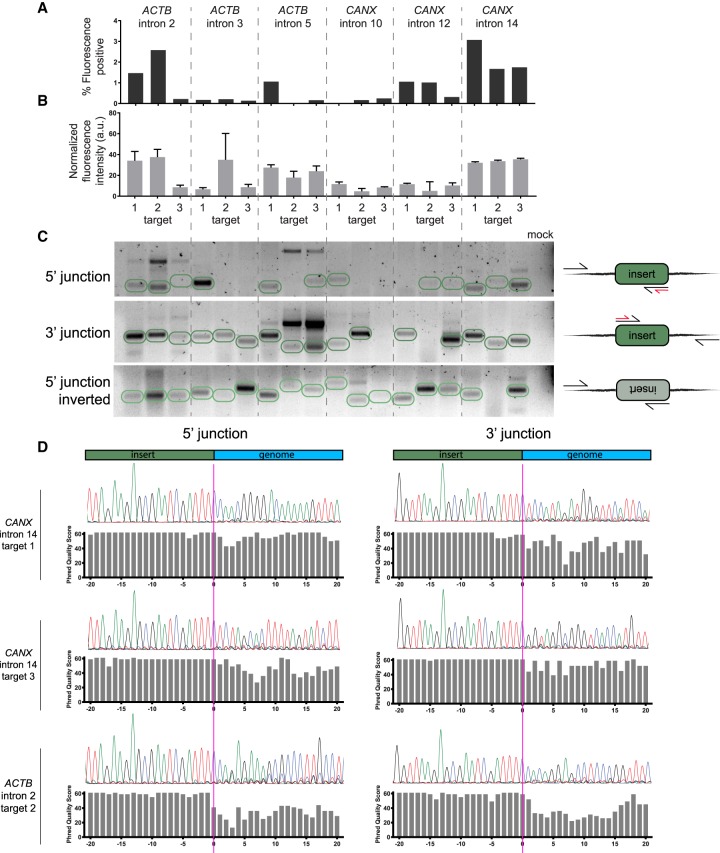
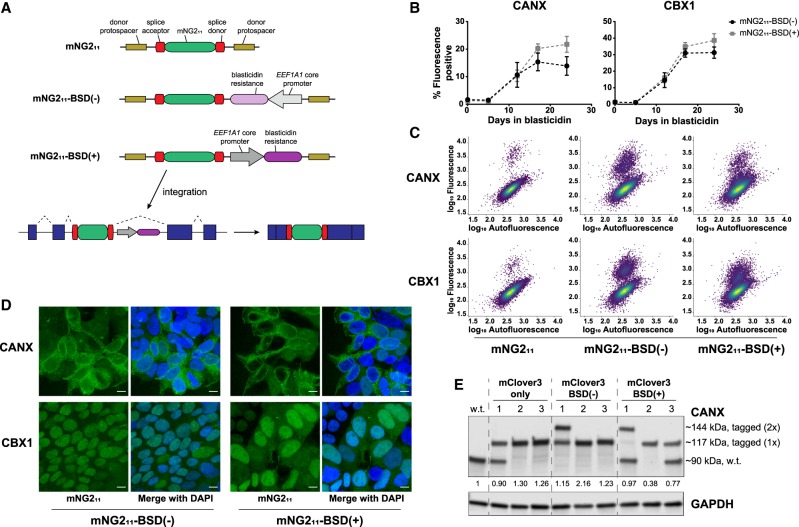
Genome editing tools have simplified the generation of knock-in gene fusions, yet the prevalent use of gene-specific homology-directed repair (HDR) templates still hinders scalability. Consequently, realization of large-scale gene tagging requires further development of approaches to generate knock-in protein fusions via generic donors that do not require locus-specific homology sequences. Here, we combine intron-based protein trapping with homology-independent repair-based integration of a generic donor and demonstrate precise, scalable, and efficient gene tagging. Because editing is performed in introns using a synthetic exon, this approach tolerates mutations in the unedited allele, indels at the integration site, and the addition of resistance genes that do not disrupt the target gene coding sequence, resulting in easy and flexible gene tagging.
Homology-independent generic intron tagging enables efficient and easy generation of endogenous fusions. ( …
Figure 1.
Homology-independent generic intron tagging enables efficient and easy generation of endogenous fusions. (A) Illustration of the tagging approach: Double-strand breaks are generated in the intron and donor resulting in the addition of a synthetic exon and fusion of the tag to the coding sequence. (B) Using a small donor composed of the mNG211 epitope flanked by splice acceptor and donor sites results in efficient tagging of CANX, CBX1, VIM, and ACTB at the indicated introns (all sgRNA “target 1”), as observed by flow cytometry (upper panels, colored by density) and by confocal microscopy (lower panels). Percentages in the dot plots represent the green population as a subset of the total. (C) All transfection mix components are required for tagging of CANX intron 14, sgRNA target 1 (14.1), and of CBX1 intron 3, targets 1 and 2 (3.1 and 3.2). The table indicates which component was removed, and bar plots represent the relative percentage of fluorescence-positive cells compared to the full mix. (D) Tagging using a full-length mClover3 fluorophore as a donor. (E) Tagging of CANX and CBX1 in HeLa cells, H9 human embryonic stem cells (hESC), and HAP1 cells. All images are maximum projections of Z-stacks, and scale bars correspond to 10 µm.
Figure 2.
Successful tagging is mostly determined…
Figure 2.
Successful tagging is mostly determined by the choice of intron. ( A )…
Figure 2.
Successful tagging is mostly determined by the choice of intron. (A) Tagging with mNG211 across introns in ACTB and CANX. Bar plots represent the percent of fluorescence-positive cells for each sgRNA position. (B) Expression mean and standard error for positive cells in each location. Sample sizes are proportional to the bar plots in A. (C) Gel image showing the amplification of donor-to-genomic DNA junctions, as illustrated in the right-hand diagrams. Expected band sizes for insertion of a single copy of donor are circled in green. In the diagrams, black arrows represent primer sites for amplification and red arrows represent primer sites for sequencing in D. The last lane corresponds to a PCR reaction with primers for CANX intron 14, target 1, but without a template. (D) Sanger sequencing of donor-to-genomic DNA junctions shows dephasing at the donor and genomic DNA junction, which indicates indels at the integration site.
Figure 3.
A modified donor allows for…
Figure 3.
A modified donor allows for easy selection of tagged cells. ( A )…
Figure 3.
A modified donor allows for easy selection of tagged cells. (A) Schematic of donor constructs without and with a blasticidin resistance (BSD) gene. (B) Enrichment of fluorescence-positive HEK293 mNG21–10 cells tagged with mNG211-BSD(−/+) at CANX intron 14 and CBX1 intron 3 after blasticidin treatment. Data represent mean ± SEM (n = 3). (C) Dot plots of total HEK293 cell populations tagged with mNG211 or with mNG211-BSD(−/+) and selected for 12 d. Plots are colored by density. (D) Confocal microscopy of total cell populations as in C. Images are maximum projections of Z-stacks, and scale bars correspond to 10 µm. (E) Western blot of clonal HAP1 lysates tagged with mClover3 only or mClover3-BSD(−/+) at CANX intron 14, target 1. The values below the anti-CANX blot indicate total levels of the major CANX band (tagged and untagged) relative to levels in wild-type (w.t.) cells.
Bürckstümmer T, Banning C, Hainzl P, Schobesberger R, Kerzendorfer C, Pauler FM, Chen D, Them N, Schischlik F, Rebsamen M, et al. 2013. A reversible gene trap collection empowers haploid genetics in human cells. Nat Methods 10: 965–971. 10.1038/nmeth.2609
-
DOI
-
PMC
-
PubMed
Buszczak M, Paterno S, Lighthouse D, Bachman J, Planck J, Owen S, Skora AD, Nystul TG, Ohlstein B, Allen A, et al. 2007. The Carnegie protein trap library: a versatile tool for Drosophila developmental studies. Genetics 175: 1505–1531. 10.1534/genetics.106.065961
-
DOI
-
PMC
-
PubMed
Cabantous S, Terwilliger TC, Waldo GS. 2005. Protein tagging and detection with engineered self-assembling fragments of green fluorescent protein. Nat Biotechnol 23: 102–107. 10.1038/nbt1044
-
DOI
-
PubMed
Clyne PJ, Brotman JS, Sweeney ST, Davis G. 2003. Green fluorescent protein tagging Drosophila proteins at their native genomic loci with small P elements. Genetics 165: 1433–1441.
-
PMC
-
PubMed
Cohen AA, Geva-Zatorsky N, Eden E, Frenkel-Morgenstern M, Issaeva I, Sigal A, Milo R, Cohen-Saidon C, Liron Y, Kam Z, et al. 2008. Dynamic proteomics of individual cancer cells in response to a drug. Science 322: 1511–1516. 10.1126/science.1160165
-
DOI
-
PubMed