. 2019 Jun 25;10(3):e01137-19.
doi: 10.1128/mBio.01137-19.

Identification of Extracellular DNA-Binding Proteins in the Biofilm Matrix

Affiliations

Identification of Extracellular DNA-Binding Proteins in the Biofilm Matrix

Jeffrey S Kavanaugh et al. mBio. .

Abstract

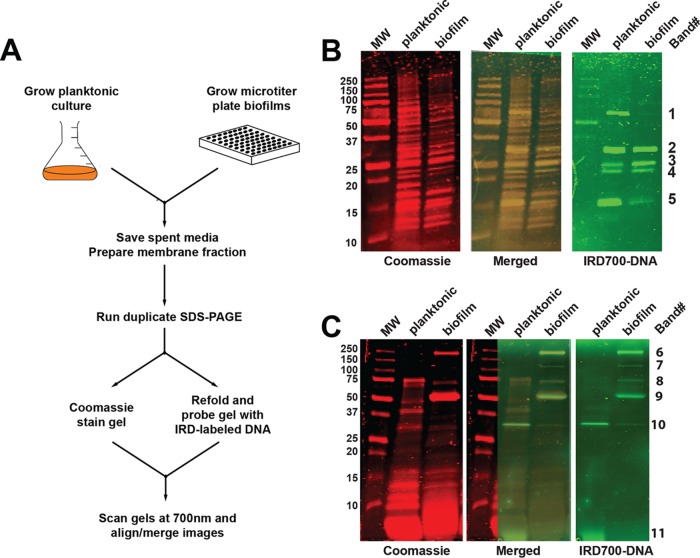
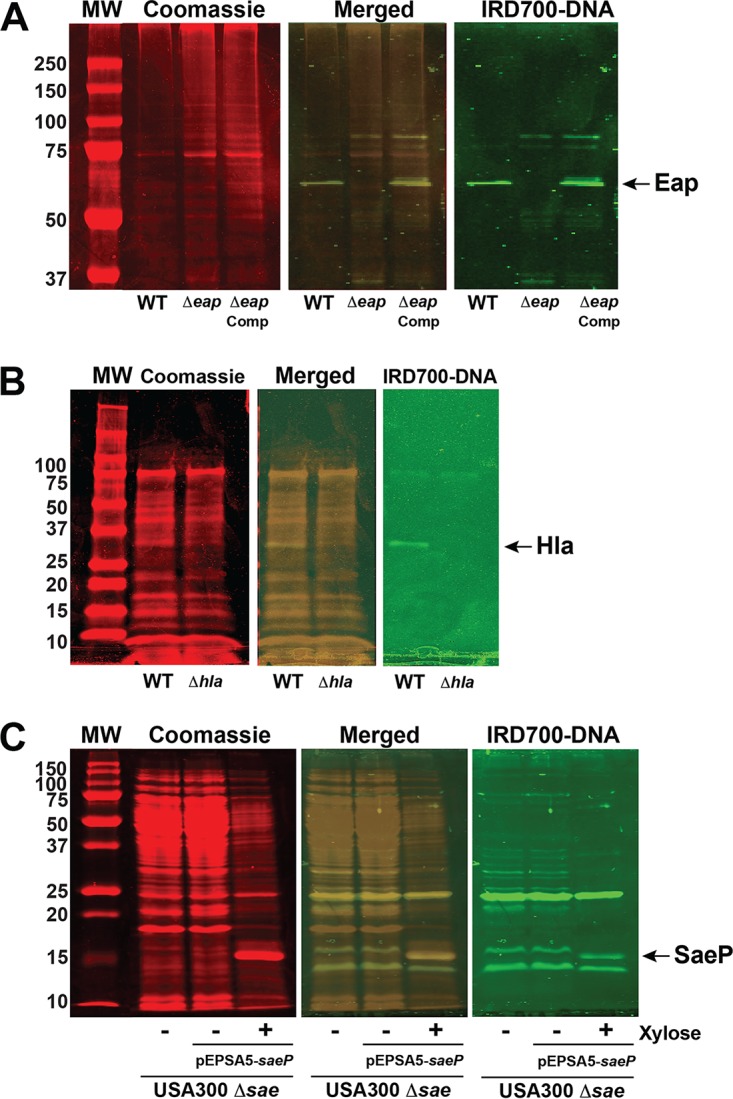
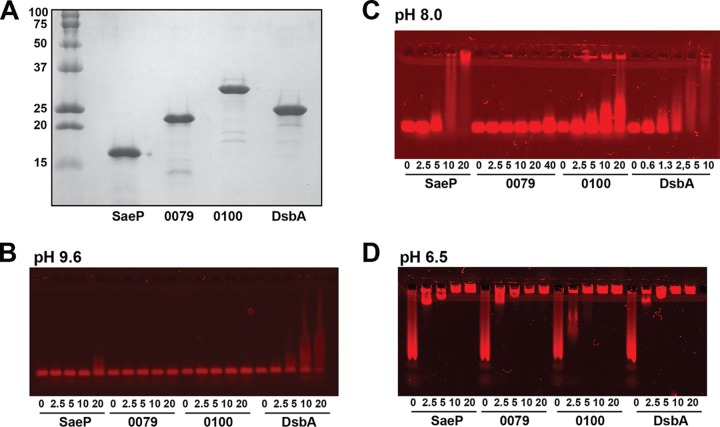
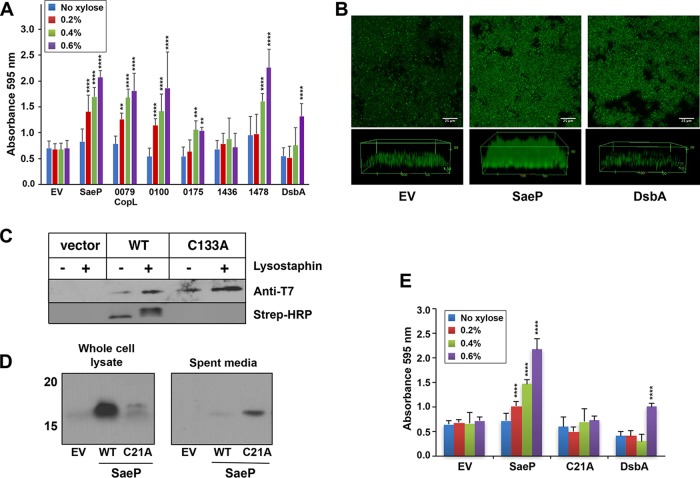
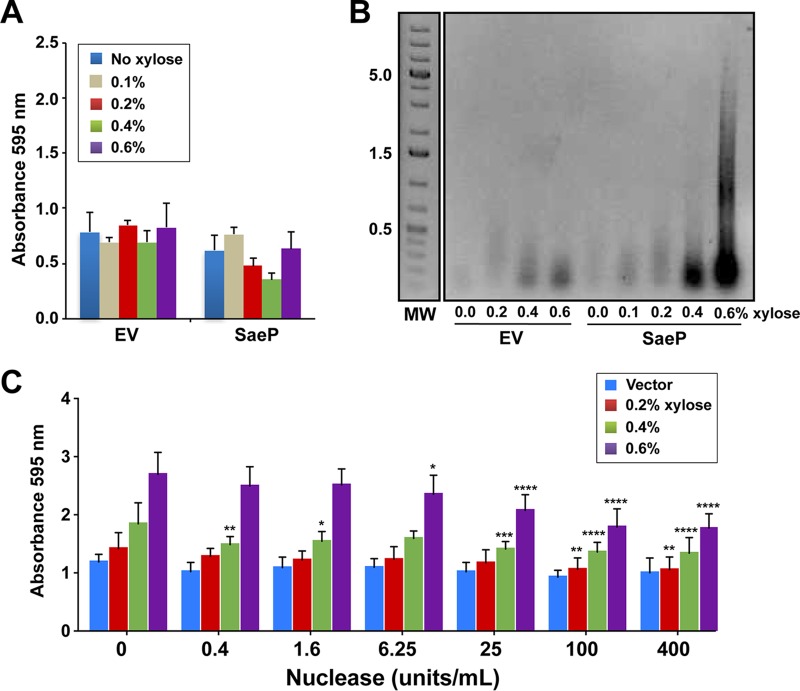
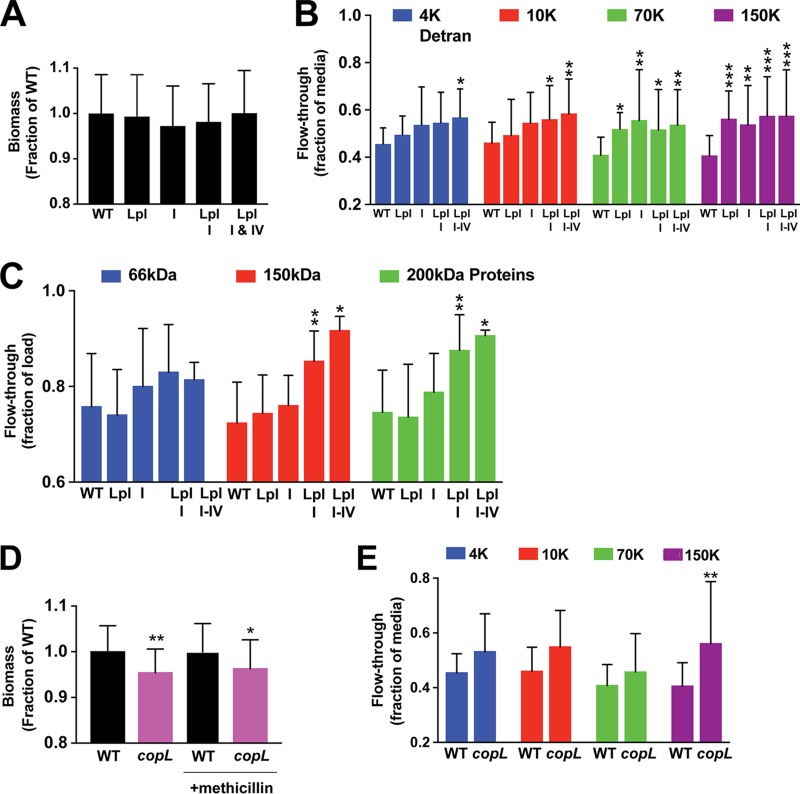
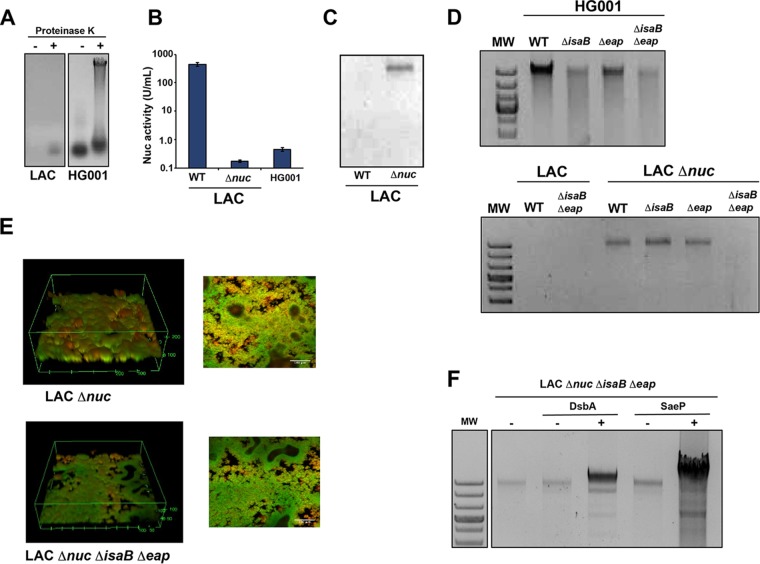
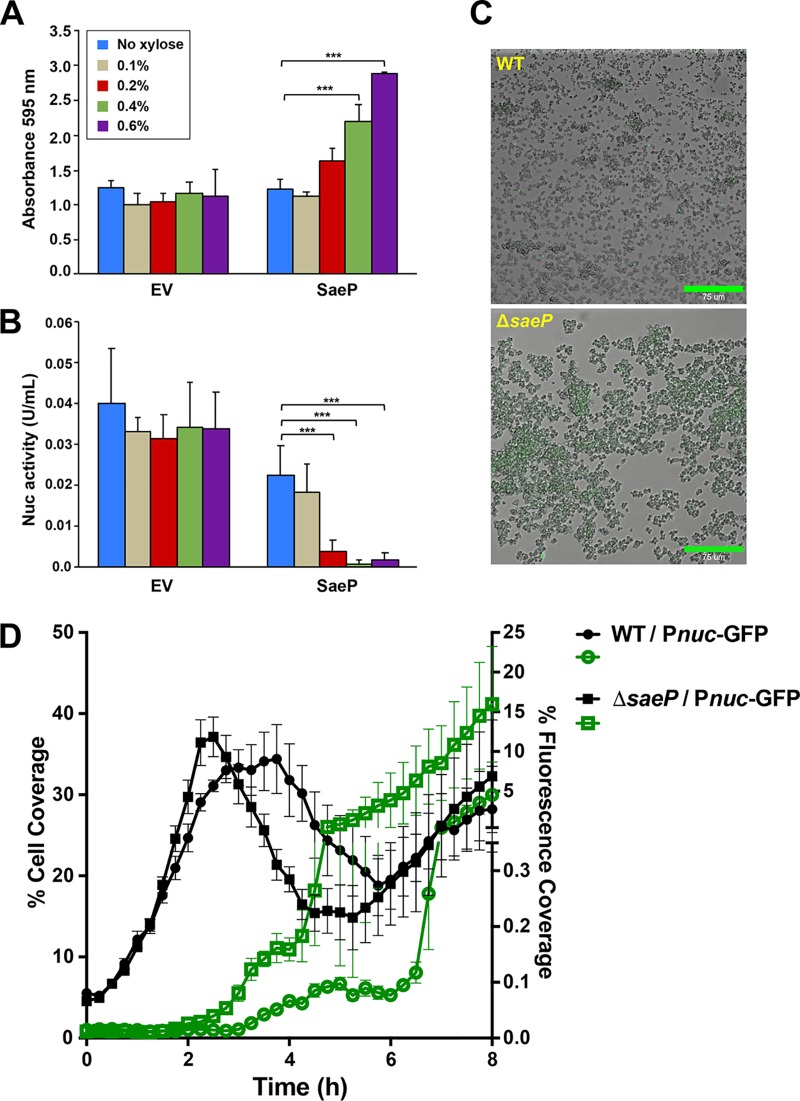
We developed a new approach that couples Southwestern blotting and mass spectrometry to discover proteins that bind extracellular DNA (eDNA) in bacterial biofilms. Using Staphylococcus aureus as a model pathogen, we identified proteins with known DNA-binding activity and uncovered a series of lipoproteins with previously unrecognized DNA-binding activity. We demonstrated that expression of these lipoproteins results in an eDNA-dependent biofilm enhancement. Additionally, we found that while deletion of lipoproteins had a minimal impact on biofilm accumulation, these lipoprotein mutations increased biofilm porosity, suggesting that lipoproteins and their associated interactions contribute to biofilm structure. For one of the lipoproteins, SaeP, we showed that the biofilm phenotype requires the lipoprotein to be anchored to the outside of the cellular membrane, and we further showed that increased SaeP expression correlates with more retention of high-molecular-weight DNA on the bacterial cell surface. SaeP is a known auxiliary protein of the SaeRS system, and we also demonstrated that the levels of SaeP correlate with nuclease production, which can further impact biofilm development. It has been reported that S. aureus biofilms are stabilized by positively charged cytoplasmic proteins that are released into the extracellular environment, where they make favorable electrostatic interactions with the negatively charged cell surface and eDNA. In this work we extend this electrostatic net model to include secreted eDNA-binding proteins and membrane-attached lipoproteins that can function as anchor points between eDNA in the biofilm matrix and the bacterial cell surface.IMPORTANCE Many bacteria are capable of forming biofilms encased in a matrix of self-produced extracellular polymeric substances (EPS) that protects them from chemotherapies and the host defenses. As a result of these inherent resistance mechanisms, bacterial biofilms are extremely difficult to eradicate and are associated with chronic wounds, orthopedic and surgical wound infections, and invasive infections, such as infective endocarditis and osteomyelitis. It is therefore important to understand the nature of the interactions between the bacterial cell surface and EPS that stabilize biofilms. Extracellular DNA (eDNA) has been recognized as an EPS constituent for many bacterial species and has been shown to be important in promoting biofilm formation. Using Staphylococcus aureus biofilms, we show that membrane-attached lipoproteins can interact with the eDNA in the biofilm matrix and promote biofilm formation, which suggests that lipoproteins are potential targets for novel therapies aimed at disrupting bacterial biofilms.

Keywords: MRSA; Southwestern blotting; Staphylococcus aureus; biofilms; eDNA; extracellular DNA; nuclease.


Figures

FIG 1
FIG 1
SW blotting approach. (A) Schematic of the SW blotting experimental design. (B) SW analysis of membrane-associated proteins prepared from planktonic and biofilm bacteria. The left panel, with red bands, is an image of the 700-nm scan of a Coomassie-stained gel, and the far-right panel, with green bands, is an image of the 700-nm scan of a duplicate gel taken after the proteins were renatured and the gel was probed with IRD700-labeled DNA. In the center panel, the IRD700-labeled DNA panel was overlaid on the Coomassie-stained panel. Labels for the MW markers (in kilodaltons) are shown at the far left, and identification band numbers for the bands that were excised and sent for MS analysis are shown at the far right. (C) SW analysis of soluble proteins in medium from planktonic cultures and biofilms.
FIG 2
FIG 2
Confirmation of SW band identifications. (A) SW analysis of membranes prepared from planktonic cultures of the Newman WT, Δeap mutant, and complemented (Comp) Δeap mutant strains. The position of the Eap band is indicated by the arrow at the far right. (B) SW analysis of medium from planktonic cultures of the LAC WT and Δhla mutant strains. The position of the Hla band is indicated by the arrow at the far right. (C) SW analysis of membranes prepared from biofilms of the Δsae mutant of LAC and the Δsae mutant of LAC containing pEPSA5 expressing saeP. When expression of saeP is induced with xylose, a new band (indicated by the arrow at the far right) corresponding to SaeP is evident in both the Coomassie-stained and IRD700-labeled-DNA-probed gel. The numbers to the left of the gels are MW (in kilodaltons).
FIG 3
FIG 3
DNA-binding activity of purified lipoproteins SaeP, 0079 (CopL), 0100, and DsbA. (A) SDS-PAGE of Ni-affinity chromatography-purified His-tagged lipoproteins that were cloned in pET28a and expressed in E. coli. The numbers to the left of the gel are MW (in kilodaltons). (B to D) EMSAs run at pH 9.6 (B), pH 8.0 (C), and pH 6.7 (D), using ethanolamine-Capso, Tris-acetate, and bis-Tris–Aces pKa-matched buffer systems, respectively. For each protein, a serial 2-fold dilution series (20 to 2.5 μM or 40 to 2.5 μM) was combined with a 259-bp, IRD700-labeled DNA probe at a final concentration of 5 nM, and the mixture was incubated for 30 min at room temperature and then electrophoresed on 1% agarose gels that had been cast with the appropriate pKa-matched buffer. Following electrophoresis, gels were scanned using the 700-nm channel on an Odyssey CLx imager (LI-COR, Omaha, NE) and visualized using Image Studio software.
FIG 4
FIG 4
Impact of lipoprotein expression and localization on S. aureus biofilm development. (A) LAC strains were constructed with the pEPSA5 empty vector (EV) or various lipoproteins. Biofilms were grown in 48-well plates in TSB plus 0.4% glucose and xylose at a range of concentrations (0 to 0.6%) to induce protein expression. Error bars are the standard deviation for 12 wells (three experiments with four wells per lipoprotein). Statistics for two-way analysis of variance are P values. **, P ≤ 0.005; ***, P ≤ 0.0005; ****, P ≤ 0.00005. (B) Confocal microscope images of flow cell biofilms for the strain with the empty vector (left), SaeP-expressing strains (center), and DsbA-expressing strains (right). Biofilms were grown for 2.5 days in 2% TSB supplemented with 0.2% glucose, 1 μg/ml of chloramphenicol, and 0.1% xylose. (C) SCAM analysis of native SaeP in strain LAC shows that cysteine residue C133 is modified without lysostaphin pretreatment, indicating that SaeP is located on the cell surface. Protein expression was evaluated by T7 immunoblotting, while cysteine labeling was analyzed using Strep-HRP. (D) Western blot analyses performed with whole-cell lysates and bacterial supernatants of LAC expressing WT SaeP-T7 or the C21A mutant of SaeP-T7 show that the WT protein is associated with cells, whereas the C21A mutant is found in the supernatant, confirming that the C21A mutant is no longer a lipoprotein. (E) Biofilm assays, performed as described in the legend to panel A, of WT and C21A mutation-expressing strains (compared to strains expressing DsbA as a control) show that the mutant no longer supports enhanced biofilm accumulation. Error bars are the standard deviation for three replicate wells. Statistics for two-way analysis of variance are P values. ****, P ≤ 0.00005.
FIG 5
FIG 5
SaeP-induced biofilm enhancement is dependent on eDNA. (A) SaeP was expressed from pEPSA5 in an atlA mutant under biofilm-forming conditions using a range of xylose concentrations (0 to 0.6%) to induce protein expression. Error bars are the standard deviation for three replicate wells. (B) SaeP expression results in the accumulation of eDNA in the biofilm matrix. Static biofilms expressing either SaeP or DsbA were grown in TSB supplemented with 0.4% glucose and xylose at the indicated concentrations. eDNA isolated from the biofilm matrix was run on agarose gels. The numbers to the left of the gel are MW (in kilodaltons). (C) Biofilm enhancement of LAC expressing WT SaeP at 0.6% xylose is reduced when purified Nuc is added at time zero. Statistics for two-way analysis of variance are P values. *, P ≤ 0.05; **, P ≤ 0.005; ***, P ≤ 0.0005; ****, P ≤ 0.00005.
FIG 6
FIG 6
Lipoprotein mutants show increased biofilm porosity. (A) Biofilm biomass for Csa knockout mutants measured by crystal violet staining and expressed as a fraction of the WT biomass. Values are averages from either two or three experiments (>45 wells per strain tested). (B) Concentrations of different-molecular-weight FITC-dextrans in the flowthrough of filter-grown biofilms (12 wells per experiment). Concentrations are expressed as the fraction of the FITC-dextran concentration in the flowthrough of wells containing sterile medium (i.e., no-biofilm control wells). Statistics for two-way analysis of variance are P values. *, P ≤ 0.05; **, P ≤ 0.005; ***, P ≤ 0.0005. (C) Protein band intensities from SDS-PAGE of the filter-grown biofilm flowthrough, expressed as the fraction of the intensity for the corresponding band in the protein loading solution. Values are the averages from two experiments with >14 wells per strain tested (except that 3 wells were used for the triple mutant). Statistics for two-way analysis of variance are P values. *, P ≤ 0.05; **, P ≤ 0.005. (D) Biofilm biomass for the WT and CopL mutant measured by crystal violet staining and expressed as a fraction of the WT biomass. Values are averages from two experiments with >40 wells per strain tested. Statistics for one-way analysis of variance are P values. *, P ≤ 0.05; **, P ≤ 0.005. (E) Concentrations of different-molecular-weight FITC-dextrans in the flowthrough of filter-grown biofilms. Concentrations are expressed as the fraction of the FITC-dextran concentration in the flowthrough of wells containing sterile medium. Values are the averages from two experiments with 12 wells per strain per experiment. Statistics for two-way analysis of variance are P values. **, P ≤ 0.005.
FIG 7
FIG 7
Eap and IsaB impact the surface eDNA and biofilm structure. (A) Release of surface eDNA from HG001 and LAC biofilms with and without proteinase K. (B) Nuc activity, measured by FRET assay, in HG001 and LAC WT and nuc mutant strains. (C) Release of surface eDNA from LAC WT and nuc mutant biofilms. (D) Release of surface eDNA from isaB, eap, and double mutants in HG001 and LAC backgrounds. (E) Confocal microscopy images of the LAC nuc mutant versus the nuc isaB eap triple mutant. (F) Release of surface eDNA from the LAC nuc isaB eap triple mutant expressing DsbA or SaeP.
FIG 8
FIG 8
SaeP levels impact Nuc expression. (A) SaeP was overexpressed in LAC under biofilm-forming conditions, and the adherent biomass was quantified using crystal violet. Error bars are the standard deviation for three replicate wells. (B) Biofilm supernatants were filter sterilized and tested for nuclease activity using a Nuc FRET assay. Error bars are the standard deviation for four replicate assays. P values were determined by Student’s t test. ***, P ≤ 0.0005. (C) BioFlux images of the WT and saeP mutant with the Pnuc-GFP reporter. (D) Quantification of the cell coverage and fluorescent coverage of the images in panel C.
FIG 9
FIG 9
PrsA bioinformatics. (A) Alignment of S. aureus PrsA (Sa_PrsA) with Bacillus subtilis PrsA (Bs_PrsA) determined with the Clustal Omega program (89) and prepared using the ESPript2.2 program (90), in which identical residues are highlighted in red and similar residues are shown in red text. Secondary structure elements from the B. subtilis X-ray crystal structure (PDB accession number 4WO7) are indicated above the sequence, and the color bars below the sequences correspond to the subunit colors in panel C, with the NC and parvulin domains of subunit 1 being indicated by teal and dark blue, respectively, and the NC and parvulin domains of subunit 2 being indicated by yellow and orange, respectively. The magenta bar under parvulin domain 1 indicates the amino acid insertion found in S. aureus PrsA. (B) Alignment of S. aureus PrsA with human parvulin protein hPar14 determined with the Clustal Omega program. The amino acid insertion in S. aureus PrsA is indicated by the magenta bar, and the green bars indicate the hPar14 residues whose NMR chemical shifts were sensitive to the addition of DNA. (C) Image, generated with PyMOL (The PyMOL molecular graphics system, version 2.1; Schrödinger, LLC), showing the molecular surface of the B. subtilis PrsA crystal structure (PDB accession number 4WO7), with NC domain 1 shown in teal, parvulin domain 1 shown in dark blue, NC domain 2 shown in yellow, and parvulin domain 2 shown in orange. The solution NMR structure of the S. aureus parvulin domain (PDB accession number 2JZV) is superimposed on the parvulin domain 2 of B. subtilis, and the extra molecular surface from the amino acid substitution in S. aureus PrsA is shown in magenta. In addition, the molecular surfaces associated with the S. aureus parvulin domain residues corresponding to the human parvulin residues with DNA-sensitive chemical shifts are shown in green. (D) Stereo image depicting the alignment of S. aureus (PDB accession number 2JZV; yellow) and human (PDB accession number 1FJD; teal) parvulin NMR structures, with the amino acid insertion in S. aureus, including the lysine side chains, shown in magenta and the positions of human residues whose chemical shifts are impacted by DNA shown in green.

Similar articles

Cited by

References

    1. James GA, Swogger E, Wolcott R, Pulcini E, Secor P, Sestrich J, Costerton JW, Stewart PS. 2008. Biofilms in chronic wounds. Wound Repair Regen 16:37–44. doi:10.1111/j.1524-475X.2007.00321.x. - DOI - PubMed
    1. Rahim K, Saleha S, Zhu X, Huo L, Basit A, Franco OL. 2017. Bacterial contribution in chronicity of wounds. Microb Ecol 73:710–721. doi:10.1007/s00248-016-0867-9. - DOI - PubMed
    1. Kiedrowski MR, Horswill AR. 2011. New approaches for treating staphylococcal biofilm infections. Ann N Y Acad Sci 1241:104–121. doi:10.1111/j.1749-6632.2011.06281.x. - DOI - PubMed
    1. Bor DH, Woolhandler S, Nardin R, Brusch J, Himmelstein DU. 2013. Infective endocarditis in the U.S., 1998–2009: a nationwide study. PLoS One 8:e60033. doi:10.1371/journal.pone.0060033. - DOI - PMC - PubMed
    1. Cahill TJ, Baddour LM, Habib G, Hoen B, Salaun E, Pettersson GB, Schafers HJ, Prendergast BD. 2017. Challenges in infective endocarditis. J Am Coll Cardiol 69:325–344. doi:10.1016/j.jacc.2016.10.066. - DOI - PubMed

Publication types

MeSH terms

LinkOut - more resources