. 2019 Jun 25;10(1):2780.
doi: 10.1038/s41467-019-10730-y.

Lzts1 controls both neuronal delamination and outer radial glial-like cell generation during mammalian cerebral development

Affiliations

Lzts1 controls both neuronal delamination and outer radial glial-like cell generation during mammalian cerebral development

T Kawaue et al. Nat Commun. .

Abstract

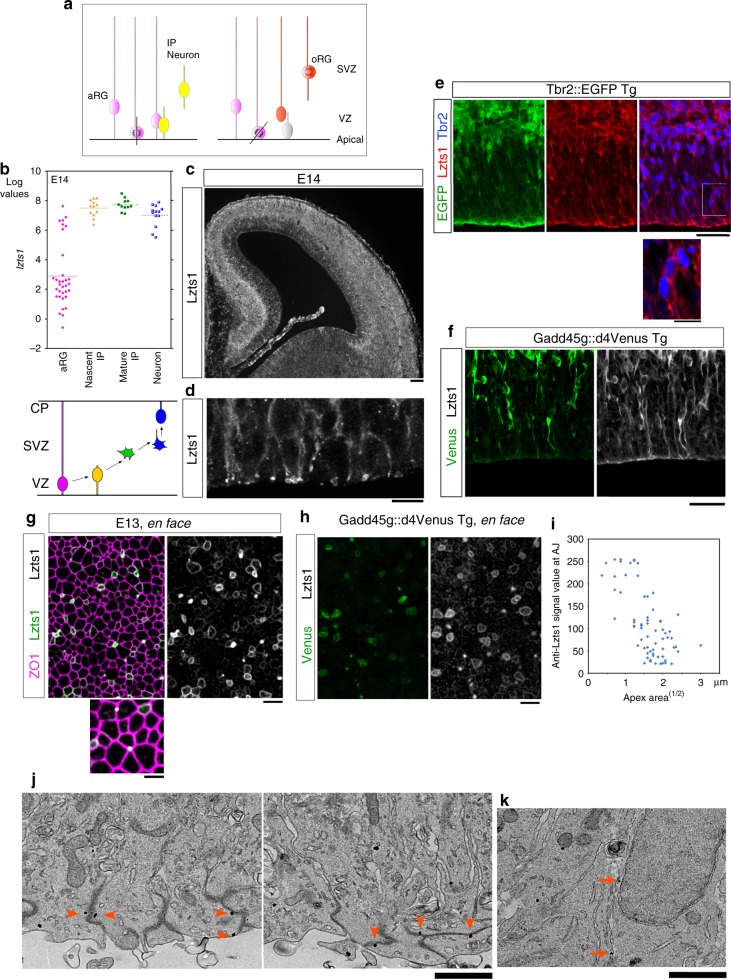
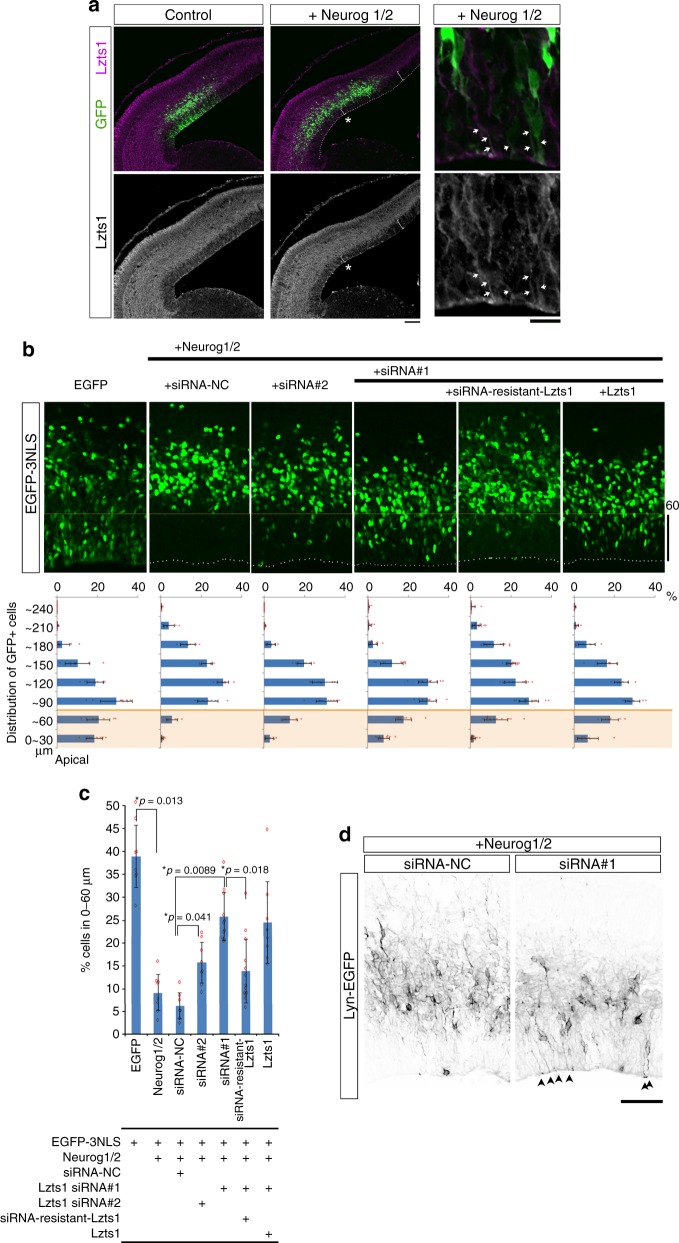
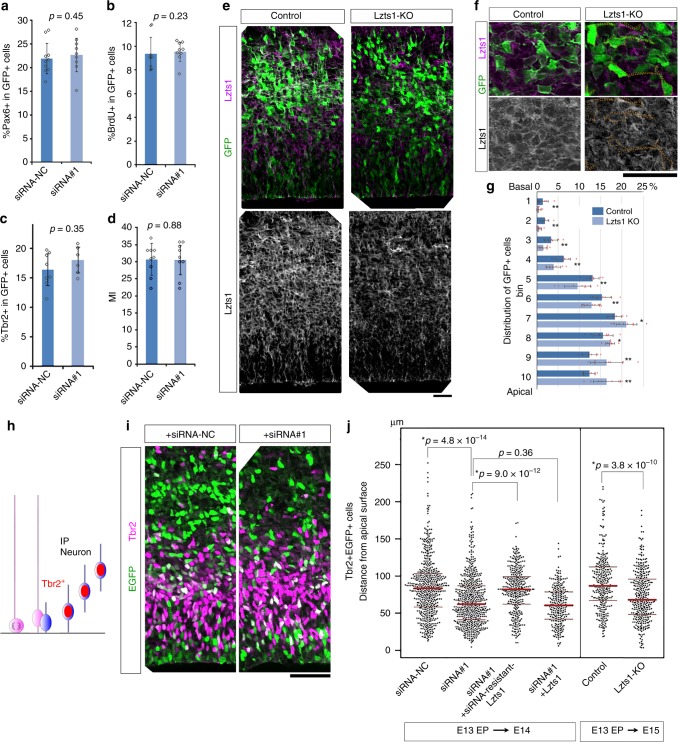
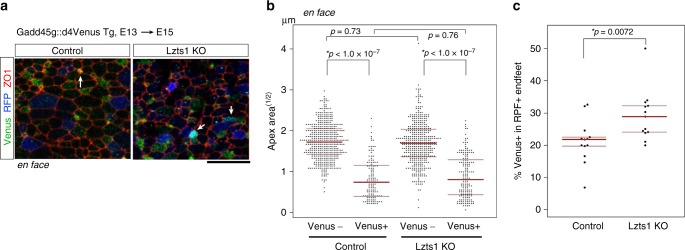
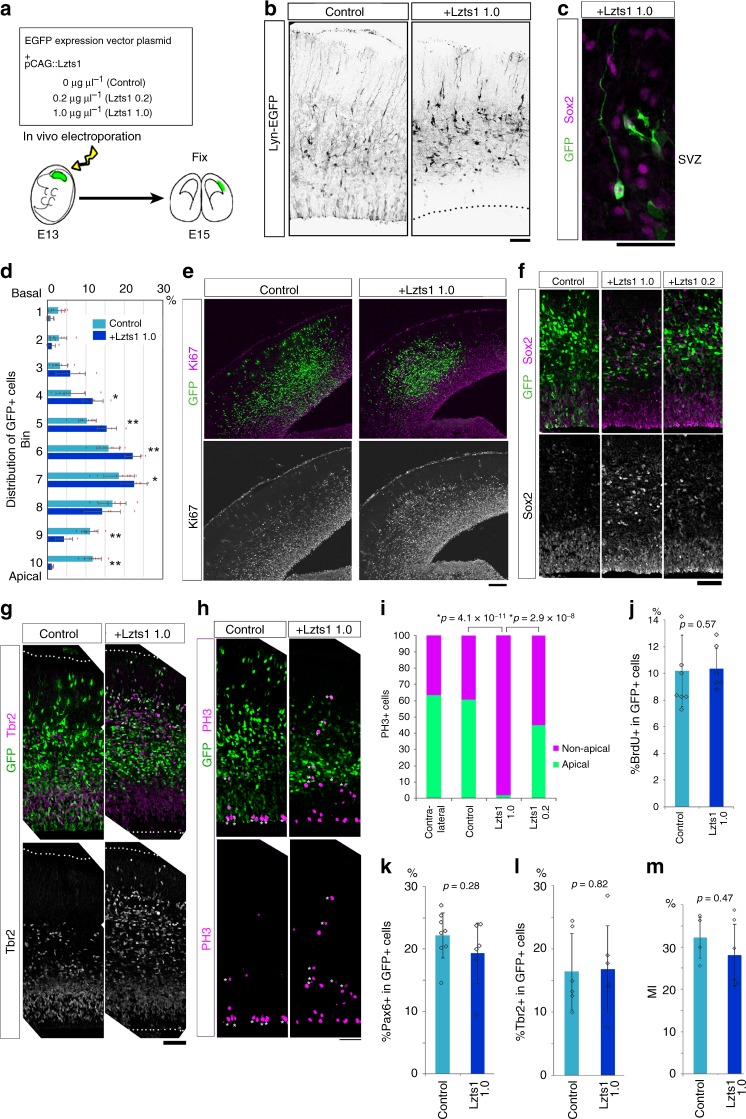
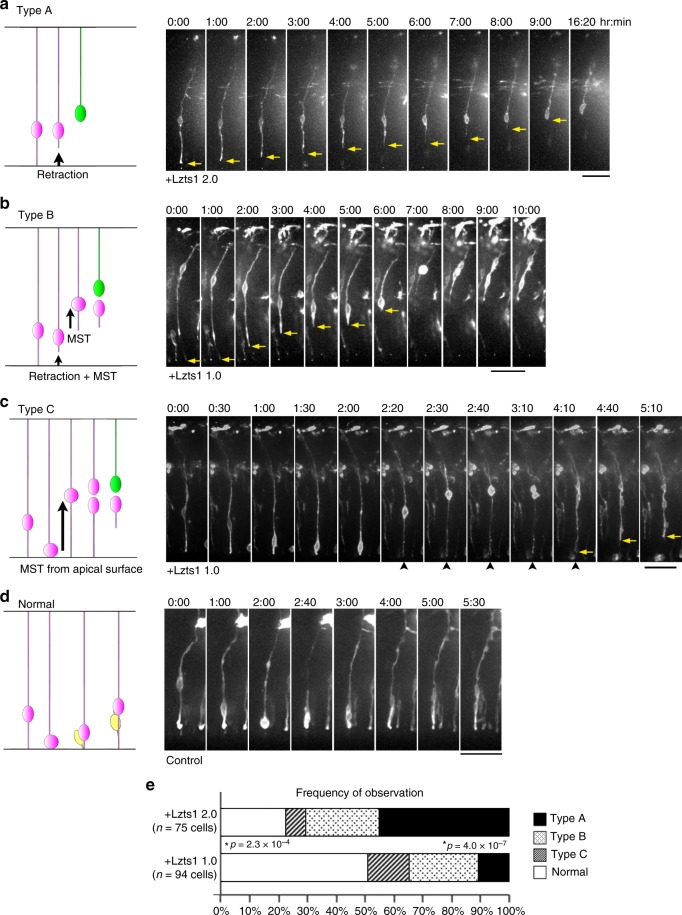
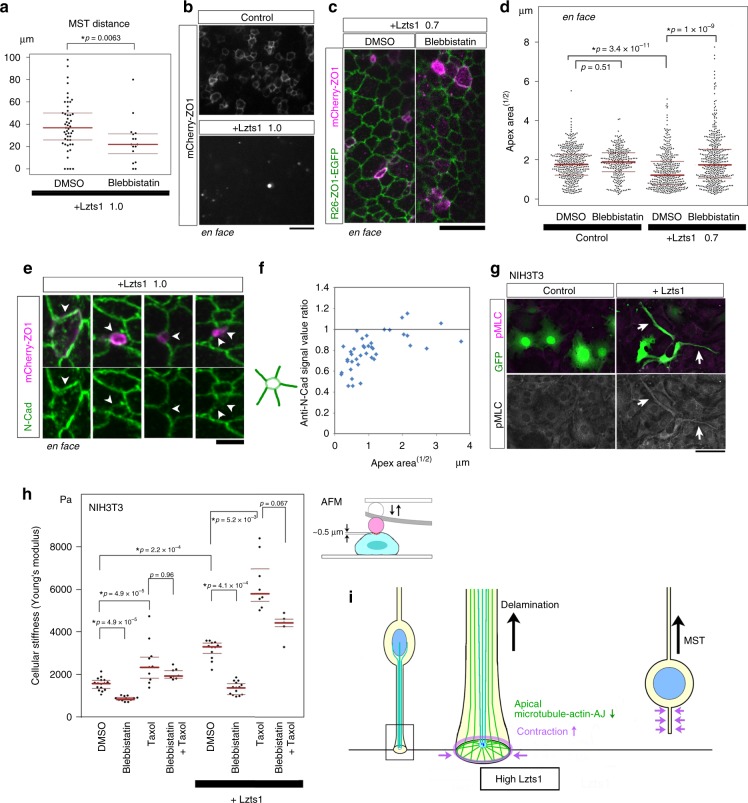
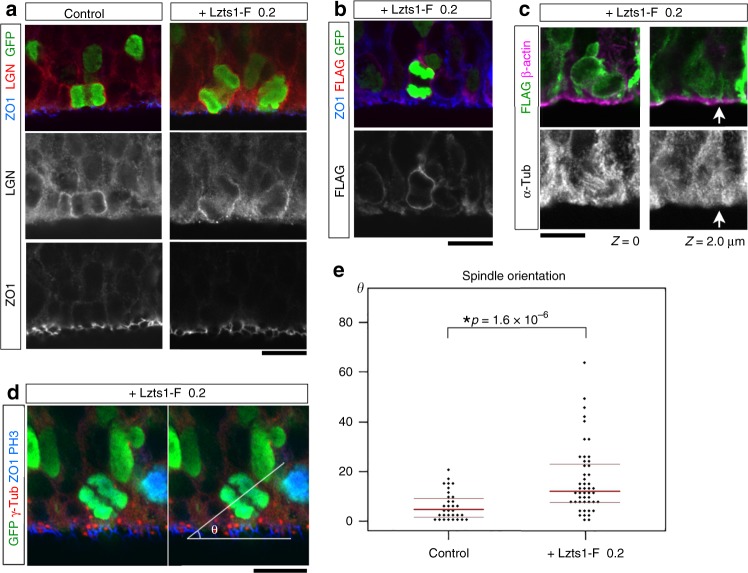
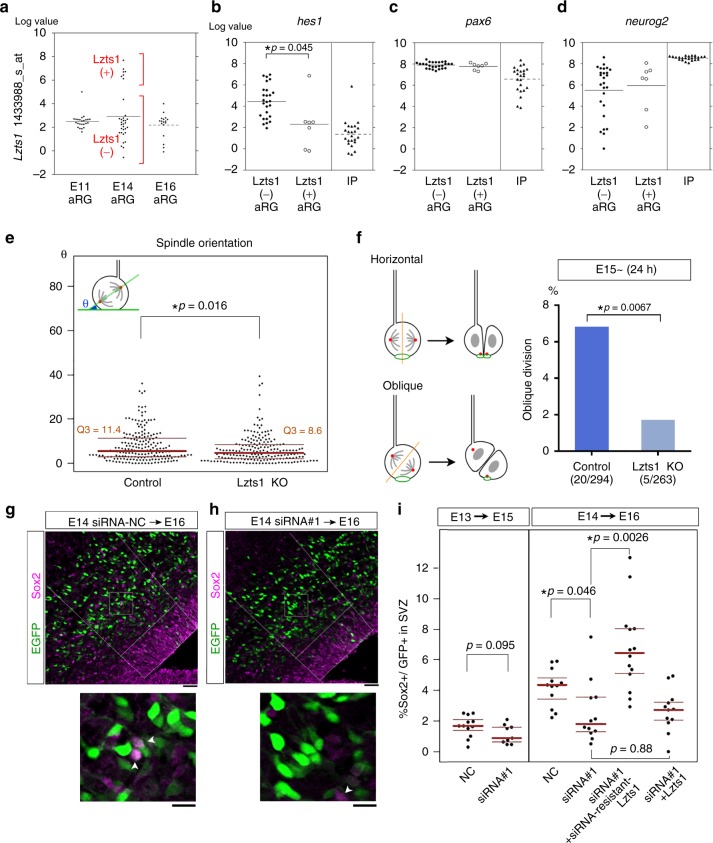
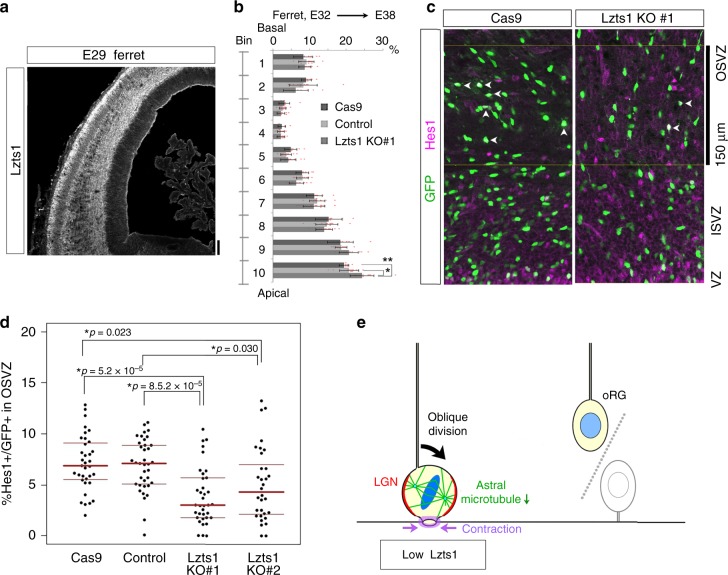
In the developing central nervous system, cell departure from the apical surface is the initial and fundamental step to form the 3D, organized architecture. Both delamination of differentiating cells and repositioning of progenitors to generate outer radial glial cells (oRGs) contribute to mammalian neocortical expansion; however, a comprehensive understanding of their mechanisms is lacking. Here, we demonstrate that Lzts1, a molecule associated with microtubule components, promotes both cell departure events. In neuronally committed cells, Lzts1 functions in apical delamination by altering apical junctional organization. In apical RGs (aRGs), Lzts1 expression is variable, depending on Hes1 expression levels. According to its differential levels, Lzts1 induces diverse RG behaviors: planar division, oblique divisions of aRGs that generate oRGs, and their mitotic somal translocation. Loss-of-function of lzts1 impairs all these cell departure processes. Thus, Lzts1 functions as a master modulator of cellular dynamics, contributing to increasing complexity of the cerebral architecture during evolution.


Conflict of interest statement

The authors declare no competing interests.

Figures

Fig. 1
Fig. 1
Lzts1 is expressed at high levels at the AJs of delaminating cells. a Neuronal delamination and oRG generation by oblique aRG division are two different ways for departure from the apical surface. IP, intermediate progenitor cell. b Single-cell transcriptome profiles of E14 cells show increased expression of the lzts1 mRNA during neuronal differentiation. (Affymetrix ID: 1433988_s_at, annotated as C230098O21Rik, a transcript variant of lzts1). c Anti-Lzts1 immunohistochemistry (IHC) of the E14 mouse brain (see also Supplementary Figure 1). d Magnified view of the E13 brain section stained with the anti-Lzts1 antibody showing both dot-like and ring-like expression of Lzts1 at high levels in some apical endfeet. Z-projection images of 8-μm thick slices. e and f Lzts1 IHC of the E14 dorsal forebrain of Tbr2::EGFP Tg mice, with magnified view of Tbr2+Lzts1+ cells in the VZ e and Gadd45g::d4Venus Tg mice f showing that GFP+, Tbr2+, or Venus+ differentiating cells are Lzts1+. g and h Lzts1 is expressed at high levels at the AJs of the apical endfeet of differentiating cells. En face observations of anti-Lzts1 and anti-ZO1 IHC of the E13 dorsal forebrain g or anti-Lzts1 and anti-GFP IHC of E13 Gadd45g::d4Venus Tg mouse dorsal forebrain h from the apical surface. In the magnified view g, dot-like signals may represent the apical endfeet of cells that had almost completed the delamination from the apical surface. i Anti-Lzts1 signal intensities along the cellular junctions were negatively correlated with the apex (apical) area^(1/2), which is proportional to the planar circumferential length of the AJ ring. j and k Ultrastructural localization of Lzts1 in the E14 dorsolateral cerebrum. Immunoelectron microscopy using an anti-Lzts1 antibody shows that intracellular Lzts1 gold particles were closely located to the electron-dense zone of AJs (j, arrowheads). Particles with an intracellular distribution or located adjacent to the plasma membrane were also observed in a subset of the cells (k, arrows, ~ 100 μm from the apical surface). Bars, 100 μm in c, 10 μm in d, magnified view e, 30 μm in e, f, 5 μm in g, h, and 1 μm in magnified view g, j, k
Fig. 2
Fig. 2
Lzts1 KD perturbs the delamination of neurog1/2-expressing cells. a Lzts1 expression is upregulated throughout neuronal differentiation following the forced co-expression of neurog1 and neurog2. Neurog1/2, and GFP were co-expressed at E13 by in vivo electroporation, and sections were examined after 18 h. Neurog1/2 co-expression expands the apico-basal width of Lzts1+ area and reduces the depth of the VZ (shown by asterisk) compared with that in the non-electroporated region. Magnified view shows that the Neurog1/2-expressing EGFP+ cells are Lzts1+. Arrows indicate the GFP+Lzts1+ apical processes. b and c Neurog1/2-induced migration from the VZ is partially inhibited by Lzts1 KD induced by siRNA#1 (and more moderately by siRNA#2). This phenotype was rescued by the expression of siRNA#1-resistant Lzts1 but not wild-type Lzts1. In vivo electroporation of neurog1/2 and egfp was performed at E13, and brains were examined after 24 h (see also Supplementary Figure 2). siRNA-NC, negative control siRNA. b Distributions of EGFP+ cells. c Percentage of the EGFP+-electroporated cells within the area of 0–60 μm from the apical surface (orange colored region in b) among total EGFP+ cells (Steel–Dwass test, N = 8, 8, 7, 8, 11, 13, and 8 sections from 4, 4, 4, 4, 7, and 4 embryos, respectively). d Cre-mediated Lyn-EGFP (EGFP with a membrane targeting sequence) labeling shows that forced expression of Neurog1/2 causes cells to retract their apical processes, whereas many Lzts1 KD cells retain their processes (arrowheads). In vivo electroporation of neurog1/2, lyn-egfp, and siRNAs was performed at E13, and brains were examined at E14. Bars, 100 μm in a, 10 μm in magnified view a, 60 μm in b, 50 μm in d. Means ± s.d. Source data are provided as a Source Data file
Fig. 3
Fig. 3
Loss-of-function of Lzts1 retards radial migration through differentiation. ad Lzts1-siRNA#1 or a negative control siRNA (siRNA-NC) was in vivo electroporated at E13, and sections of the E14 c or E15 a, b, d brain were examined using IHC with anti-Pax6 a, anti-BrdU (30-min BrdU pulse labeling) b, anti-Tbr2 c, anti-Ki67 and anti-BrdU d antibodies. The mitotic index (MI) d indicates the percentage of Ki67+ cells among BrdU+ GFP+ cells that received BrdU 20 h before fixation. Means ± s.d., a N = 9, 9; b N = 10, 9; d N = 8, 6; d N = 9, nine sections from three embryos per experiment, Wilcoxon rank sum test. e and f CRISPR/Cas9-induced disruption (KO) of lzts1 successfully reduces Lzts1 expression. The hCas9 and guide RNA for lzts1 were co-expressed with EGFP by performing in vivo electroporation at E13, and brains were examined at E15. The majority of EGFP+ cells were negative or exhibit weak Lzts1 immunoreactivity. f Magnified view. Bars, 30 μm. g Lzts1 KO retards the overall radial migration of cells from the apical surface. In vivo electroporation was performed at E13, and the distribution of EGFP+ cells in the cerebral wall was examined at E15 using 10 bins. Means ± s.d., Brunner–Munzel test, *p < 0.05, **p < 0.01, N = 8 (control) and 9 (KO) sections from three embryos per experiment (see also Supplementary Figure 4). h Scheme for Tbr2 expression in differentiating cells. i and j Both Lzts1 KD and KO significantly slowed the migration of Tbr2+ cells from the apical surface. This KD effect was rescued by the siRNA-resistant Lzts1, but not by wild-type Lzts1. In vivo electroporation was performed at E13, and the migration of EGFP+ Tbr2+ cells from the apical surface was examined at E14 in KD experiments or at E15 in KO experiments (Steel–Dwass test for multiple comparisons among the four conditions in KD experiments; Brunner–Munzel test for KO experiments; N = 547, 568, 351, 257, 306, and 344 cells from 8, 8, 11, 9, 7, and 8 sections of 4, 4, 4, 3, 3, and 3 embryos, respectively; Medians with Q1 and Q3 values). Bar, 50 μm. Source data are provided as a Source Data file
Fig. 4
Fig. 4
Lzts1 is dispensable for apical contraction but ensures rapid delamination. ac CRISPR/Cas9-mediated Lzts1 KO was performed by electroporating the plasmids into E13 Gadd45g::d4Venus Tg mice in vivo, and the apical endfeet were examined at E15 by performing en face observations. a Arrows indicate the RFP+ (electroporated) cells that are Venus+ (neuronally differentiating). b Lzts1 KO did not change the distribution of the circumferential length of AJ rings in both Venus+ and Venus cell populations. N = 445, 124, 404, and 162 cells from five (control) and six (KO) embryos, respectively, Steel–Dwass test. c Lzts1 KO increased the percentage of Venus+ apical endfeet among RFP+ endfeet. N = 13 and 13 fields from six embryos per experiment, Wilcoxson rank sum test. Bar, 5 μm. Medians with Q1 and Q3 values are reported. Source data are provided as a Source Data file
Fig. 5
Fig. 5
Lzts1 overexpression positions cells outside the VZ. a Experimental design. b Lzts1 overexpression (1.0 μg μl−1) promotes the detachment of cells from the VZ surface. Cell morphology was visualized by Cre-mediated Lyn-EGFP (membrane-targeted form of EGFP), which was co-electroporated (2 days after E13 electroporation). c An example of GFP+ Sox2+ cells in the SVZ that have long basal processes, which is the typical morphology of oRGs. dm The Lzts1 expression vector (1.0 μg μl−1, indicated as “Lzts1 1.0” or 0.2 μg μl−1, indicated as “Lzts1 0.2”) was in vivo electroporated at E13, and E15 brain sections were examined by IHC with anti-Ki67 e, anti-Sox2 f, anti-Tbr2 g and l, anti-PH3 h and i, anti-BrdU (30 min of BrdU pulse labeling) j, and anti-Pax6 k antibodies. d Distribution of Lzts1-overexpressing cells in 10 bins throughout the cerebral wall. f Forced expression of Lzts1 at both high (1.0 μg μl−1) and moderate (0.2 μg μl−1) levels increased the number of Sox2+ GFP+ cells in the SVZ. h and i Lzts1 significantly increases the percentage of non-apical PH3+ mitotic cells in a dose-dependent manner (Fisher’s exact test, two-sided, with Bonferroni-adjusted P value p < 0.05/6 = 0.0083). The asterisk in h indicates a PH3+ GFP+ cell. m The mitotic index (MI) indicates the percentage of Ki67+ cells among BrdU+ GFP+ cells that received BrdU 20 h before fixation. d N = 8 sections from 4 embryos per experiment; iN = 343, 56, 46, and 91 cells from 11, 9, 6, and 12 brain sections from 7, 4, 3, 4 embryos, respectively; j N = 8, 6; k N = 8, 6; l N = 6, 6; and m N = 4, 6 sections from three embryos per experiment, d *p < 0.05 and **p < 0.01, d and jm Wilcoxon rank sum test. Bars, 50 μm in b, and fh, 30 μm in c, 100 μm in e. Means ± s.d. Source data are provided as a Source Data file
Fig. 6
Fig. 6
Lzts1 overexpression induces delamination and MST. Time-lapse images of Lzts1-overexpressing aRG-like cells (pCAG::Lzts1: 2.0 μg μl−1 in a, 1.0 μg μl−1 in b and c or control EGFP-expressing cells d. The endfeet of the apical processes are indicated by arrows. Electroporation was performed at E12, and 8–24 h later, brain slices were cultured and images of aRG-like cells were captured for 20 h. See also Supplementary Movies 1–4. a Image of an lzts1-overexpressing cell showing the retraction of its apical process without mitosis (Type A). b Image of an lzts1-overexpressing cell that retracted its apical process from the apical surface, presumably during G2 phase, and underwent MST after retraction (Type B). c Time-lapse images of an lzts1-overexpressing cell showing the “MST from the apical surface” behavior after apical INM during G2 phase (Type C). Note that the apical process was maintained during mitosis (arrowheads). d Time-lapse images of the aRG-like cell in the control experiment showing normal INM and apical division. In control experiments, all aRG-like cells that we observed (63 cells from five embryos) exhibited this pattern. e The lzts1 plasmid concentration in the electroporation was related to the type of behaviors exhibited by aRG-like cells (N = 75 and 94 cells from six and four embryos). Type A was predominantly observed in cells electroporated with 2.0 μg μl−1 pCAG::Lzts1 (see also Supplementary Figure 7) (Fisher’s exact test, two-sided, with Bonferroni-adjusted P value p < 0.05/4 = 0.0125). Bars, 50 μm in ad
Fig. 7
Fig. 7
Lzts1 induces MST and apical contraction with dwonregulation of N-cadherin. a The distance of the MST in the SVZ induced by Lzts1 overexpression was decreased by blebbistatin, suggesting that the Lzts1-induced MST was mediated by myosin II (N = 49 and 16 cases, Brunner–Munzel test). b Lzts1 expression promotes the constriction of the apical endfoot. ZO1–mCherry with or without Lzts1 (1.0 μg μl−1) was expressed at E13 following in vivo electroporation, and after 1 day, en face observations of the apical surface were performed. c, d The myosin II inhibitor blebbistatin significantly decreased Lzts1-induced constriction of the apical endfoot. ZO1–mCherry with or without Lzts1 (pCAG::Lzts1: 0.7 μg μl−1) was electroporated into E13 R26-ZO1-EGFP mice, and after 1 day, blebbistatin or an equal concentration of DMSO was injected into the lateral ventricle for 30 min. En face observations of the apical surface are shown. d N = 380, 364, 378, and 433 cells from three embryos per experiment. Steel–Dwass test. e, f N-cadherin expression at AJs was decreased along with the contraction of the AJ rings in cells overexpressing Lzts1 (arrowheads). The signals for the anti-N-cadherin antibody at the Lzts1-expressing apical endfeet were compared to the signals at the neighboring cellular junctions. N = 40 cells from two embryos in f. g Anti-phospho-myosin light chain 2 (pMLC) staining of control or Lzts1-expressing mouse fibroblast NIH3T3 cells (arrows). h Exogenous Lzts1 expression makes NIH3T3 cells stiffer than control cells by activating the actomyosin system, and this activation occurs even in the cells with the taxol-induced stabilization of microtubules. AFM indentation measurements of cellular stiffness were performed at 2 h after cells were plated. N = 16, 12, 10, 8, 12, 14, 8, and 5 cells. Steel–Dwass test. i Lzts1 controls neuronal delamination (model). In differentiating cells, high levels of Lzts1 activate the Rho–ROCK-Myosin II pathway to enhance contraction and induce MST. Lzts1 concurrently perturbs the apical microtubule-actin-AJ complex at the apical endfoot by inhibiting microtubule polymerization to ensure the rapid delamination. Bars, 10 μm in b, c, 3 μm in e, and 50 μm in g. Medians with Q1 and Q3 values
Fig. 8
Fig. 8
Low Lzts1 expression gives rise to oblique aRG division. In vivo electroporation was performed at E13 to induce Lzts1 expression at a low level (pCAG::Lzts1-Flag [F]: 0.2 μg μl−1) along with H2B-GFP to visualize the DNA, and brain sections were examined at E14. a Triple staining for LGN, ZO1, and GFP in control or Lzts1-F-expressing cells undergoing mitosis at the apical surface. b Triple staining for Flag, ZO1, and GFP in Lzts1-F-expressing cells undergoing mitosis at the apical surface. c Triple immunostaining for α-tubulin, β-actin, and Flag in an Lzts1-F-expressing cell undergoing mitosis. Panels are shown with z = 2.0-μm intervals. The arrow indicates the connection to the apical surface. d Quadruple staining for GFP, γ-tubulin, ZO1 and PH3. e The number of cells displaying the oblique spindle orientation was significantly increased following Lzts1-F expression compared with control cells at the apical surface. We measured the spindle orientation θ in fixed sections d using a 3D-measurement method (N = 32 and 48 cells from three and four embryos, p = 1.6 × 10−6, Brunner–Munzel test, medians with Q1 and Q3 values are shown) to ensure the accuracy of the values
Fig. 9
Fig. 9
Variable expression of Lzts1 is responsible for generation of oRG-like cells. a lzts1 is expressed in a subset of aRGs within the developmental time window. Single-cell transcriptome profiles, revealed that 7/33 aRGs are lzts1+ (Log value > 6.0) at E14. Variances of the values are significantly different between E11 and E14, as well as between E14 and E16 aRGs (F-test, p = 4.1 × 10−8, p = 0.0038, N = 24, 33 and 17, respectively, bars indicate means). bd Variations in gene expression in lzts1+ aRGs (N = 7) and lzts1 aRGs (N = 26). Significantly lower hes1 expression was observed in lzts1+ aRGs than in lzts1 aRGs (p = 0.045), but pax6 (p = 0.36) (c) and neurog2 (p = 0.68) d expression were not significantly altered (permuted Brunner–Munzel test). As the references, data from IPs are also shown. Data from single-cell transcriptome profiles. See also Supplementary Figure 8. e Lzts1 KO decreases the division angles (θ) of aRGs. N = 193 and 193 cells from 10 and 9 embryos, respectively, Brunner–Munzel test, medians with Q1 and Q3 values. f Lzts1 KO reduces the oblique division of aRGs. hCas9, the guide RNA for Lzts1, ZO1-EGFP, and PACT1-mCyRFP were expressed by electroporation at E13, and after 2 days, en face imaging of the apical surface was performed to observe the aRG division pattern (images were obtained from four and three embryos, two-sided Fisher’s exact test). gi Lzts1 KD impairs the generation of Sox2+ GFP+ cells outside the VZ. The percentage of Sox2+ cells among GFP+ cells present in the SVZ (and IZ) was examined 2 days after electroporation. Bar, 30 μm. Arrowheads in the magnified views (g, h; Bar, 10 μm) indicate Sox2+ GFP+ cells. i The percentage of Sox2+ GFP+ cells in the SVZ (and IZ) was significantly reduced by Lzts1 KD following electroporation at E14, and this reduction was rescued by the introduction of the siRNA-resistant Lzts1, but not wild-type Lzts1 (N = 12, 9, 12, 12, 14, and 12 sections from 4, 3, 4, 4, 5, and 4 embryos, respectively; medians with Q1 and Q3 values are shown; Wilcoxon exact test at E13 and Steel–Dwass test at E14). Source data are provided as a Source Data file
Fig. 10
Fig. 10
Lzts1 controls oRG generation in the gyrencephalic brain. a IHC for Lzts1 in an E29 ferret dorsal forebrain. Bar, 100 μm. bd CRISPR/Cas9-induced disruption (KO) of lzts1 in the ferret brain. hCas9 and the gRNA for ferret lzts1 were co-expressed with EGFP by in vivo electroporation at E32, and brains were examined at E38. See also Supplementary Figure 12. b Lzts1 KO retards cellular migration from the apical surface. Distributions of Cas9 only (no gRNA), negative control gRNA or Lzts1-gRNA (KO#1) electroporated cells in 10 bins separating the cerebral wall were determined (N = 11, 11, and 13 hemispheres, respectively, mean ± s.d., Steel–Dwass test, *p = 0.023, **p = 5.5 × 10−4). c and d Lzts1 KO (KO#1, and KO#2 more moderately) reduced the percentage of Hes1+ cells among the electroporated cells in the OSVZ (we examined a 150-μm-depth area from the basal side of ISVZ, approximately corresponding to Bin 8 and the apical half of Bin 7) (N = 35, 37, 36, and 32 sections from 16, 20, 18, and 14 hemispheres, respectively; Steel–Dwass test, medians with Q1 and Q3 values are shown). Bar, 150 μm. Source data are provided as a Source Data file. e Low Lzts1 expression in aRGs induces the oRG-producing division (model). Low levels of Lzts1 are sufficient to inhibit astral microtubule–LGN–AJ anchoring in M-phase cells to induce oblique division

Similar articles

Cited by

References

    1. Noctor SC, Flint AC, Weissman TA, Dammerman RS, Kriegstein AR. Neurons derived from radial glial cells establish radial units in neocortex. Nature. 2001;409:714–720. doi: 10.1038/35055553. - DOI - PubMed
    1. Taverna E, Götz M, Huttner WB. The cell biology of neurogenesis: toward an understanding of the development and evolution of the neocortex. Annu Rev. Cell Dev. Biol. 2014;30:465–502. doi: 10.1146/annurev-cellbio-101011-155801. - DOI - PubMed
    1. Noctor SC, Martínez-Cerdeño V, Ivic L, Kriegstein AR. Cortical neurons arise in symmetric and asymmetric division zones and migrate through specific phases. Nat. Neurosci. 2004;7:136–144. doi: 10.1038/nn1172. - DOI - PubMed
    1. Miyata T, et al. Asymmetric production of surface-dividing and non-surface-dividing cortical progenitor cells. Development. 2004;131:3133–3145. doi: 10.1242/dev.01173. - DOI - PubMed
    1. Ostrem B, Di Lullo E, Kriegstein A. oRGs and mitotic somal translocation - a role in development and disease. Curr. Opin. Neurobiol. 2017;42:61–67. doi: 10.1016/j.conb.2016.11.007. - DOI - PMC - PubMed

Publication types