. 2019 Jun 25;10(1):2783.
doi: 10.1038/s41467-019-10690-3.

Circuit asymmetries underlie functional lateralization in the mouse auditory cortex

Affiliations

Circuit asymmetries underlie functional lateralization in the mouse auditory cortex

Robert B Levy et al. Nat Commun. .

Abstract

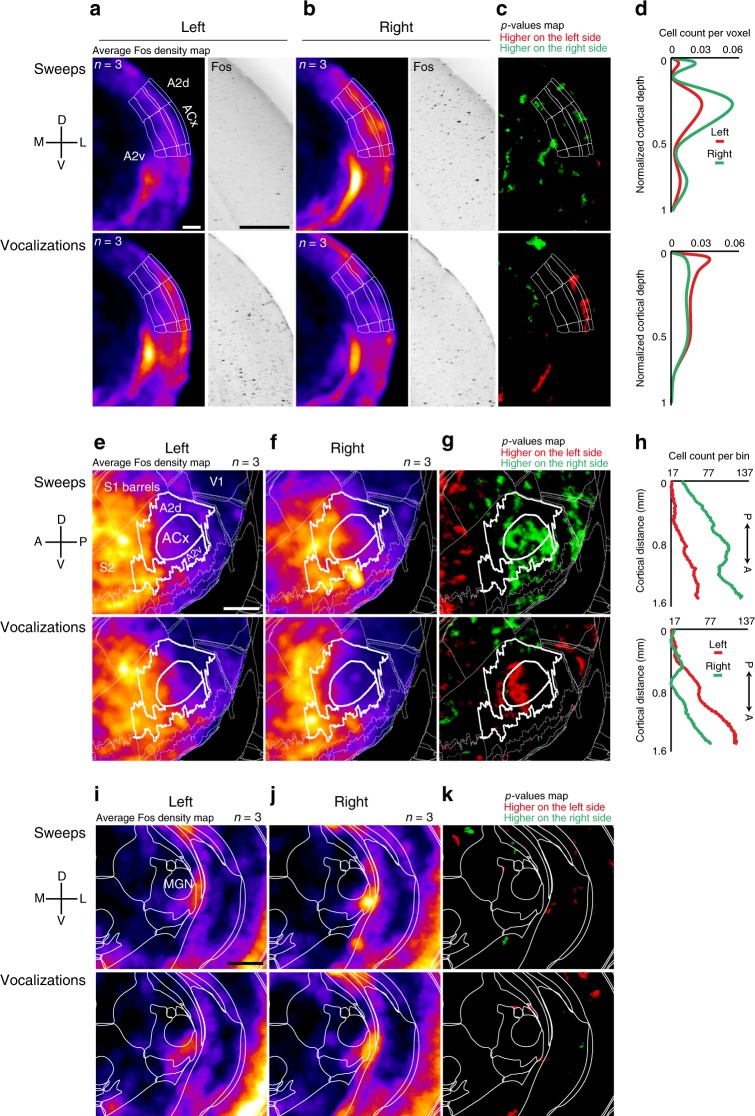
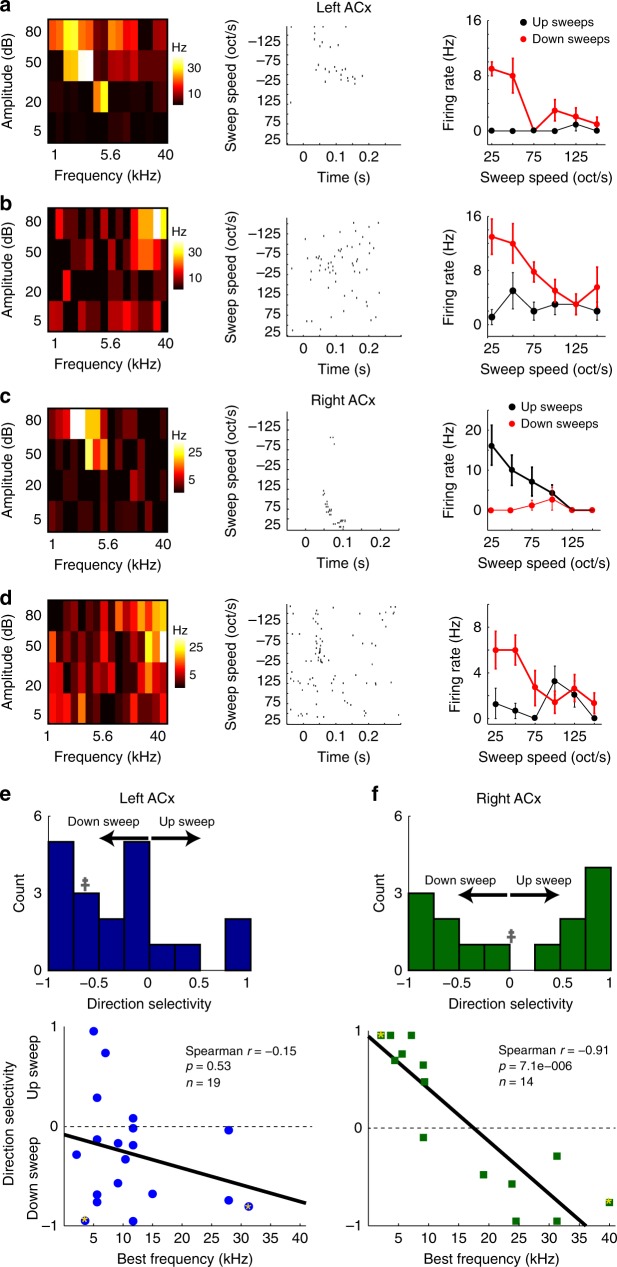
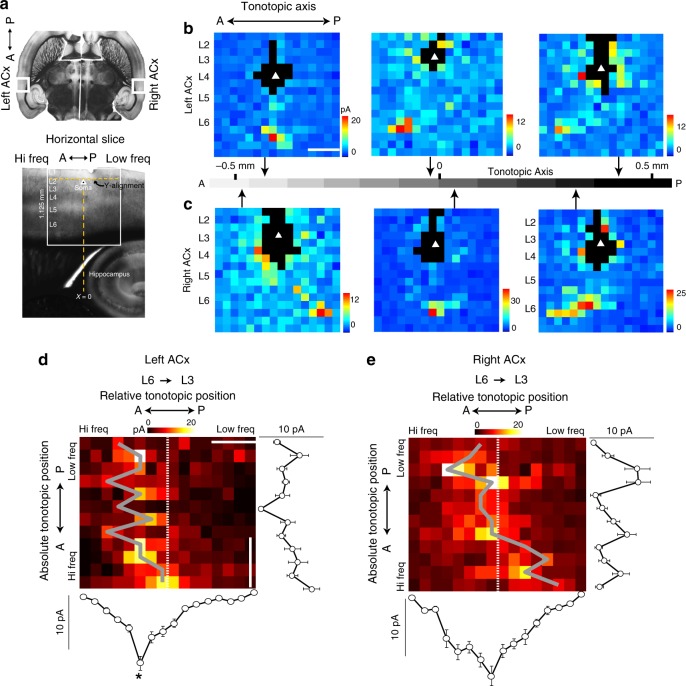
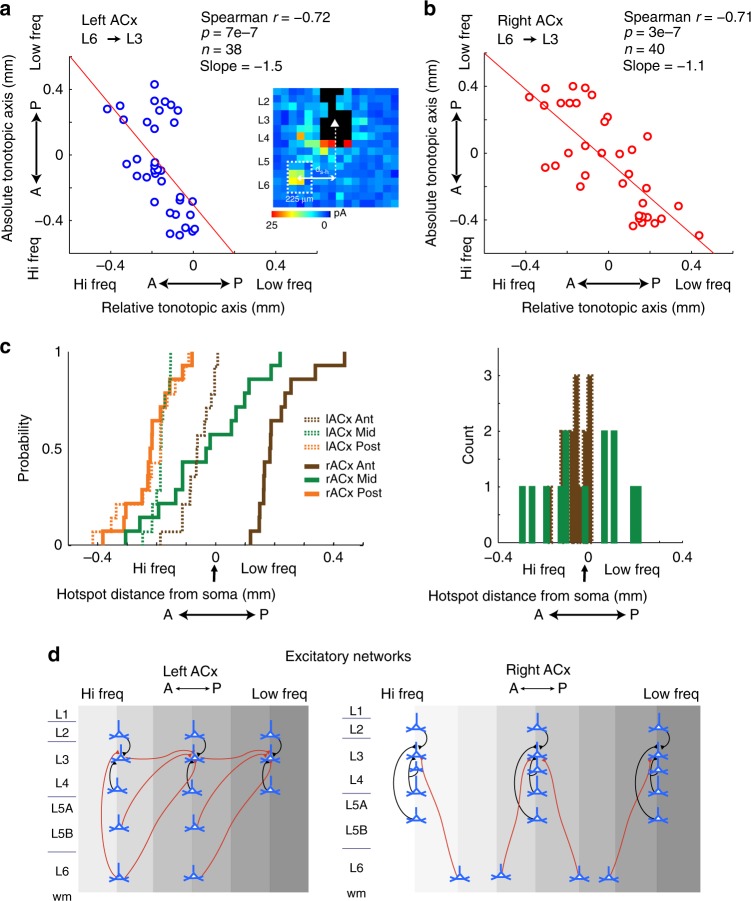
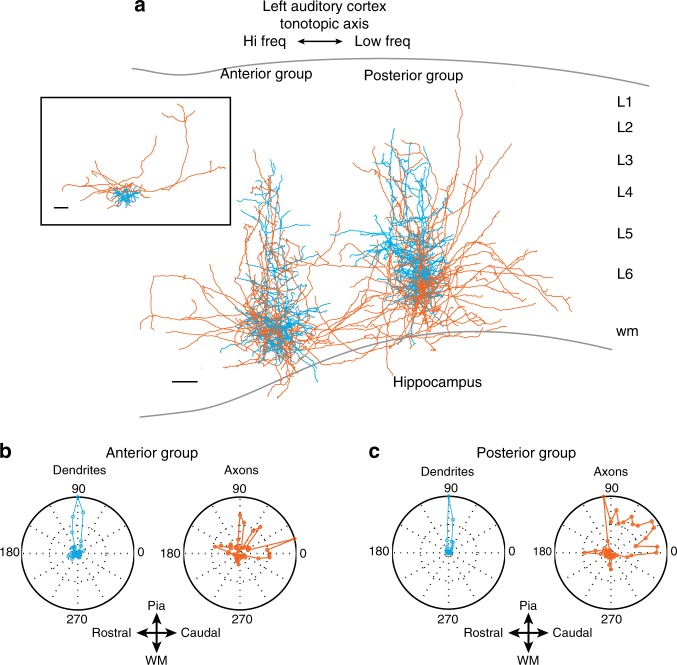
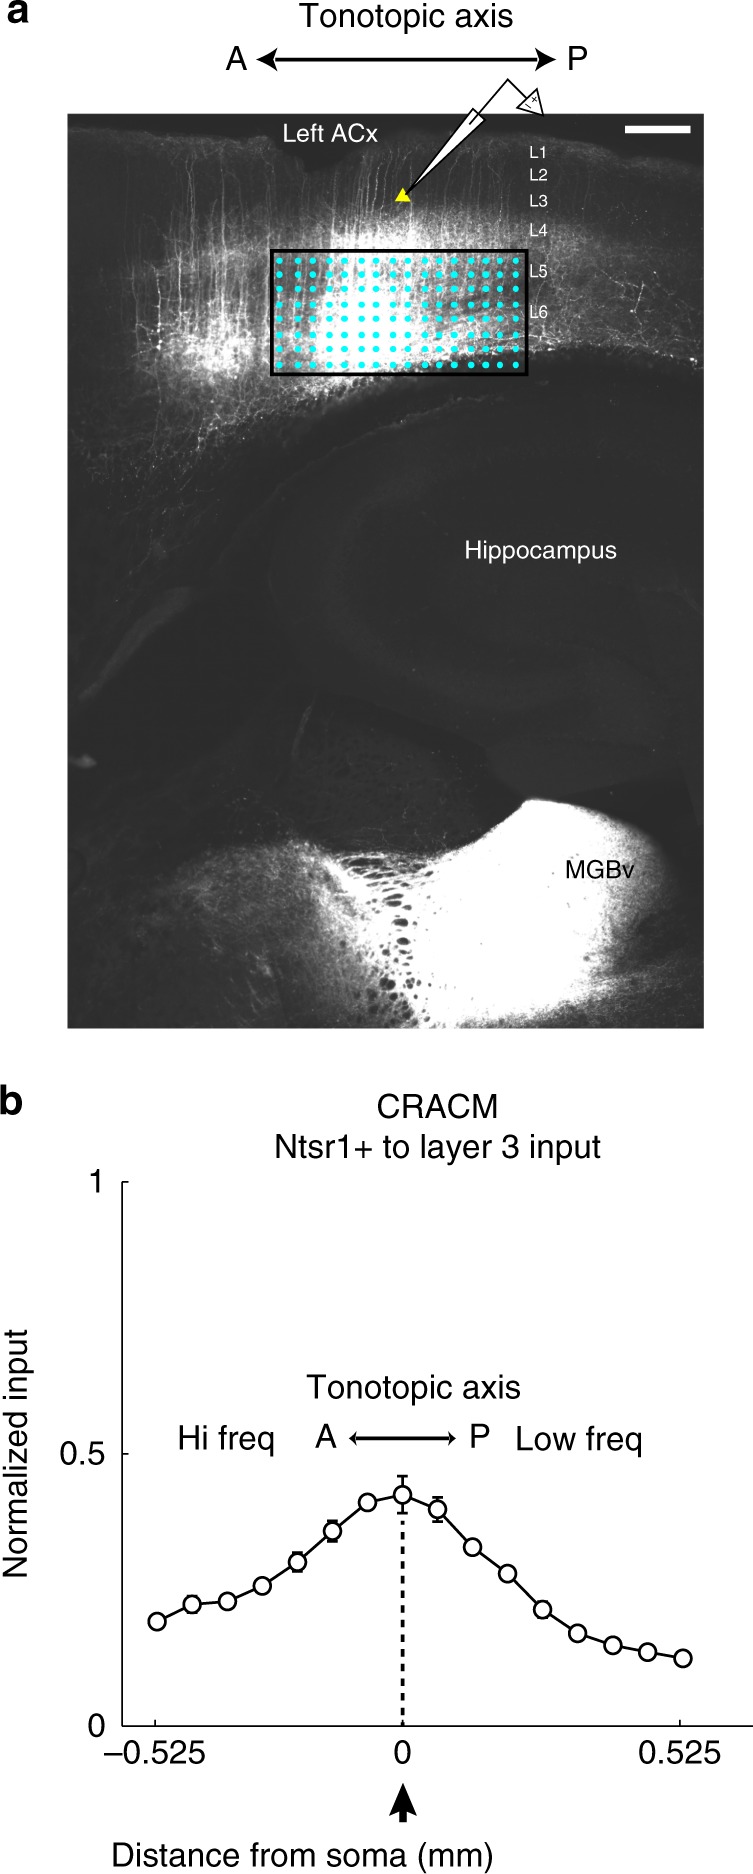
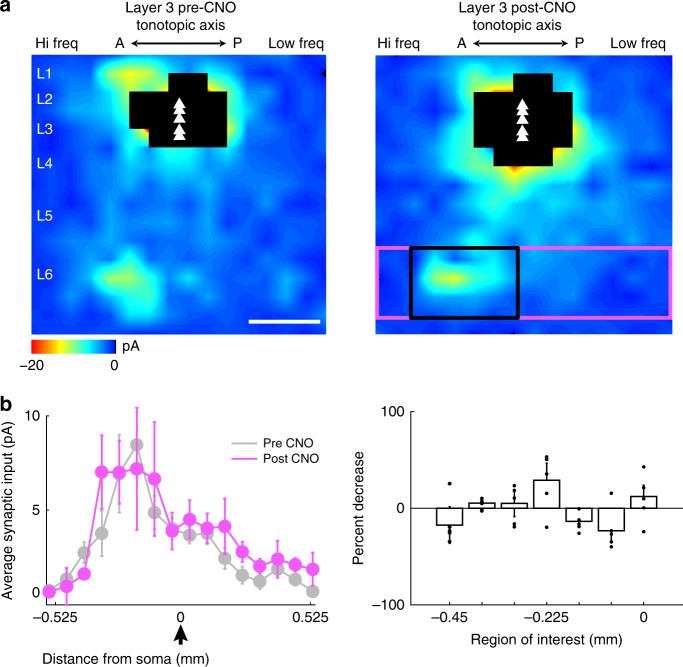
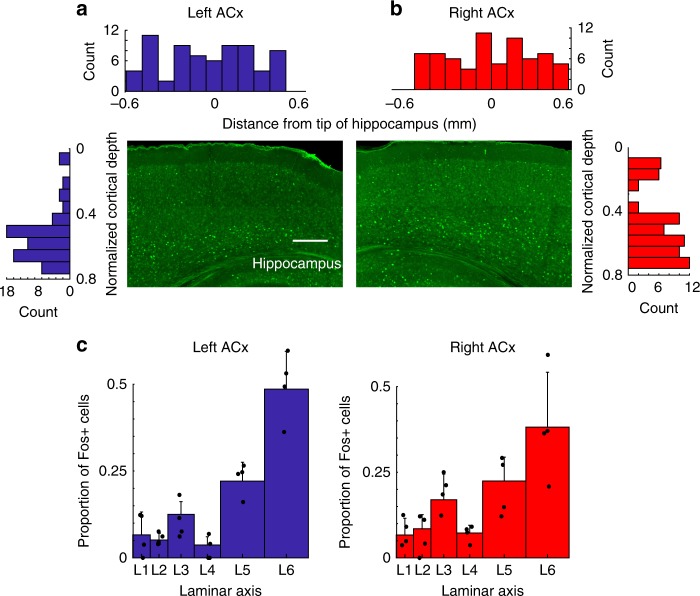
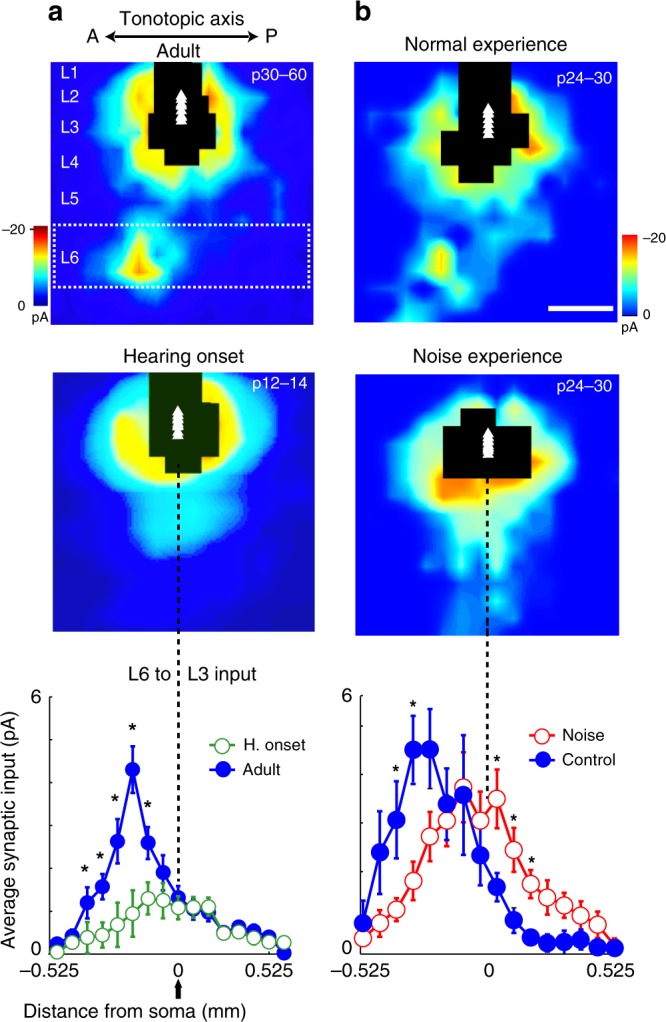
The left hemisphere's dominance in processing social communication has been known for over a century, but the mechanisms underlying this lateralized cortical function are poorly understood. Here, we compare the structure, function, and development of each auditory cortex (ACx) in the mouse to look for specializations that may underlie lateralization. Using Fos brain volume imaging, we found greater activation in the left ACx in response to vocalizations, while the right ACx responded more to frequency sweeps. In vivo recordings identified hemispheric differences in spectrotemporal selectivity, reinforcing their functional differences. We then compared the synaptic connectivity within each hemisphere and discovered lateralized circuit-motifs that are hearing experience-dependent. Our results suggest a specialist role for the left ACx, focused on facilitating the detection of specific vocalization features, while the right ACx is a generalist with the ability to integrate spectrotemporal features more broadly.


Conflict of interest statement

The authors declare no competing interests.

Figures

Fig. 1
Fig. 1
Sweeps and mouse vocalizations evoke lateralized activation in the ACx. a Coronal plane showing average Fos density (left) and Fos-positive cells stack (right) for sweeps (top, n = 3 mice) and vocalizations (bottom, n = 3 mice) in the left ACx; scale bar 0.5 mm. b Same as (a) but showing the right ACx. c Maps of statistically significant differences in activation between the left and right hemispheres. Sweeps evoked higher activation in the right ACx (top), and vocalizations evoked higher activation in the left (bottom). d Laminar distribution of cell count per imaging voxel (25 μm3). e, f Lateral cortical projection showing average Fos density for sweeps (top, n = 3 mice) and vocalizations (bottom, n = 3 mice) in the left and right hemispheres (respectively); scale bar 1 mm. g Maps of statistically significant differences in activation between the left and right cortical projections. Sweeps evoked higher activation in the right ACx (top), and vocalizations evoked higher activation in the left (bottom). h Distribution of cell count along the tonotopic axis. The y axis represents the number of cells in superficial layers in neighborhoods of 190 µm around each point on the line drawn. i, j Coronal plane showing average Fos density in the auditory thalamus (MGN), for sweeps (top, n = 3 mice) and vocalizations (bottom, n = 3 mice) in the left and right hemispheres (respectively); scale bar 1 mm. k Statistical maps showing no significant difference in activation between the left and right MGN projections
Fig. 2
Fig. 2
Hemispheric differences in sweep direction selectivity. Cell-attached recordings showing tone and sweep selectivity in L2/3 neurons. a Frequency response area (FRA, left), spike rasters of responses to sweeps (middle), and sweep selectivity (right) of a single neuron in the left ACx. The neuron’s BF = 3.4 kHz and had a down-sweep preference. b Left ACx neuron with BF = 31.3 kHz and a down-sweep preference. c Right ACx neuron with BF = 3.4 kHz and an up-sweep preference. d Right ACx neuron with BF = 40 kHz and a down-sweep preference. All data are presented as mean ± SEM. e, f Distribution of sweep direction selectivity (top panels), and direction selectivity-best frequency dependence (bottom panels) in the left and right ACx. Double cross in the top panels represents the skewness of the distribution. Points with asterisks correspond to the cells shown ad, and solid black lines are best linear fits
Fig. 3
Fig. 3
Tonotopic connectivity differs between the left and right ACx. a Horizontal slices capture the anterior–posterior (A↔P) representation of tonotopy in the left and right ACx (top); white box scale 1 mm × 1 mm. DIC image of a horizontal slice during an experiment depicting the anatomical landmarks used to align consistently the stimulation grid (bottom). b, c Left, middle, and right panels are representative single-cell maps of six L3 neurons mapped at anterior, middle, and posterior locations of the left and right ACx, respectively. Each cell is shown with its native position along the tonotopic axis (arrows); scale bar 0.3 mm. d, e 2D population maps where each row is the average L6 input to L3 cells mapped within 50 μm from one another and ordered by tonotopic position in the left ACx (n = 38) and the right ACx (n = 40), respectively. The x axis is the position of the cells in the LSPS map grid (cells are always centered on their input maps). The tonotopic position of each row is the average distance of the cells binned to the tip of the hippocampus. Dashed white line represents the soma position and gray lines connect pixels of maximum input strength. Line plots in d and e are the columnar and row averages of synaptic input calculated from the 2D population maps. Asterisk indicates that synaptic input arising from the anterior and posterior areas of the 2D population map were significantly different (p = 1.4e-3, n = 38, Wilcoxon rank-sum). X scale bar 0.3 mm, y scale bar 0.33 mm. All data are presented as mean ± SEM
Fig. 4
Fig. 4
Lateralized circuit-motifs in the left and right ACx. a, b Population scatter plot pairing each cell’s absolute tonotopic position (y axis) with the relative tonotopic location of its L6 hotspot centroid (x axis), for the left and right ACx, respectively. Red line is the best linear fit through the data. Inset depicts a single-cell average input showing how the distance from the soma to the hotspot centroid was calculated. In the y axis, 0 represents the tip of the hippocampus, and in the x axis, 0 is the position of the cell in the LSPS map grid. c, left Intra and interhemispheric cumulative probability density function of L6→L3 hotspot distance from soma in anterior (brown), middle (green) and posterior (orange) clusters in the left (dashed) and right (solid) ACx. c, right Distribution of L6→L3 hotspots from anterior sites in the left ACx (dashed brown bars) and middle sites in the right ACx (green bars). d Wiring diagram of excitatory networks in the left ACx and right ACx. Black lines represent columnar projections, and red lines represent out-of-column projections
Fig. 5
Fig. 5
Axonal arborizations reflect circuit-motifs in the left ACx. a Neurolucida reconstructions of L6 pyramidal neurons in anterior (n = 4) and posterior (n = 5) regions of the ACx. Dendrites and somata are shown in blue, axons in red. Inset shows one of the cells reconstructed with out-of-column and superficial projecting axons. Scale bars 0.1 mm. b, c Polar plots of the processes along the tonotopic axis. 0 degrees = posterior direction, 90 degrees = pia, 180 degrees = anterior, 270 degrees = white matter
Fig. 6
Fig. 6
Channelrhodopsin-assisted mapping of L6-Ntsr1 input to L3. a Confocal image of channelrhodopsin expression in the auditory cortex. Axons are clearly seen in the auditory thalamus (MGBv). Neurons in L3 centered on the injection bolus were targeted for whole-cell recordings. Scale bar 0.3 mm. b Using minimal laser stimulation (at threshold to evoke a measureable postsynaptic response), we obtained the spatial profile of L6-Ntsr1 input to L3. Normalized columnar average of L6-Ntsr1 input to cells in L3 (n = 10) revealed input largely centered on the somata of the cells recorded. All data are presented as mean ± SEM
Fig. 7
Fig. 7
Chemogenetic silencing of L6-Ntsr1 input to L3. a Average population input maps of L3 neurons before (left) and after (right) presynaptic silencing of Ntsr1 input with CNO infusion into the bath. Scale bar 0.3 mm. b, left Columnar average of synaptic from L6 (boxed pink region in panel A right) to L3 before and after CNO infusion (n = 5 cells, five mice). b, right The percent decrease in out-of-column L6 input (boxed black region in (a) right) to L3 was largely unchanged after CNO infusion. All data are presented as mean ± SEM
Fig. 8
Fig. 8
Hearing onset Fos activity in response to vocalizations. a, b Quantification of immuno Fos staining data at hearing onset (P12–14) showing that there is no difference in the number of Fos-positive neurons between the left and right ACx. Scale bar 0.2 mm. c Population plots showing that although there is no difference in the total number of active cells between the hemispheres, there is a significant difference in the activation of superficial and deep layers (n = 3 mice). All data are presented as mean ± SEM
Fig. 9
Fig. 9
Development and experience-dependence of the L6→L3 out-of-column circuit motif. a Comparison of synaptic input to L3 in the ACx of adult (top, P30–60; n = 12 cells, 10 mice) and hearing onset mice (middle, P12–14; n = 20 cells, eight mice). The lack of out-of-column input from L6 (boxed region) at hearing onset is significant (bottom, data points marked with stars are significantly different). b Comparison of synaptic input to L3 in age-matched control mice (top, P24–30, n = 25 cells, six mice) and noise-reared mice (middle, P24–30, n = 25 cells, six mice). Noise rearing significantly impacted the formation of out-of-column input from L6 (bottom, data points marked with stars are significantly different). Scale bar 0.3 mm. All data are presented as mean ± SEM

Similar articles

Cited by

References

    1. Broca P. Remarques sur le sie’ge de la faculte’ du language articule’, suivies d’une observation d’aphe’mie (perte de la parole) Bull. Soc. Anat. 1861;6:330–357.
    1. Tzourio-Mazoyer N, et al. Effect of familial sinistrality on planum temporale surface and brain tissue asymmetries. Cereb. Cortex. 2010;20:1476–1485. doi: 10.1093/cercor/bhp209. - DOI - PubMed
    1. Giraud AL, et al. Endogenous cortical rhythms determine cerebral specialization for speech perception and production. Neuron. 2007;56:1127–1134. doi: 10.1016/j.neuron.2007.09.038. - DOI - PubMed
    1. Zatorre RJ, Belin P. Spectral and temporal processing in human auditory cortex. Cereb. Cortex. 2001;11:946–953. doi: 10.1093/cercor/11.10.946. - DOI - PubMed
    1. Ocklenburg, S., Ströckens, F. & Güntürkün, O. Lateralisation of conspecific vocalisation in non-human vertebrates. Laterality18, 1–31 (2011). - PubMed

Publication types

LinkOut - more resources