

Detection of circulating tumor cells in blood by shell-isolated nanoparticle - enhanced Raman spectroscopy (SHINERS) in microfluidic device
- PMID: 31239487
- PMCID: PMC6592934
- DOI: 10.1038/s41598-019-45629-7
Detection of circulating tumor cells in blood by shell-isolated nanoparticle - enhanced Raman spectroscopy (SHINERS) in microfluidic device
Abstract
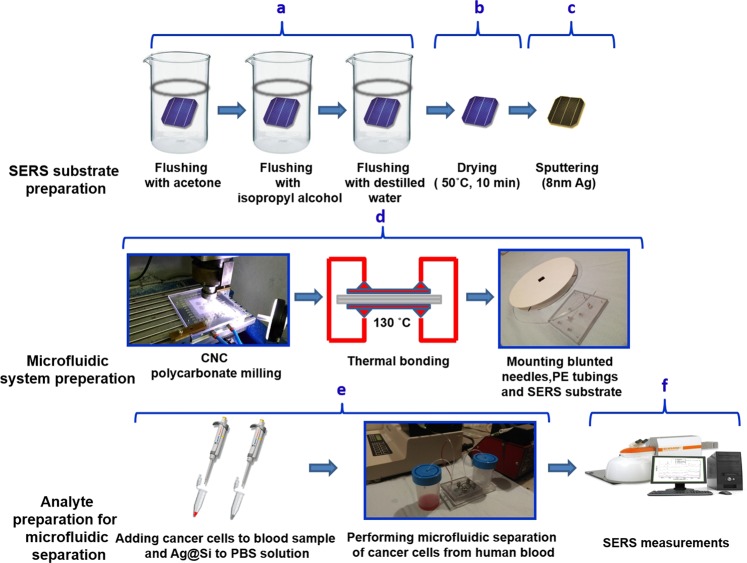
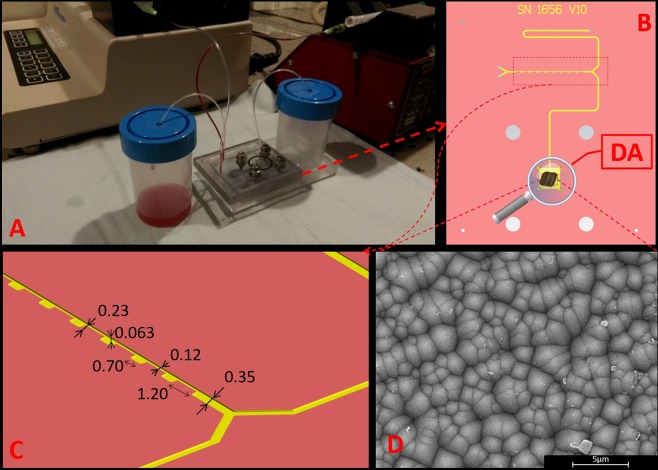
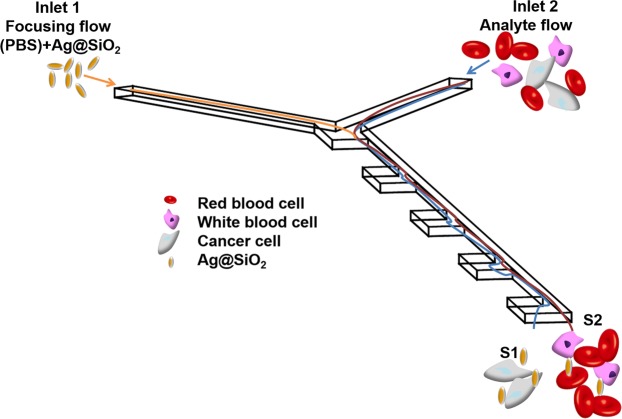
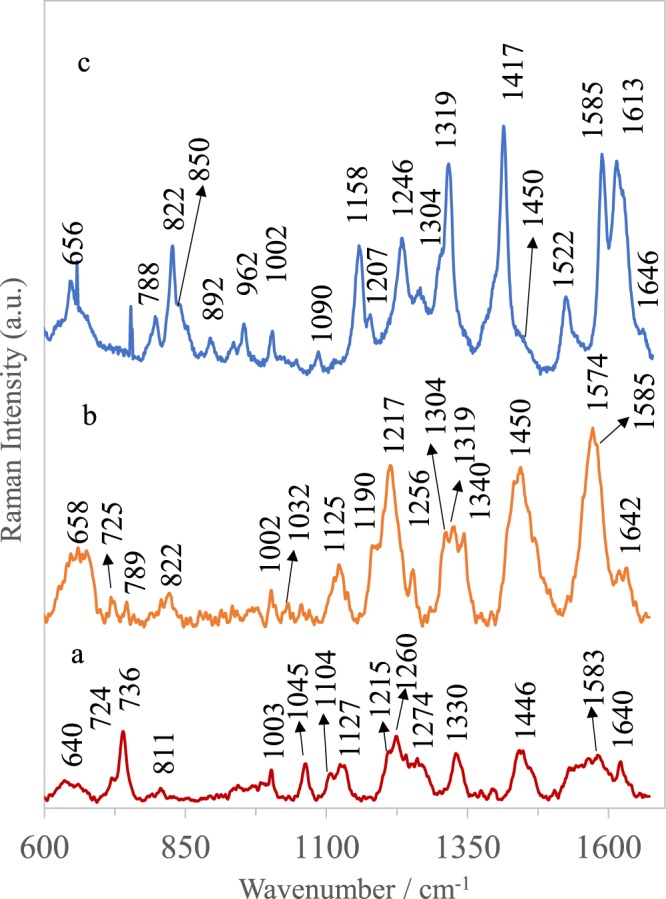
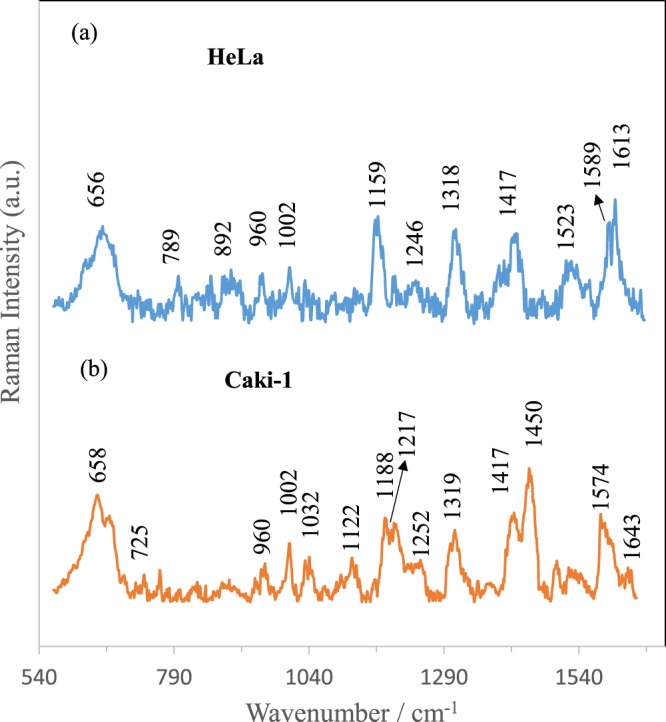
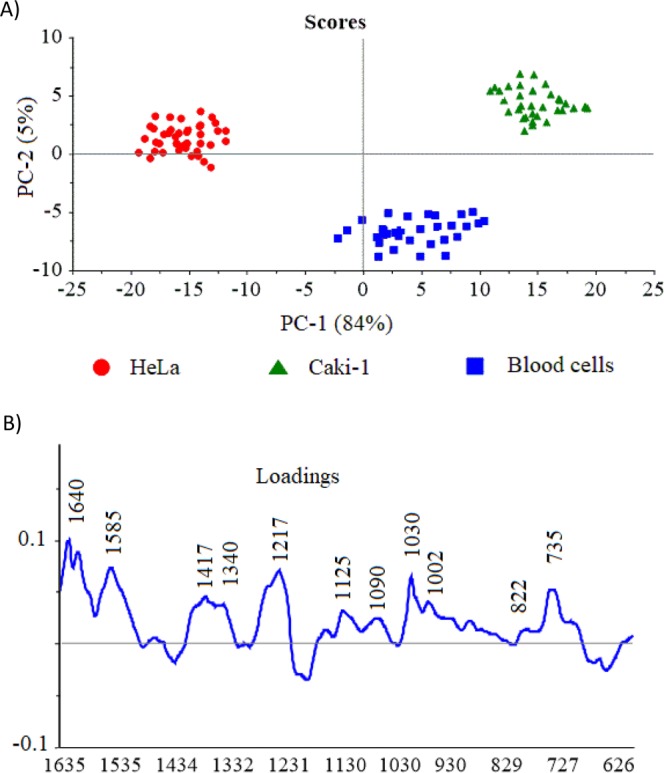
Isolation and detection of circulating tumor cells (CTCs) from human blood plays an important role in non- invasive screening of cancer evolution and in predictive therapeutic treatment. Here, we present the novel tool utilizing: (i) the microfluidic device with (ii) incorporated photovoltaic (PV) based SERS-active platform, and (iii) shell-isolated nanoparticles (SHINs) for simultaneous separation and label-free analysis of circulating tumour cells CTCs in the blood specimens with high specificity and sensitivity. The proposed microfluidic chip enables the efficient size - based inertial separation of circulating cancer cells from the whole blood samples. The SERS-active platform incorporated into the microfluidic device permits the label-free detection and identification of isolated cells through the insight into their molecular and biochemical structure. Additionally, the silver nanoparticles coated with an ultrathin shell of silica (Ag@SiO2) was used to improve the detection accuracy and sensitivity of analysed tumor cells via taking advantages of shell-isolated nanoparticle-enhanced Raman spectroscopy (SHINERS). The empirical analysis of SHINERS spectra revealed that there are some differences among studied (HeLa), renal cell carcinoma (Caki-1), and blood cells. Unique SHINERS features and differences in bands intensities between healthy and cancer cells might be associated with the variations in the quantity and quality of molecules such as lipid, protein, and DNA or their structure during the metastasis cancer formation. To demonstrate the statistical efficiency of the developed method and improve the differentiation for circulating tumors cells detection the principal component analysis (PCA) has been performed for all SHINERS data. PCA method has been applied to recognize the most significant differences in SHINERS data among the three analyzed cells: Caki-1, HeLa, and blood cells. The proposed approach challenges the current multi-steps CTCs detection methods in the terms of simplicity, sensitivity, invasiveness, destructivity, time and cost of analysis, and also prevents the defragmentation/damage of tumor cells and thus leads to improving the accuracy of analysis. The results of this research work show the potential of developed SERS based tool for the separation of tumor cells from whole blood samples in a simple and minimally invasive manner, their detection and molecular characterization using one single technology.
Conflict of interest statement
The authors declare no competing interests.
Figures
Similar articles
-
Immunomagnetic Capture and Multiplexed Surface Marker Detection of Circulating Tumor Cells with Magnetic Multicolor Surface-Enhanced Raman Scattering Nanotags.ACS Appl Mater Interfaces. 2020 Oct 21;12(42):47220-47232. doi: 10.1021/acsami.0c12395. Epub 2020 Oct 9. ACS Appl Mater Interfaces. 2020. PMID: 32966038 Free PMC article.
-
Improved SERS Nanoparticles for Direct Detection of Circulating Tumor Cells in the Blood.ACS Appl Mater Interfaces. 2015 May 13;7(18):9965-71. doi: 10.1021/acsami.5b02276. Epub 2015 Apr 29. ACS Appl Mater Interfaces. 2015. PMID: 25875511
-
The use of Au@SiO2 shell-isolated nanoparticle-enhanced Raman spectroscopy for human breast cancer detection.Anal Bioanal Chem. 2014 Sep;406(22):5425-32. doi: 10.1007/s00216-014-7967-5. Epub 2014 Jun 24. Anal Bioanal Chem. 2014. PMID: 24958347
-
An efficient strategy for circulating tumor cell detection: surface-enhanced Raman spectroscopy.J Mater Chem B. 2020 Apr 29;8(16):3316-3326. doi: 10.1039/c9tb02327e. J Mater Chem B. 2020. PMID: 31833526 Review.
-
Emerging Microfluidic Technologies for the Detection of Circulating Tumor Cells and Fetal Nucleated Red Blood Cells.ACS Appl Bio Mater. 2021 Feb 15;4(2):1140-1155. doi: 10.1021/acsabm.0c01325. Epub 2021 Jan 8. ACS Appl Bio Mater. 2021. PMID: 35014471 Review.
Cited by
-
Isolation, Detection and Analysis of Circulating Tumour Cells: A Nanotechnological Bioscope.Pharmaceutics. 2023 Jan 13;15(1):280. doi: 10.3390/pharmaceutics15010280. Pharmaceutics. 2023. PMID: 36678908 Free PMC article. Review.
-
Electrochemical Shell-Isolated Nanoparticle-Enhanced Raman Spectroscopy of Imidazole Ring Functionalized Monolayer on Smooth Gold Electrode.Molecules. 2022 Oct 3;27(19):6531. doi: 10.3390/molecules27196531. Molecules. 2022. PMID: 36235068 Free PMC article.
-
Effective strategies to enhance the diagnosis and treatment of RCC: The application of biocompatible materials.Mater Today Bio. 2024 Jul 9;27:101149. doi: 10.1016/j.mtbio.2024.101149. eCollection 2024 Aug. Mater Today Bio. 2024. PMID: 39100279 Free PMC article. Review.
-
Label-Free Sensing with Metal Nanostructure-Based Surface-Enhanced Raman Spectroscopy for Cancer Diagnosis.ACS Appl Nano Mater. 2022 Sep 23;5(9):12276-12299. doi: 10.1021/acsanm.2c02392. Epub 2022 Aug 22. ACS Appl Nano Mater. 2022. PMID: 36210923 Free PMC article. Review.
-
Shell-Isolated Nanoparticle-Enhanced Raman Spectroscopy for Probing Riboflavin on Graphene.Materials (Basel). 2022 Feb 22;15(5):1636. doi: 10.3390/ma15051636. Materials (Basel). 2022. PMID: 35268866 Free PMC article.
References
-
- Ghossein RA, Bhattacharya S, Rosai J. Molecular Detection of Micrometastases and Circulating Tumor Cells in Solid Tumors. Clinical Cancer Research. 1999;5:1950–1960. - PubMed
Publication types
MeSH terms
Substances
LinkOut - more resources
Full Text Sources
Other Literature Sources
Miscellaneous
