

Plasma High Mobility Group Box 1 (HMGB1), Osteopontin (OPN), and Hyaluronic Acid (HA) as Admissible Biomarkers for Endometriosis
- PMID: 31239500
- PMCID: PMC6592882
- DOI: 10.1038/s41598-019-45785-w
Plasma High Mobility Group Box 1 (HMGB1), Osteopontin (OPN), and Hyaluronic Acid (HA) as Admissible Biomarkers for Endometriosis
Abstract
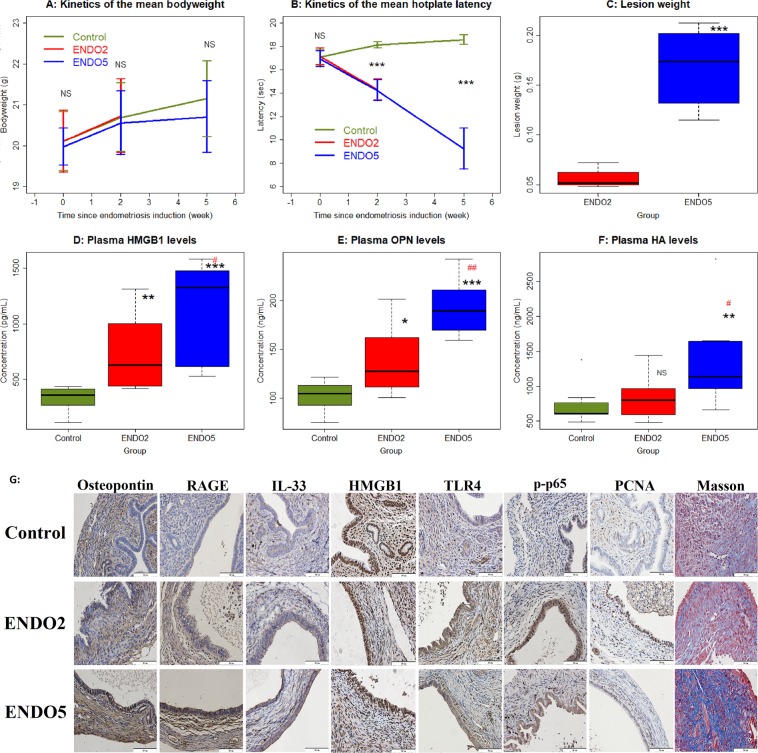
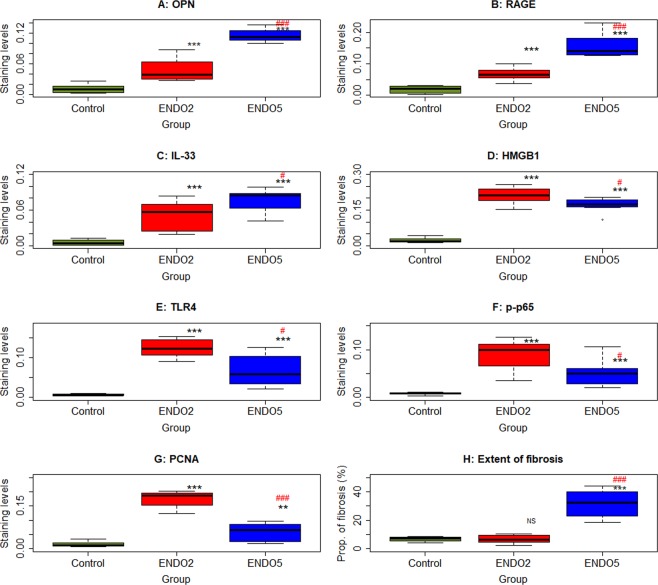
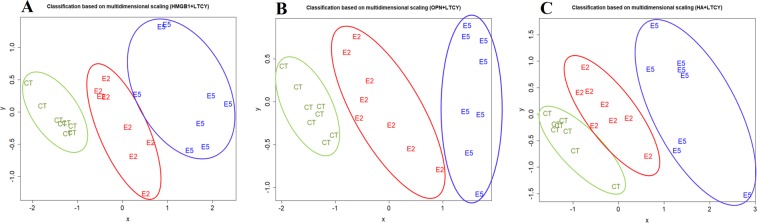
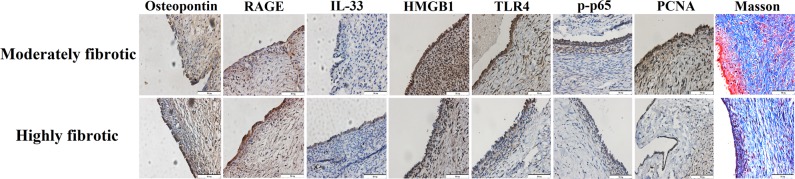
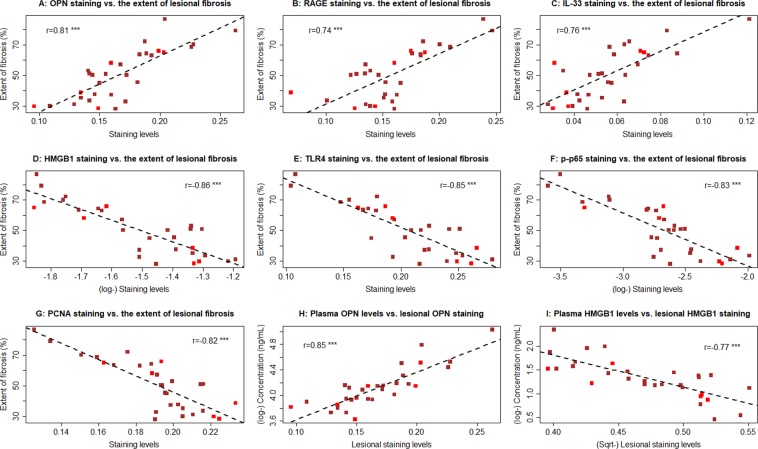
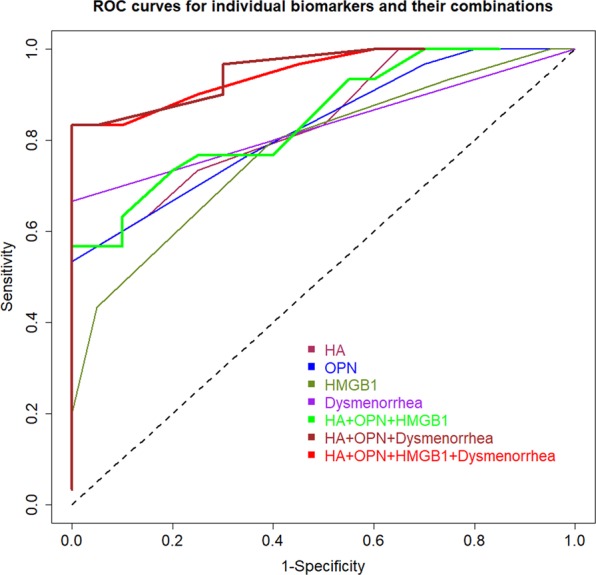
Identification of biomarkers for endometriosis is an unmet medical need that demands to be fulfilled. In this study, we first used a mouse model of endometriosis and evaluated the potential utility of select biomarkers based on serial observations. Since fibrosis is the end result of lesional development, we chose high mobility group box 1 (HMGB1), osteopontin (OPN), and hyaluronic acid (HA), all three of them have been well documented to be involved in endometriosis and fibrosis, as potential biomarkers. In addition, we performed immunohistochemistry analysis of HMGB1, OPN, and the receptors for HMGB1, such as toll-like receptor 4 (TLR4), nuclear factor κB (NF-κB), proliferating cell nuclear antigen (PCNA), interleukin-33 (IL-33), and receptor for advanced glycation endproducts (RAGE)-a pattern recognition receptor, with HMGB1 being its important ligand. We then evaluated the same set of putative markers in 30 women with ovarian endometriomas and 20 without endometriosis, and reevaluated the 3 plasma markers 3 months after the surgical removal of all visible endometriotic lesions. In mouse, the lesional staining levels of OPN, RAGE, and IL-33 were all significantly higher than that of normal endometrium, and increased progressively as lesions progressed. In contrast to HMGB1, TLR4, p-p65 and PCNA staining levels were decreased progressively. In humans, lesional staining levels of OPN correlated positively, while that of HMGB1 correlated negatively with the extent of fibrosis. All three plasma markers correlated positively with the extent of lesional fibrosis. Through this integrated approach, we identified plasma HMGB1, OPN and HA as promising admissible biomarkers for endometriosis.
Conflict of interest statement
The authors declare no competing interests.
Figures


Similar articles
-
High Expression of High-Mobility Group Box 1 in Menstrual Blood: Implications for Endometriosis.Reprod Sci. 2017 Nov;24(11):1532-1537. doi: 10.1177/1933719117692042. Epub 2017 Feb 12. Reprod Sci. 2017. PMID: 29017437
-
Expression of high-mobility groups box-1/receptor for advanced glycation end products/osteopontin/early growth response-1 pathway in proliferative vitreoretinal epiretinal membranes.Mol Vis. 2011 Feb 17;17:508-18. Mol Vis. 2011. PMID: 21365018 Free PMC article.
-
Expression and localisation of osteopontin and prominin-1 (CD133) in patients with endometriosis.Int J Mol Med. 2013 May;31(5):1011-6. doi: 10.3892/ijmm.2013.1325. Epub 2013 Mar 28. Int J Mol Med. 2013. PMID: 23545719 Free PMC article.
-
Translationally controlled tumor protein affects colorectal cancer metastasis through the high mobility group box 1-dependent pathway.Int J Oncol. 2018 Oct;53(4):1481-1492. doi: 10.3892/ijo.2018.4502. Epub 2018 Jul 25. Int J Oncol. 2018. PMID: 30066846 Free PMC article.
-
Advanced Biomarkers of Hepatotoxicity in Psychiatry: A Narrative Review and Recommendations for New Psychoactive Substances.Int J Mol Sci. 2023 May 28;24(11):9413. doi: 10.3390/ijms24119413. Int J Mol Sci. 2023. PMID: 37298365 Free PMC article. Review.
Cited by
-
Suppression of TLR4-MyD88 signaling pathway attenuated chronic mechanical pain in a rat model of endometriosis.J Neuroinflammation. 2021 Mar 5;18(1):65. doi: 10.1186/s12974-020-02066-y. J Neuroinflammation. 2021. PMID: 33673857 Free PMC article.
-
Effects of Progestin on Modulation of the Expression of Biomarkers in Endometriosis.Biomedicines. 2023 Jul 20;11(7):2036. doi: 10.3390/biomedicines11072036. Biomedicines. 2023. PMID: 37509675 Free PMC article.
-
HMGB1: a double-edged sword and therapeutic target in the female reproductive system.Front Immunol. 2023 Aug 18;14:1238785. doi: 10.3389/fimmu.2023.1238785. eCollection 2023. Front Immunol. 2023. PMID: 37691930 Free PMC article. Review.
-
Platelets and Regulatory T Cells May Induce a Type 2 Immunity That Is Conducive to the Progression and Fibrogenesis of Endometriosis.Front Immunol. 2020 Dec 14;11:610963. doi: 10.3389/fimmu.2020.610963. eCollection 2020. Front Immunol. 2020. PMID: 33381124 Free PMC article.
-
The role of fibrosis in endometriosis: a systematic review.Hum Reprod Update. 2024 Dec 1;30(6):706-750. doi: 10.1093/humupd/dmae023. Hum Reprod Update. 2024. PMID: 39067455 Free PMC article.
References
-
- Giudice, L. C. & Kao, L. C. Endometriosis. Lancet364, 1789–1799, S0140673604174035 (2004). - PubMed
-
- Vercellini, P., Vigano, P., Somigliana, E. & Fedele, L. Endometriosis: pathogenesis and treatment. Nat Rev Endocrinol10, 261–275, nrendo.2013.255 (2014). - PubMed
-
- Simoens, S. et al. The burden of endometriosis: costs and quality of life of women with endometriosis and treated in referral centres. Hum Reprod27, 1292–1299, des073 (2012). - PubMed
Publication types
MeSH terms
Substances
LinkOut - more resources
Full Text Sources
Medical
Molecular Biology Databases
Research Materials
Miscellaneous
