. 2019 Jun 19:2:218.
doi: 10.1038/s42003-019-0437-z. eCollection 2019.

SPHIRE-crYOLO is a fast and accurate fully automated particle picker for cryo-EM

Affiliations

SPHIRE-crYOLO is a fast and accurate fully automated particle picker for cryo-EM

Thorsten Wagner et al. Commun Biol. .

Abstract

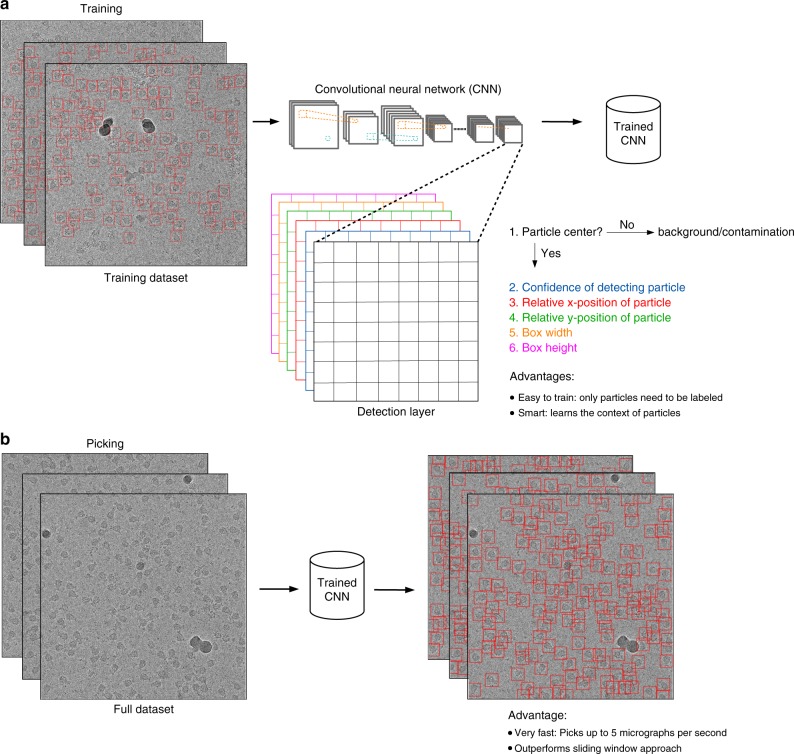
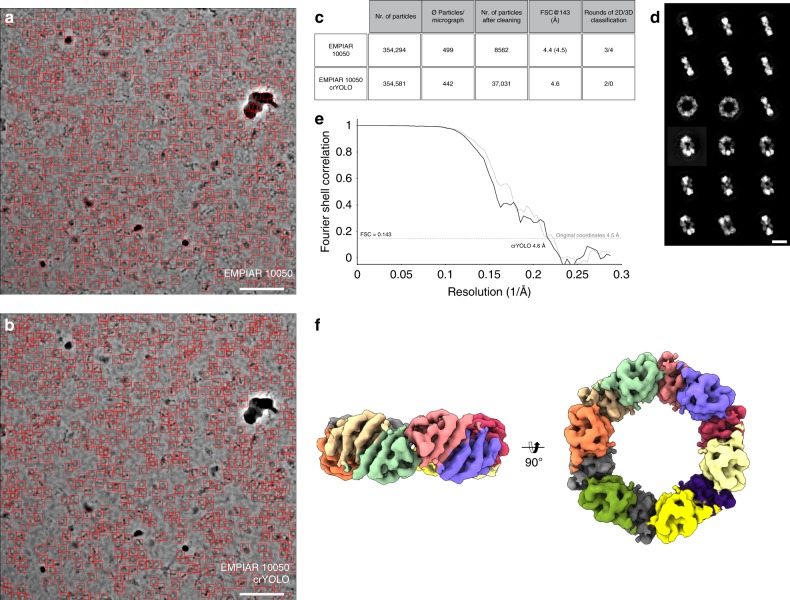
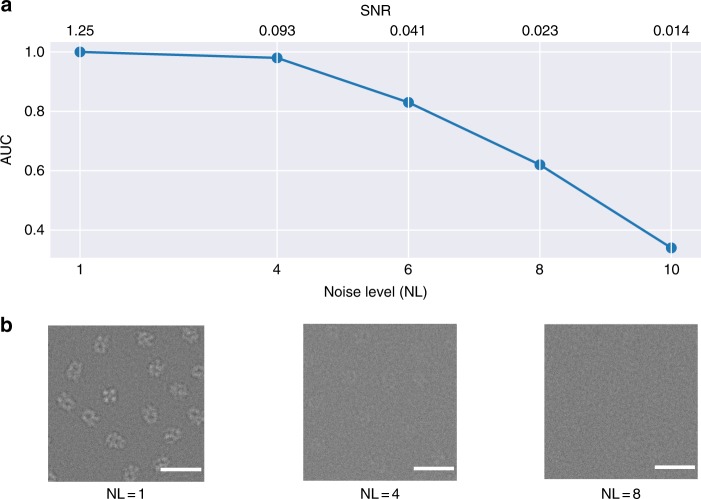
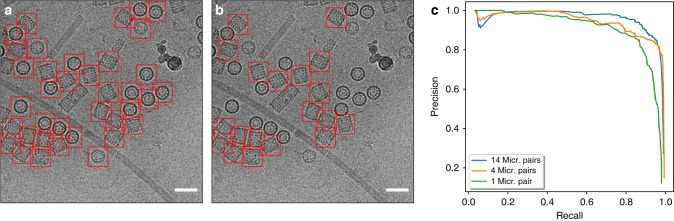
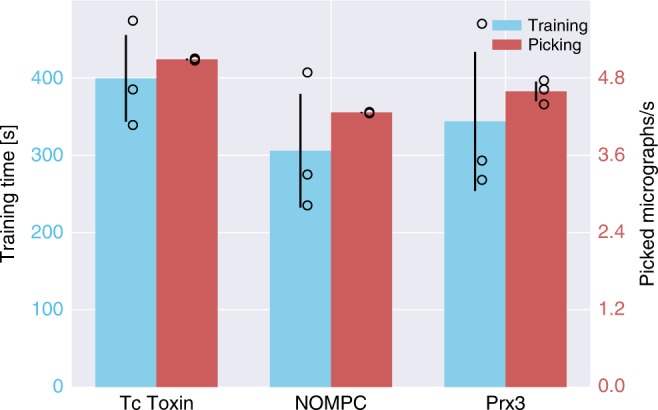
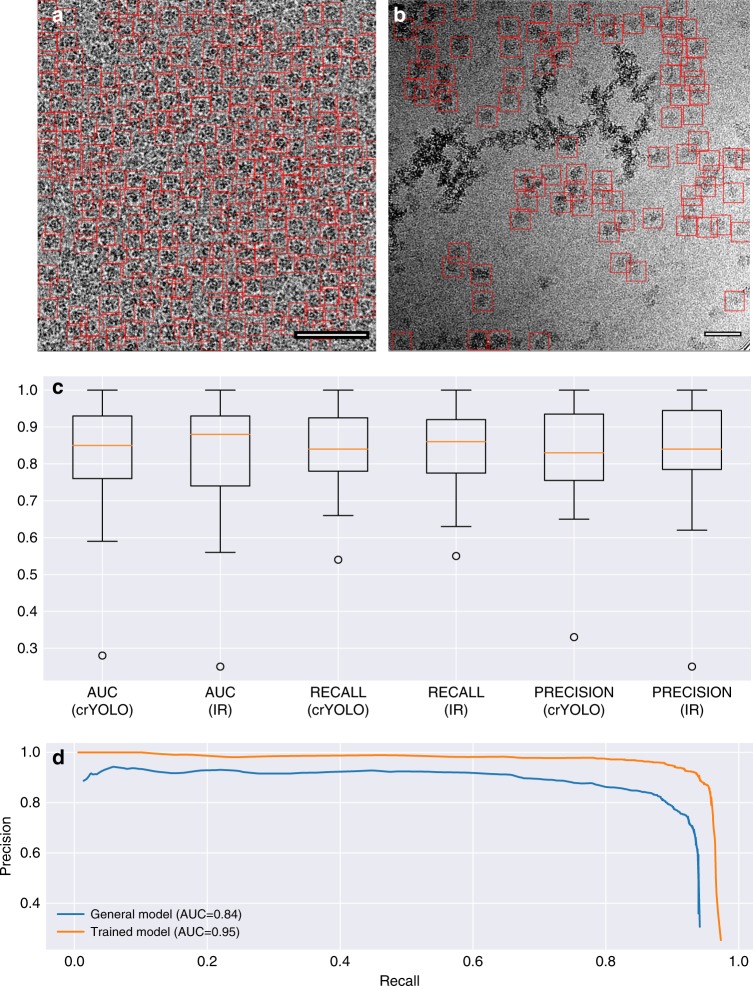
Selecting particles from digital micrographs is an essential step in single-particle electron cryomicroscopy (cryo-EM). As manual selection of complete datasets-typically comprising thousands of particles-is a tedious and time-consuming process, numerous automatic particle pickers have been developed. However, non-ideal datasets pose a challenge to particle picking. Here we present the particle picking software crYOLO which is based on the deep-learning object detection system You Only Look Once (YOLO). After training the network with 200-2500 particles per dataset it automatically recognizes particles with high recall and precision while reaching a speed of up to five micrographs per second. Further, we present a general crYOLO network able to pick from previously unseen datasets, allowing for completely automated on-the-fly cryo-EM data preprocessing during data acquisition. crYOLO is available as a standalone program under http://sphire.mpg.de/ and is distributed as part of the image processing workflow in SPHIRE.

Keywords: Cryoelectron microscopy; Data processing.


Conflict of interest statement

Competing interestsThe authors declare no competing interests.

Figures

Fig. 1
Fig. 1
Training and picking in crYOLO. a With the YOLO approach the complete micrograph is taken as the input for the CNN. When the image is passed through the network the image is spatially downsampled to a small grid. Then YOLO predicts for each grid cell if it contains the center of a particle bounding box. If this is the case, it estimates the relative position of the particle center inside the cell, as well as the width and height of the bounding box. During training, the network only needs labeled particles. Furthermore, as the network sees the complete micrograph, it learns the context of the particle. b During picking crYOLO processes up to five micrographs per second and thus outperforms the sliding-window approach
Fig. 2
Fig. 2
Graphical tool for creating training data and visualizing results. The tool can read images in MRC, TIFF, and JPG format and box files in EMAN1 and STAR format. The example shown is a micrograph of TRPC4 with many contaminants
Fig. 3
Fig. 3
Selection of TcdA1 particles and structural analysis. ac Representative digital micrograph (micrograph number 0169) taken from the EMPIAR-10089 dataset. Red boxes indicate the particles selected by a Gauss-Boxer, b crYOLO, or c the generalized crYOLO network. Scale bar, 50 nm. d Summary of particle selection and structural analysis of the three datasets. All datasets were processed using the same workflow in SPHIRE. e Representative reference-free 2-D class averages of TcdA1 obtained using the ISAC and Beautifier tools (SPHIRE) from particles picked using crYOLO. Scale bar, 10 nm. f Fourier shell correlation (FSC) curves of the 3-D reconstructions calculated from the particles selected in crYOLO and Gauss-Boxer. The FSC 0.143 between the independently refined and masked half-maps indicates resolutions of ~3.4 and ~3.5 Å, respectively. g The final density map of TcdA1 obtained from particles picked by crYOLO is shown from the side and is colored by subunit. The reconstruction using particles from the generalized crYOLO network is indistinguishable
Fig. 4
Fig. 4
Selection of NOMPC particles and structural analysis. a, b Representative micrograph (micrograph number 1854) of the EMPIAR-10093 dataset. Particles picked by a crYOLO or b RELION, respectively, are highlighted by red boxes. Scale bar, 50 nm. c Summary of particle selection and structural analysis using RELION and crYOLO/SPHIRE. d Representative reference-free 2-D class averages obtained using the ISAC and Beautifier tools (SPHIRE) from particles selected by crYOLO. Scale bar, 10 nm. e FSC curves and f final 3-D reconstruction of the NOMPC dataset obtained from particles picked using crYOLO and processed with SPHIRE. The 0.143 FSC between the masked and unmasked half-maps indicates resolutions of 3.4 and 3.8 Å, respectively. The 3-D reconstruction is shown from the top and side. To allow better visualization of the nanodisc density, the unsharpened (gray, transparent) and sharpened map (colored by subunits) are overlaid. g Comparison of the density map obtained by crYOLO/SPHIRE with the deposited NOMPC 3-D reconstruction EMDB-8702
Fig. 5
Fig. 5
Selection of Prx3 particles and structural analysis. a, b Particles selected on a representative micrograph (micrograph number 19.22.14) of the EMPIAR-10050 dataset using either a crYOLO or b EMAN2. Scale bar, 100 nm. c Summary of particle selection and structural analysis. The resolution in parentheses is the result obtained after a 3-D refinement performed in SPHIRE using the final 8562 particles of the original dataset. d Representative 2-D class averages obtained from two rounds of classification using the crYOLO-selected particles and ISAC. Scale bar, 10 nm. Well-centered examples for all views showing high-resolution details can be readily obtained from the data. e Fourier shell correlation plots for the final 3-D reconstruction (black) using the crYOLO-selected particles or the 8562 particles from the original dataset (gray). The average resolution of our 3-D reconstruction is ~4.6 Å, whereas that one from the originally used particles is ~4.5 Å. f Top and side views of the 3-D reconstruction obtained with crYOLO/SPHIRE. For clarity, all subunits are colored differently in the reconstruction
Fig. 6
Fig. 6
SNR dependence of crYOLO. a Noise-level dependency of crYOLO picking simulated TRPC4 particles (EMD-4339) measured by the area under the precision-recall curve (AUC). The AUC stays above 0.8 up to a noise level of 6 (SNR 0.041). b Example micrographs for the noise levels of 1, 4, and 8
Fig. 7
Fig. 7
Training of crYOLO on KLH. a One example of a particle picking result by crYOLO trained for all views with 14 micrographs of the full KLH dataset and b trained only for side views. Scale bar, 70 nm. c Precision-recall curves for the low defocus micrographs of the KLH dataset using several training set sizes (Supplementary Data 1). The curves were estimated based on 17 randomly selected test micrographs out of the full dataset. The AUC values are 0.97 (blue), 0.94 (orange), 0.9 (green)
Fig. 8
Fig. 8
Computational efficiency statistics of training and particle selection. The crYOLO training times for TcdA1, NOMPC, and Prx3 were 400s, 300s, and 343s, respectively (blue bars). The red bars depict the number of processed micrographs per second during particle selection. Error bars represent SD, measured by training and applying crYOLO three times (black circle). All datasets were picked in less than a quarter of a second per image. For TcdA1, crYOLO needed 0.19 s per micrograph, 0.23 s for NOMPC, and 0.21 s for Prx3
Fig. 9
Fig. 9
Generalized crYOLO network. a, b Particles selected on a representative micrograph of glutamate dehydrogenase (EMPIAR 10127) and RNA polymerase (EMPIAR 10190). None of the datasets were included in the set used for training the generalized crYOLO network. Scale bars, 50 nm. c AUC, recall, and precision of the datasets included into the general model evaluated for the crYOLO network architecture and the Inception-ResNet (IR) architecture (Supplementary Data 2). The box shows the lower and upper quartiles with a line as median. The whiskers represent the range of the data, whereas the points represent outliers. d Precision-recall curves for TcdA1 picked with either a network directly trained on the TcdA1 dataset (orange) and the general model but not on TcdA1 (blue) (Supplementary Data 3)

References

    1. Voss NR, Yoshioka CK, Radermacher M, Potter CS, Carragher B. DoG Picker and TiltPicker: software tools to facilitate particle selection in single particle electron microscopy. J. Struct. Biol. 2009;166:205–213. doi: 10.1016/j.jsb.2009.01.004. - DOI - PMC - PubMed
    1. Ogura T, Sato C. An automatic particle pickup method using a neural network applicable to low-contrast electron micrographs. J. Struct. Biol. 2001;136:227–238. doi: 10.1006/jsbi.2002.4442. - DOI - PubMed
    1. Volkmann N. An approach to automated particle picking from electron micrographs based on reduced representation templates. Journal of Structural Biology. 2004;145(1-2):152–156. doi: 10.1016/j.jsb.2003.11.026. - DOI - PubMed
    1. Nicholson WV, Glaeser RM. Review: automatic particle detection in electron microscopy. J. Struct. Biol. 2001;133:90–101. doi: 10.1006/jsbi.2001.4348. - DOI - PubMed
    1. Huang Z, Penczek PA. Application of template matching technique to particle detection in electron micrographs. J. Struct. Biol. 2004;145:29–40. doi: 10.1016/j.jsb.2003.11.004. - DOI - PubMed

Publication types