. 2019 Dec 31;58(52):5259-5270.
doi: 10.1021/acs.biochem.9b00140. Epub 2019 Jun 26.

Control of Metabolite Flux during the Final Steps of Heme b Biosynthesis in Gram-Positive Bacteria

Affiliations

Control of Metabolite Flux during the Final Steps of Heme b Biosynthesis in Gram-Positive Bacteria

Arianna I Celis et al. Biochemistry. .

Abstract

The pathway for assembling heme ends with a unique set of enzymes in Gram-positive bacteria. Substrates for these reactions include coproporphyrin III, Fe(II), and H2O2, which are highly reactive and toxic. Because these bacteria lack membranous compartments, we hypothesized that metabolite flux may occur via a transient protein-protein interaction between the final two pathway enzymes, coproporphyrin ferrochelatase (CpfC) and coproheme decarboxylase (ChdC). This hypothesis was tested using enzymes from the pathogen Staphylococcus aureus and a corresponding ΔchdC knockout strain. The ultraviolet-visible spectral features of coproporphyrin III served as an in vitro indicator of a protein-protein interaction. A CpfC-ChdC KD of 17 ± 7 μM was determined, consistent with transient complexation and supported by the observation that the catalytic competence of both enzymes was moderately suppressed in the stable complex. The ΔchdC S. aureus was transformed with plasmids containing single-amino acid mutants in the active site gate of ChdC. The porphyrin content and growth phenotypes of these mutants showed that K129 and Y133 promote the ChdC-CpfC interaction and revealed the importance of E120. Understanding the nature of interactions between these enzymes and those further upstream in the heme biosynthesis pathway could provide new means of specifically targeting pathogenic Gram-positive bacteria such as S. aureus.


Conflict of interest statement

The authors declare no competing financial interest.

Figures
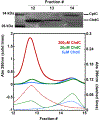
Figure 1.
Figure 1.
Coproheme transfer occurs from CpfC to ChdC at increasing concentrations of ChdC. ChdC (0, 5, 20, 50, or 200 μM) was added to a pre-equilibrated mixture of 10 μM coproheme and 20 μM CpfC. The mixture was incubated for 30 min before being loaded onto an analytical size-exclusion chromatography column. SDS–PAGE was used for identification of proteins (ChdC MW = 29.5 kDa; CpfC MW = 35 kDa) eluting from the SEC column. ChdC eluted between fractions 12 and 13, while CpfC eluted in fraction 14. Representative SEC chromatograms are shown for samples incubated with 5, 20, and 200 μM ChdC. The UV–vis signal was measured at both 280 nm (indicating protein content, solid lines) and 396 nm (indicating coproheme content, dashed lines). Complete transfer of copropheme from CpfC to ChdC occurred only at ChdC concentrations of ≥50 μM.
Figure 2.
Figure 2.
Coproporphyrin and coproheme UV–vis spectra suggest an interaction between CpfC and ChdC. UV–vis spectra were measured for (a) 5 μM coproporphyrin or (b) 5 μM coproheme in 50 mM Tris (pH 8) and 150 mM NaCl (green) and in the presence of 20 μM CpfC (red), 20 μM ChdC (blue), or 20 μM CpfC and 100 μM ChdC (black). The inset shows Q-bands of the porphyrin/heme in each of the different environments on an amplified scale. The strong distinctions between the coproporphyrin spectra suggested that UV–vis spectroscopy could be used to report on its chemical environment in a straightforward fashion.
Figure 3.
Figure 3.
Affinity of the CpfC–ChdC complex that is consistent with a transient protein–protein interaction. A preformed coproporphyrin–CpfC complex was generated by equilibrating 5 μM coproporphyrin with 20 μM CpfC (red). ChdC was added titrimetrically (gray spectra, representing additions leading to final pre-equilibrated concentrations of 40, 80, 100, 200 and μM ChdC) until the spectral changes ceased and a final spectrum was obtained (black). The top inset shows the change in absorbance at 418 nm as a function of the titrated concentration of ChdC (red). This was fit to the Langmuir–Hill equation to determine a KD for the coproporphyrin–CpfC complex with ChdC. In blue, similar data and a curve fit showing CpfC complexation with a preformed coproporphyrin–ChdC complex are shown (bottom inset, blue). These data were used to compute a dissociation constant for the two proteins, ChdC and CpfC.
Figure 4.
Figure 4.
CpfC–ChdC complex that does not enhance, but slightly impairs, the intrinsic reactivity of CpfC with coproporphyrin. (a) The CpfC–coproporphyrin complex (red line) was formed by incubating 5 μM coproporphyrin with 20 μM CpfC [50 mM Tris (pH 8) and 150 mM NaCl at 20 °C]. Fe(II) (10 μM) was added to initiate the metalation reaction, and spectra were measured every 30 s for 10 min (black). In the absence of ChdC, the reaction was complete by 8 min, yielding the characteristic spectrum of the ChdC–coproheme complex (purple, Table S1). (b) The CpfC–ChdC–coproporphyrin complex (black line) was formed by incubating 5 μM coproporphyrin, 20 μM CpfC, and 100 μM ChdC under the same conditions as in panel a. Fe(II) (10 μM) was added to initiate the metalation reaction, and spectra were measured over time. The characteristic spectrum of the coproporphyrin–CpfC–ChdC complex underwent little to no change following the addition of Fe(II) for ≤30 min (purple).
Figure 5.
Figure 5.
CpfC–ChdC complex that moderately truncates the intrinsic reactivity of ChdC. (a) The ChdC–coproheme complex (forest green) was formed by incubating 5 μM coproheme with 100 μM ChdC (50 mM KPi, pH 7.4, 20 °C). Ten equivalents of H2O2 relative to the ChdC monomer, previously shown to be sufficient for full conversion of the starting complex to the ChdC–heme complex (lime green), was titrimetrically added to observe the double-decarboxylation reaction (gray spectra, one spectrum per 2 equiv of H2O2). (b) The CpfC–ChdC–coproheme complex (purple) was formed by incubating 5 μM coproheme with 20 μM CpfC and 100 μM ChdC (50 mM KPi, pH 7.4, 20 °C). H2O2 was titimetrically added as described above, monitoring spectral changes after each addition (gray spectra, one spectrum per 2 equiv of H2O2). The reaction went to completion after the addition of 16 equiv of H2O2.
Figure 6.
Figure 6.
ChdC active site gate that may play a role in a CpfC–ChdC protein–protein interaction. Juxtaposed structures of (a) apo-ChdC (tan, Protein Data Bank entry 1T0T) and (b) coproheme-bound ChdC (green, Protein Data Bank entry 5T2K, both structures from Geobacillus thermophilus) reveal a mobile active site loop (amino acids ~110–135) that closes in toward the active site to sequester coproheme (arrows in panel a indicate the direction of the change in the residue position upon coproheme binding). Solvent-exposed areas of the active site are colored gray. Point mutations were generated at the positions shown. The mutant proteins and the phenotype of a complemented ΔchdC strain were characterized. Note that the residue at position 129 is a lysine in the S. aureus homologue. The locations of residues 114–119 could not be crystallographically mapped and are missing in the 5T2K structure (b).
Figure 7.
Figure 7.
E120L and N112L chdC variants in S. aureus Newman exhibit growth defects. Representative growth curves for the ΔchdC strain complemented with an empty vector, WT chdC or chdC variants, were measured in (a) unsupplemented RPMI containing 1% casamino acids and 4 mg/mL glycerol or (b) the same medium supplemented with 1 μM heme. In the absence of added heme, the Y113F, D121V, K129A, R131A, and Y133F variants (gray lines) all grew like WT. The N112L, E120L, and ΔchdC strains (green, pink, and red, respectively) each exhibited growth delays and reduced growth yields. The defects in both E120L and ΔchdC could be reversed by the addition of exogenous heme to the growth medium. The N112L strain exhibited had an even longer lag phase in the presence of added heme.
Figure 8.
Figure 8.
E120L, Y133F, and K129A ChdC protein variants exhibit substrate turnover characteristics equivalent to those of WT. (a) Coproheme-bound E120L, Y133F, or K129A ChdC protein (5 μM) was each reacted with 10 equiv of H2O2 (50 mM KPi, pH 7.4). Subsequent conversion of the ChdC–coproheme complex (dark green) to the ChdC–heme complex (light green) was monitored over time via UV–vis spectroscopy (Soret shift from 393 to 406 nm; spectra measured every 30 s after mixing are colored charcoal). Similar data were measured for each protein variant. Representative data measured for E120L are shown. (b) The substrate (coproheme), product (heme), and 3-propionate-containing stable intermediate (harderoheme) were quantified via HPLC following addition of increasing numbers of equivalents of H2O2 under conditions identical to those used in panel a. All mutations led to no change in the number of equivalents required to effect full turnover. Representative data for E120L are again shown.
Figure 9.
Figure 9.
Y133F and K129A ChdC variants are largely unable to interact with CpfC. Coproporphyrin (5 μM) bound to 20 μM HemH (red spectrum, 405 nm Soret peak) was titrated with increasing equivalents of WT, E120L, Y133F, or K129A ChdC as shown [≤200 or 300 μM, in 50 mM Tris-HCl (pH 8) and 150 mM NaCl]. Changes at 418 nm were monitored via UV–vis following additions in increments of 20 μM ChdC (charcoal spectra). E120L ChdC formed a sharp and distinct 418 nm peak, just like WT, showing its ability to interact with ChdC. Y133F and K129A ChdC did not form a 418 nm peak, even upon addition of 300 μM ChdC.
Figure 10.
Figure 10.
CpfC has a solvent-exposed porphyrin binding site with flanking polar residues that may interact with ChdC. Juxtaposed structures of (a) B. subtilis CpfC bound to N-methylmesoporphyin (purple, Protein Data Bank entry 1C1H) and (b) H. sapien PfpC bound to protoporphyrin IX (only one monomeric unit shown, pink, Protein Data Bank entry 2QD1). CpfC has a largely solvent-exposed active site that may allow for porphyrin transfer with ease upon interaction with ChdC. This is unlike the PPD branch ferrochelatase enzyme, PpfC, which is a membrane-bound dimer containing a characteristic “active site lip” (light pink) that moves toward and completely occludes the active site in the presence of porphyrin.
Scheme 1.
Scheme 1.. PPD and CPD Branches of Heme b Biosynthesis Differ in the Terminal Three Stepsa
aThe terminal steps of heme biosynthesis employ reactive and potentially toxic substrates. In contrast to the enzymes of the canonical pathway (PPD branch, blue), all three of which are membrane-associated and/or compartmentalized, the enzymes that catalyze the last three steps of the CPD branch (purple) are found in Gram-positive organisms that lack cellular membranes for restricting their locations within the cell.

Similar articles

Cited by

References

    1. Dailey HA, Gerdes S, Dailey TA, Burch JS, and Phillips JD (2015) Noncanonical coproporphyrin-dependent bacterial heme biosynthesis pathway that does not use protoporphyrin. Proc. Natl. Acad. Sci. U. S. A 112, 2210–2215. - PMC - PubMed
    1. Hamza I, and Dailey HA (2012) One ring to rule them all: trafficking of heme and heme synthesis intermediates in the metazoans. Biochim. Biophys. Acta, Mol. Cell Res 1823, 1617–1632. - PMC - PubMed
    1. Gillam ME, Hunter GA, and Ferreira GC (2013) The Ultimate Step of Heme Biosynthesis: Orchestration Between Iron Trafficking an dPorphyrin Synthesis In Handbook of Porphyrin Science, pp 130–174, EBCO Publishing.
    1. Ferreira GC, Andrew TL, Karr SW, and Dailey HA (1988) Organization of the terminal two enzymes of the heme biosynthetic pathway. Orientation of protoporphyrinogen oxidase and evidence for a membrane complex. J. Biol. Chem 263, 3835–3839. - PubMed
    1. Yuan X, Rietzschel N, Kwon H, Walter Nuno AB, Hanna DA, Phillips JD, Raven EL, Reddi AR, and Hamza I (2016) Regulation of intracellular heme trafficking revealed by subcellular reporters. Proc. Natl. Acad. Sci. U. S. A 113, E5144–E5152. - PMC - PubMed

Publication types